Abstract
A new phosphorescent zinc sensor (ZIrF) was constructed based on an Ir(III) complex bearing two 2-(2,4-difluorophenyl)pyridine (dfppy) cyclometalating ligands and a neutral 1,10-phenanthroline (phen) ligand. A zinc-specific di(2-picolyl)amino (DPA) receptor was introduced at the 4-position of the phen ligand via a methylene linker. The cationic Ir(III) complex exhibited dual phosphorescence bands in CH3CN solutions originating from blue and yellow emission of the dfppy and phen ligands, respectively. Zinc coordination selectively enhanced the latter, affording a phosphorescence ratiometric response. Electrochemical techniques, quantum chemical calculations, and steady-state and femtosecond spectroscopy were employed to establish a photophysical mechanism for this phosphorescence response. The studies revealed that zinc coordination perturbs nonemissive processes of photoinduced electron transfer (PeT) and intraligand charge transfer (ILCT) transition occurring between DPA and phen. ZIrF can detect zinc ions in a reversible and selective manner in buffered solution (pH 7.0, 25 mM PIPES) with Kd = 11 nM and pKa = 4.16. Enhanced signal-to-noise ratios were achieved by time-gated acquisition of long-lived phosphorescence signals. The sensor was applied to image biological free zinc ions in live A549 cells by confocal laser scanning microscopy. A fluorescence lifetime imaging microscope (FLIM) detected an increase in photoluminescence lifetime for zinc-treated A549 cells as compared to controls. ZIrF is the first successful phosphorescent sensor that detects zinc ions in biological samples.
I. Introduction
Signal transduction by d-block metal ions plays an important role in many biological functions that underlie human physiology and pathology.1–3 Of particular interest is divalent zinc, which exists in both tightly bound and mobile forms.4,5 The latter, alternatively referred to as loosely bound, chelatable, or free zinc, occurs in organs such as brain,6,7 intestine,8 pancreas,9 retina,10 prostate,11 olfactory bulb,12 and spermatic sac.13 Mobile zinc has been associated with brain function,14,15 gene transcription, the immune response,16 and reproduction.13 The intracellular concentration of mobile zinc is tightly regulated and varies from pM to mM depending on the organ.3 Failure of mobile zinc homeostasis has been linked to pathological states,17 including Alzheimer’s disease,18,19 epilepsy,17 ischemic stroke,20–22 and infantile diarrhea.23 These findings have evoked great interest in mobile zinc biology, but much is still unknown about the molecular mechanisms of its homeostasis and pathophysiology.
Because many conventional spectroscopic tools for d-block metal ions cannot be applied to study spectroscopically silent Zn2+, photoluminescent sensors have been devised for the purpose3,24–30 since the first report on a quinoline-based fluorescent zinc sensor.31 Various zinc-specific receptors have been developed in order to tune the pKa32–38 and zinc dissociation constant (Kd) of the sensor,39–43 representative examples of which include DPA (di(2-picolyl)amine), DPEN (N,N-di(2-picolyl)ethylenediamine), TRPEN (N,N,N′-tris(2-picolyl)ethylenediamine), quinoline, 2,2′-bipyridine, polyalkylamine, and iminodiacetate.44 Conjugating these zinc-specific receptors onto fluorescent chromophores such as fluorescein,32–35,41,42,45–55 coumarin,56,57 quinoline,31,58–63 and 4-nitrobenzo-oxadiazole64–66 has produced a variety of fluorescence turn-on31,32,47,49,52,63,65–85 and ratiometric sensors.49,56,61,86–110 Despite their attractive features, fluorescent zinc sensors have some significant drawbacks, especially intrinsic signal contamination by autofluorescence and scattered light, which increases background and diminishes signal fidelity. Although approaches such as NIR emission111,112 have been pursued, reduction of the background was an unsolved problem.
Photoluminescent compounds exhibiting long-lifetime emission offer another means of eliminating unwanted background. The time delay between photoexcitation and acquisition of signals avoids contamination by scattered light and autofluorescence because of short emission lifetimes, typically ≤ 100 ns. Phosphorescent transition metal complexes of Ru, Re, Pt, Os, and Ir cores are attractive candidates because their emission is characterized by high photoluminescence quantum yields at room temperature, physicochemical stability, and wide ligand tunability as well as long (several microseconds) photoluminescence lifetimes.113,114 Taking advantage of these favorable photophysical properties, various phosphorescent sensors based on the transition metal complexes have been developed targeting metal ions, anions, and small molecules.115 Although Ru,116 Pt,117 and Ir118,119 complexes can detect zinc by phosphorescence signaling, they have thus far not been suitable for in vivo detection of the ion.
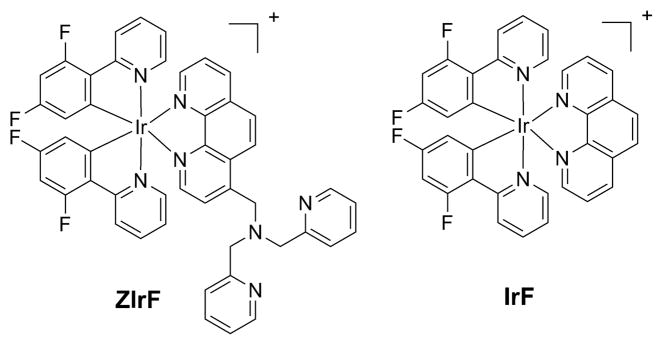
In the present article we describe the design, synthesis, and evaluation of the phosphorescent mobile zinc sensor, ZIrF (Chart 1). The zinc-sensing capability of ZIrF was examined in acetonitrile and buffered aqueous (pH 7.0, 25 mM PIPES) solutions. A photophysical mechanism describing the phosphorescence response to zinc ions was established. The utility of ZIrF for zinc sensing by long-lifetime emission was demonstrated by time-gated acquisition of signals that were contaminated by fluorescence from 10-methylacridinium ion (Acr+) ion, an analog of the coenzyme NAD+, nicotinamide adenine dinucleotide.120 Finally, photoluminescence intensity-based imaging by confocal laser scanning microscopy and lifetime-based imaging by fluorescence lifetime imaging microscopy (FLIM) studies were performed to validate the ability of ZIrF to detect intracellular mobile zinc.
Chart 1.
Structures of the Phosphorescent Zinc Sensor ZIrF and the Reference Probe IrF
II. Experimental Details
Spectroscopic Measurements
Milli-Q grade water (18.2 MΩ·cm) was used to prepare solutions for spectroscopic measurements. PIPES (piperazine-N,N′-bis(2-ethanesulfonic acid), ≥99%) was purchased from Aldrich. A pH 7.0 buffer solution was prepared by dissolving PIPES (25 mM) in milli-Q water and adjusting the pH with a standard KOH solution (45 wt %, Aldrich) or a HCl solution (1 N, Aldrich). The buffer solution was further treated with Chelex®100 resin (BIO-RAD) to remove trace metal ions and filtered through a membrane (pore size = 0.45 μm). The pH of the buffer solution was verified before use. Fresh metal stock solutions (typically, 0.1 or 0.01 M except for CrCl3·6H2O (1 mM; Aldrich)) were prepared in milli-Q water using the corresponding chloride salts: CuCl2 (99.999%, Aldrich), NaCl (≥99.5%, Aldrich), KCl (puratonic grade, Calbiochem), MgCl2 (99.99%, Aldrich), CaCl2 (99.99%, Aldrich), CrCl3·6H2O (98%, Aldrich), MnCl2 (99.99%, Aldrich), FeCl2 (99.99%, Aldrich), CoCl2 (99.9%, Aldrich), NiCl2 (99.99%, Aldrich), ZnCl2 (99.999%, Aldrich), and CdCl2 (99.999%, Aldrich). A TPEN solution was prepared by dissolving N,N,N′,N′-tetrakis(2-picolyl)ethylenediamine (≥99%, Sigma) in DMSO (99.9%, Aldrich). Zn(ClO4)2·6H2O (Aldrich) was dissolved in CH3CN (spectrophotometric grade, Aldrich) to 1 mM and 10 mM concentration. The sensor was dissolved in DMSO to a concentration of 10 mM. The sensor solution was partitioned into Eppendorf centrifuge tubes and stored frozen at 4 °C. For spectroscopic measurements, the sensor solution was thawed just before running experiments. Typically, 3 mL of pH 7.0 buffer and 3 μL of the sensor solution (10 mM) were mixed to give a 10 μM solution. Acetonitrile solutions (spectrophotometric grade, Aldrich) of ZIrF (10 μM) were freshly prepared before measurements. A 1 cm × 1 cm fluorimeter cell with a screw septum cap (Starna) was used for steady-state optical measurements. UV-vis absorption spectra were collected on a Varian Cary 1E double-beam scanning spectrophotometer at 25 °C. Phosphorescence spectra were obtained by using a Photon Technology International (NJ) Quanta Master 30 spectrofluorimeter at 25 °C or a Quanta Master 40 scanning spectrofluorimeter at room temperature (~25 °C). The solutions were excited by using an excitation beam at 340 nm throughout the phosphorescence measurements unless otherwise noted. A 3 μL portion of a 1 mM ZnCl2 or Zn(ClO4)2 solution was added per each titration step. Photoluminescence measurements at low temperature were performed by integrating a cryostat (Optistat®DN, Oxford Instruments) into a Quanta Master 40 spectrofluorimeter. Cryogenic temperatures were maintained by liquid nitrogen, and the temperature was controlled by an ITC 601PT temperature controller (Oxford Instruments). He gas was allowed to fill the sample compartment of the cryostat. pH titrations of phosphorescence intensity (P.I.) were conducted with KOH solutions (milli-Q water, pH = 12) containing KCl (100 mM) and the sensor (10 μM) by the addition of aqueous HCl solutions (6, 2, 1, 0.5, 0.1, or 0.05 M). pKa was determined using eq 1, where A and B are proportionality constants.
| (1) |
The phosphorescence quantum yield (Φp) was determined through an absolute method by employing an integrating sphere. The CH3CN solutions containing ZIrF (O.D. = 0.2) with or without zinc ion (~ 10 equiv) were excited by a 420 nm beam and the total emission was collected for integration. All solutions for phosphorescence measurements were air-equilibrated except those used to measure phosphorescence quantum yields, photoluminescence lifetimes, and femtosecond transient absorptions. Other experimental conditions were described previously.121 Time-resolved emission spectra (TRES) were acquired through a time-correlated single photon counting technique by using a FluoTime 200 instrument (PicoQuant, Germany). A 342 nm diode laser (pulse energy = 35 pJ) with repetition rate of 125 kHz was used as the excitation source. The phosphorescence signal from 430 nm to 700 nm was collected through an automated motorized monochromator and recorded with a NanoHarp 250 unit at a step size of 5 nm. The TRES experiment was performed in duplicate using freshly prepared samples.
Determination of Kd
An approach previously reported by us53,122 was used to determine Kd for Zn(II) binding to ZIrF. An equilibrium model for the formation of a 1:1 ligand:metal complex was applied. Mathematical derivations of equations 2 and 3 (see Results and Discussion) are described in Supporting Information. A non-linear least squares method was applied to fit the titration data to eq 2 for the determination of Kd, which subsequently gave a set of free zinc ion concentrations ([Zn]free) after applying eq 3. The free zinc ion concentration was used to update the Kd. This procedure was iterated (Kd and [Zn]free) until the r2 value of the nonlinear least squares fit result could not be improved. A curve-fitting module embedded in a Microcal Origin 7.5 software (OriginLab, Northampton, MA) was used for this purpose. Phosphorescence titration experiments were carried out in triplicate with samples prepared from different preparation batches.
Time-Gated Photoluminescence
Time-gated acquisition of photoluminescence spectra was performed by employing the TRES technique (see Spectroscopic Measurements). ZIrF (10 μM) and 10-methylacridinium perchlorate (2 μM) were dissolved in pH 7.0 buffered solutions (25 mM PIPES, air-equilibrated). Delayed photoluminescence spectra acquired after 100 ns did not contain fluorescence originating from 10-methylacridinium ion. Thus, a photoluminescence spectrum at 120 ns delay was chosen and compared with the total photoluminescence spectrum.
Electrochemical Measurements
Cyclic voltammetry experiments were carried out with a CHI630 B instrument (CE Instruments, Inc.) using three electrode assemblies. Pt wires were used as working and counter electrodes. The Ag/AgNO3 (10 mM) couple was employed as a reference electrode. Measurements were carried out in Ar-saturated CH3CN solutions (3 mL) with tetrabutylammonium hexafluorophosphate as supporting electrolyte (0.1 M) at a scan rate of 100 mV/s. The concentration of ZIrF was 1 mM. The ferrocenium/ferrocene couple was employed as an external reference.
Calculations
Quantum chemical calculations based on density functional theory (DFT) were carried out using Gaussian 03.123 An N,N-trans structure was employed as the starting geometry. Ground state geometry optimization and single point calculations were performed using Becke’s three parameter B3LYP exchange-correlation functional124–126 and the “double–ξ” quality LANL2DZ basis set127 for the Ir atom and the 6-31G+(d,p) basis set for the other atoms. A pseudo potential (LANL2DZ) was applied to replace inner core electrons of the Ir atom, leaving the outer core [(5s)2(5p)6] electrons and the (5d)6 valence electrons. Frequency calculations were subsequently performed to assess stability of the convergence. For TD-DFT calculations, the unrestricted UB3LYP functional and the identical basis sets used for the geometry optimization were applied to the optimized geometry. The polarizable continuum model (C-PCM) with a parameter set for water was applied to account for solvation effects. Twenty lowest triplet and singlet states were calculated and analyzed. Calculation of the MLCT contribution to the excited states was performed by adopting a method described previously.128
Cell Culture
A549 cells were cultured in RPMI 1640 medium (PAA) supplemented with 10% fetal bovine serum, penicillin (100 units/mL), and streptomycin (100 μg/mL) at 37 °C in a humidified incubator under 5% CO2.
MTT Assays
A549 cells were seeded into a 96-well plate and incubated for 24 h. The cells were treated with ZIrF at the indicated concentrations and incubated. After 5 h, the cells were treated with 20 μL of 3-(4,5-dimethylthiazol-2-yl)-2,5-diphenyltetrazolium bromide (MTT, 2 mg/mL, Sigma) and incubated for additional 4 h. HeLa cells were treated identically except using a 12 h incubation period. After removing the medium, 100 μL of DMSO was added to each well. The absorption signal at 595 nm of the purple formazan solution was recorded by using a Molecular Devices SPECTRAMAX microplate reader.
Phosphorescence Microscopy
One day before imaging, A549 cells were plated onto glass-bottom culture dishes. A solution of ZnCl2 and sodium pyrithione (NaPT) (Zn/NaPT; 1:1, v/v) was prepared just before cell treatment. The cells were thoroughly washed with PBS three times and supplemented with serum-free RPMI 1640 medium. Then, cells were treated with ZIrF (5 μM) and incubated for 30 min, after which phosphorescence microscope images were acquired. Subsequently, the cells were treated with the Zn/NaPT (50 μM). After 15 min, phosphorescence microscopy images were taken and TPEN was added (100 μM). To prepare fixed cells, the medium was removed from the culture dishes and the cells were rinsed with PBS. The cells were fixed using 4% formaldehyde (A549 cells) or MeOH (HeLa cells) and mounted with VECTASHIELD. A Carl Zeiss LSM 510 META confocal laser scanning microscope was used to obtain phosphorescence images. An excitation beam (405 nm) was focused onto the dish and the signals were acquired through an emission band-pass filter (505 – 570 nm). Phosphorescence images and mean intensity were analyzed using a LSM 510 version 4.0 software. A Zeiss Axiovert 200M epifluorescence microscope equipped with a 63× oil-immersion objective was used to assess the photostability of photoluminescence signals from dye-treated HeLa cells. ZIrF-treated live cells were excited by using an Exfo X-Cite 120 mercury halide lamp and imaged by using a customized filter set that incorporates a DAPI excitation filter and a fluorescein emission filter. A filter set optimized for fluorescein was employed for imaging Zinpyr-1-treated cells. Photoluminescence images were visualized using a Volocity software (Improvision).
Fluorescence Lifetime Microscopy
An inverse time-resolved microscope instrument (PicoQuant MicroTime 200) was employed for fluorescence lifetime imaging (FLIM) experiments. Fixed A549 cells attached onto a slide glass were covered with a thin cover glass, on which an excitation beam was focused. A 375 nm ps pulsed diode laser (< 1 μW) with 2.5 MHz repetition rate was used for excitation. An instrumental response function of the system was ~240 ps at fwhm. A dichroic mirror (Z375RDC, AHF), a long-pass filter (HQ405lp, AHF), a 50-μm pinhole, a band-pass filter of 550 nm (FB550-40, Thorlabs), and a single photon avalanche diode (SPAD) were used to collect emissions from the A549 cells. The time-resolved emission signals were obtained with a time-correlated single photon counting (TCSPC) technique. Typically, an 80 μm × 80 μm sample area consisting of 200 × 200 pixels were scanned with an acquisition rate of 2 ms/pixel. FLIM images and their exponential fits were analyzed by using a SymPhoTime software provided by the manufacturer.
III. Results and Discussion
Synthesis and Calculation
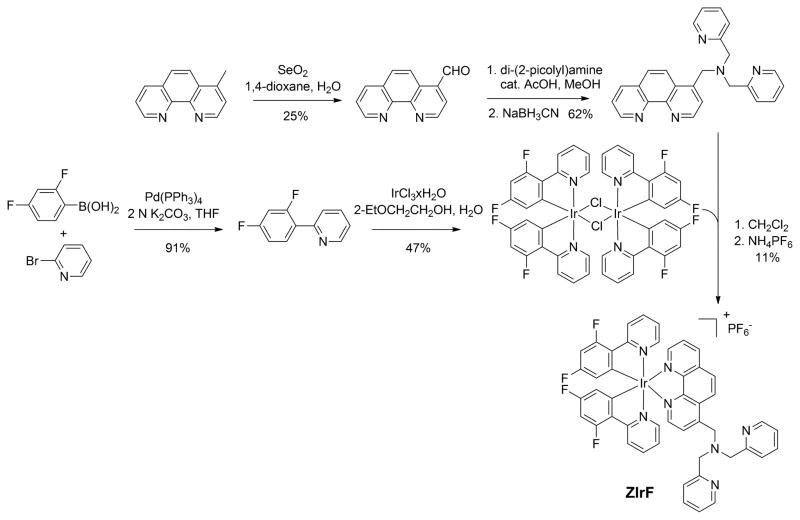
The synthetic route to ZIrF is depicted in Scheme 1. ZIrF was prepared in five steps. The cyclometalated chloride-bridged Ir(III) dimer containing 2-(2,4-difluorophenyl)pyridine (dfppy), [Ir(dfppy)2(μ-Cl)]2, was obtained according to a method described in the literature, which includes Pd(0)-catalyzed Suzuki-Miyaura cross-coupling between 2,4-difluorophenyl boronic acid and 2-bromopyridine followed by a Nonoyama reaction.129,130 A 1,10-phenanthroline ligand linked to a zinc-chelating di(2-picolyl)amino (DPA) moiety was obtained through SeO2-mediated benzylic oxidation of 4-methyl-1,10-phenanthroline, which was subsequently subjected to reductive amination with di(2-picolyl)amine. Finally, substitution of the chlorides in [Ir(dfppy)2(μ-Cl)]2 with the DPA-appended 1,10-phenanthroline ligand was performed, followed by metathesis with NH4PF6 afforded ZIrF. The compound was purified and analyzed by standard procedures to verify the anticipated structure. The cationic sensor was highly soluble in polar organic solvents such as DMSO and buffered aqueous solutions (pH 7.0, 25 mM PIPES) up to concentrations of 10 mM and 100 μM, respectively. A reference compound (IrF) lacking the DPA appendage was prepared in a similar manner.
Scheme 1.
Synthesis of the phosphorescent zinc sensor, ZIrF
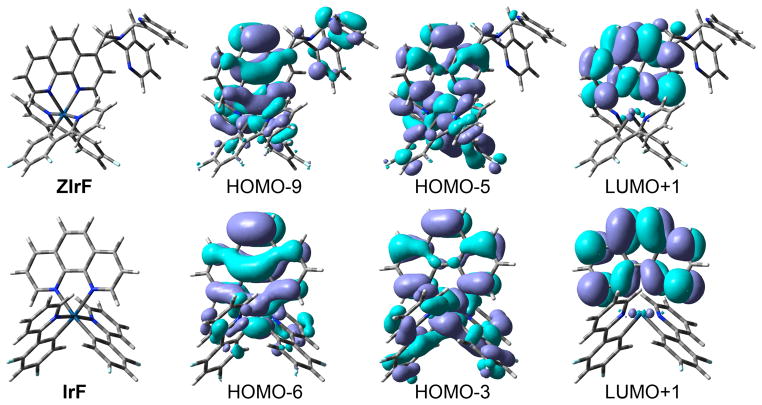
In order to gain insight into the photophysical processes of ZIrF and IrF, DFT (B3LYP/LANL2DZ:6-31+G(d,p)) and TD-DFT (UB3LYP/LANL2DZ:6-31+G(d,p)) calculations were carried out. Figure 1 displays the calculated geometry and molecular orbitals that participate in the lowest energy triplet transitions for both complexes. The calculated structure of the chromophore of ZIrF, [Ir(dfppy)2phen]+, is almost identical to that of IrF (Supporting Information, SI, Table S1), but there is a difference in their simulated electronic transitions (Table 1). IrF has a lowest energy triplet excited state that is composed of a complex set of electronic transitions involving a metal-to-phen charge transfer (MLphenCT) transition, a phen ligand-centered transition (LCphen), and a dfppy ligand-to-phen ligand charge transfer transition (LdfppyLphenCT), which are constructed from HOMO–6, HOMO–3, and LUMO+1. In contrast, ZIrF has an extra charge transfer at the phen ligand (ILphenCT), which occurs from the weakly interacting DPA (HOMO–5 and HOMO–9) to the phen (LUMO+1) orbital. The calculated triplet state energies of ZIrF and IrF are similar, 450 nm and 447 nm, respectively. The MLCT contribution is, however, markedly smaller for ZIrF (6%; c.f., 10% for IrF), which can be ascribed to the presence of the additional ILphenCT transition. Although the oscillator strength for triplet transitions is not provided by the current level of TD-DFT theory, this result suggests that the weaker phosphorescence intensity of ZIrF arises from the MLCT contribution, which is a rough estimate of efficiency for a triplet transition. Another prediction is that phosphorescent MLCT transitions are facile if the ILphenCT transition becomes inaccessible by stabilizing HOMO–5 and HOMO–9. Such a situation is achieved through metal binding to the DPA moiety.
Figure 1.
Calculated geometry and isosurface plot (0.04 e Å−3) of molecular orbitals that participate in the lowest energy triplet transition of ZIrF and IrF, as obtained from Gaussian 03.
Table 1.
Calculated Character of the Lowest Energy Triplet Transitions (T1) in ZIrF and IrFa
| entry | T1 (eV, nm) | participating MO (expansion coefficient) | transition characterb |
|---|---|---|---|
| ZIrF | 2.75 (450) | HOMO–9 → LUMO+1 (0.34) HOMO–5 → LUMO+1 (0.44) |
MLphenCT (6%) + LCphen + LdfppyLphenCT + ILphenCT |
| IrF | 2.77 (447) | HOMO–6 → LUMO+1 (0.38) HOMO–3 → LUMO+1 (0.43) |
MLphenCT (10%) + LCphen + LdfppyLphenCT |
B3LYP/LANL2DZ:6-31+G(d,p)//UB3LYP/LANL2DZ:6-31+G(d,p).
MLphenCT, metal-to-phen ligand charge transfer transition; LCphen, phen ligand-centered transition; LdfppyLphenCT, dfppy ligand-to-phen ligand charge transfer transition; ILphenCT, intraligand charge transfer transition of phen ligand.
Photophysical Characterization and Zinc-sensing Properties
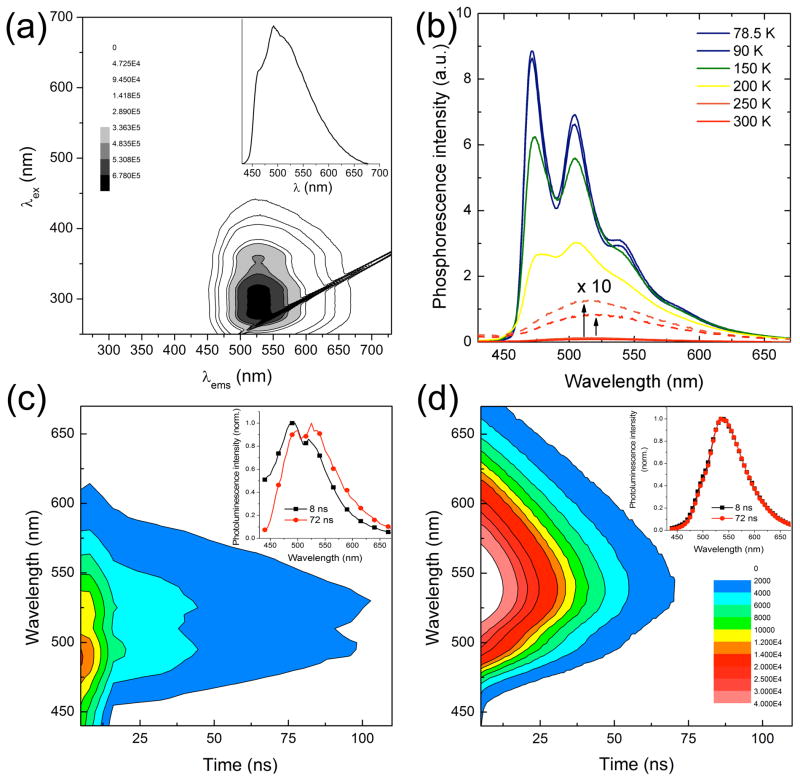
The UV-vis absorption spectrum of ZIrF in CH3CN (10 μM, room temperature) displays a typical π–π* ligand-centered (LC) transition at 262 nm (log ε = 4.73) and a singlet metal-to-ligand charge transfer (1MLCT) transition around 363 nm (log ε = 3.88) (SI, Figure S1 and Table 2). A triplet MLCT (3MLCT) or LC (3LC) transition was observed at 449 nm (log ε = 2.73), which is characteristic of cyclometalated Ir(III) complexes.131 An automated scan of excitation (250 – 700 nm) and emission (250 – 730 nm) wavelengths for ZIrF (10 μM, Figure 2a) established that an effective excitation range for phosphorescence emission is 250 – 400 nm, which corresponds to 1LC or 1MLCT transitions. The phosphorescence spectrum (10 μM, λex = 340 nm) measured at room temperature has a broad emission band with a maximum at 491 nm and shoulders at 461 nm and 528 nm (Figure 2a, inset). Because the phosphorescent platform is a heteroleptic construct having two different chromophoric ligands (dfppy and phen), an excited-state energy equilibrium between the higher energy ligand (dfppy) and the lower energy ligand (phen) was expected.132–135 Thus, the observation of multiple emission bands for ZIrF at 461, 491, and 528 nm can be rationalized by concurrent population of excited states at dfppy and phen ligands due to partial or reverse energy transfer. Phosphorescence spectra measured in frozen CH3CN solutions (10 μM, <150 K) displayed a characteristic emission from the dfppy ligands with sharp vibronic progressions, with Δν = 1351 ± 12 cm−1 (Figure 2b). The 0–0 transition energy of this phosphorescence spectrum is 21300 cm−1, which is identical to that of a previous report of dfppy phosphorescence.136 The emission energy is notably higher than that of low temperature photoluminescence of [Ir(phen)(HDPA)Cl2]+ (HDPA = 2,2′-dipyridylamine), in which the phenanthroline ligand is responsible for phosphorescence.137 Increasing the temperature resulted in a structureless emission with a peak wavelength of 528 nm. This value is bathochromically shifted (Δν = 2292 cm−1) from that of dfppy phosphorescence. The 528 nm emission should be therefore ascribed to phosphorescence of the phen ligand as a consequence of excited-state energy transfer. The rigidochromism, the temperature-dependent shift in emission maxima, indicates the presence of a thermal activation barrier required for the excited-state energy equilibrium. Similar observations were previously reported for other heteroleptic Ir(III) complexes.138,139 The strong charge-transfer (CT) character of the phen ligand phosphorescence was identified by positive solvatochromism revealed in the Lippert-Mataga plot140,141 (SI, Figure S2). We previously observed similar solvatochromic and rigidochromic phosphorescence for a series of Ir(III) complexes exhibiting interligand energy transfer.132,135 In summary, the present steady-state photophysical measurements reveal that ZIrF comprises a unique multichromophoric platform with dual blue (470 nm) and yellow (528 nm) emission.
Table 2.
Photophysical and Electrochemical Properties of ZIrF and Its Zinc Complexa
| entry | λabs (nm, log ε) | λems (nm) | Φp (%) | brightness b | τobs (μs)c | kr (s−1) | knr (s−1) | Eox (V)d |
|---|---|---|---|---|---|---|---|---|
| ZIrF | 262 (4.73), 363 (3.88), 449 (2.73) | 461 (sh), 491, 528 (sh) | 2.0 | 153 | 1.2 | 1.7 × 10⁴ | 8.2 × 10⁵ | 1.28, 1.48, 1.61 |
| + Zn2+ | 261 (4.71), 364 (3.88), 447 (2.83) | 528 | 58 | 4449 | 1.9 | 3.1 × 10⁵ | 2.2 × 10⁵ | 1.60 |
10 μM acetonitrile solutions except for electrochemical measurements.
Brightness = ε355 nm × Φp.
λex = 355 nm and λobs = 500 nm.
Relative to SCE; Pt wires for working and counter electrodes; an Ag/AgNO3 for a reference electrode; 1 mM ZIrF and 0.1 M Bu4NPF6 in Ar-saturated acetonitrile solutions.
Figure 2.
(a) Photoluminescence action spectrum of ZIrF (298 K). Inset figure is phosphorescence spectrum at λex = 340 nm. (b) Phosphorescence spectra at various temperatures (λex = 340 nm). Room temperature time-resolved emission spectra (TRES; λex = 342 nm) of ZIrF in the (c) absence and (d) presence of zinc ion (3 equiv). Inset figures are normalized phosphorescence spectra at delay times of 8 and 72 ns. Identical depth scale is employed for (c) and (d). 10 μM ZIrF in air-equilibrated CH3CN solutions were used for measurements.
Dual emission was further examined by measuring TRES at room temperature (Figures 2c and d). The TRES of the zinc-free ZIrF solution (air-equilibrated) is a mixture of emission from the dfppy and phen components (Figure 2c). Phosphorescence from dfppy ligand (λems = 480 nm) dominates in the short time regime (<16 ns) and then weakens, leaving multiple emission bands overlapping with the phosphorescence spectrum of the phen ligand (λems = 530 nm). Addition of zinc ion as Zn(ClO4)2 (3 equiv) to the ZIrF solution selectively turns on the phen ligand phosphorescence (Figure 2d). Interestingly, TRES of the zinc admixture did not evoke the dfppy phosphorescence. This result suggests that the phosphorescent transition from the phen ligand becomes facile by zinc coordination, lowering the probability for endothermic reverse energy transfer to the dfppy ligands.
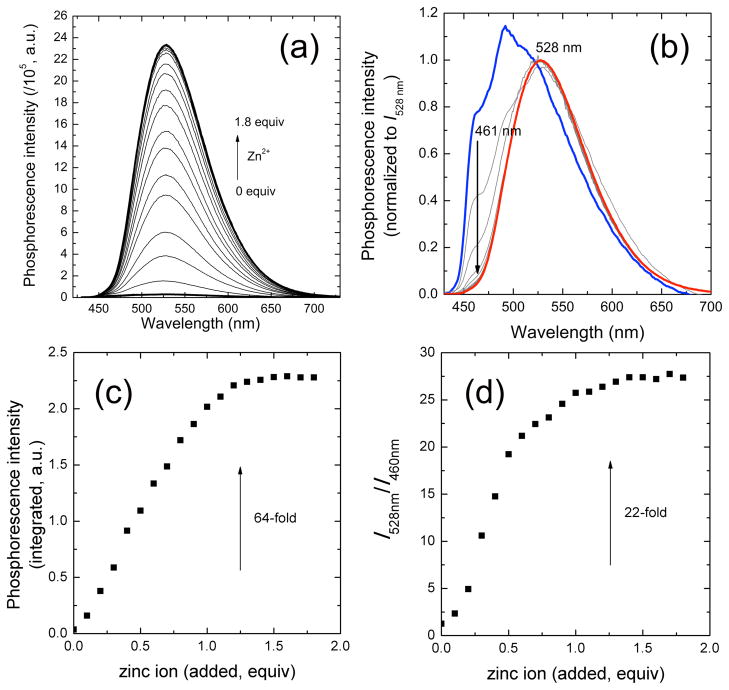
A phosphorescence titration of ZIrF (10 μM) by continuous addition of zinc ion as Zn(ClO4)2 (0 – 1.8 equiv) showed an increase in intensity with a phosphorescence turn-on ratio of 64 (Figures 3a and c). In contrast, IrF did not exhibit a change in phosphorescence when zinc ions were added (SI, Figure S3), revealing that the interaction between DPA and zinc ion is responsible for the phosphorescence turn-on. A binding isotherm plotting phosphorescence intensity as a function of total zinc concentration indicates a 1:1 stoichiometry. Normalization of the phosphorescence intensities at 528 nm reveals a clear ratiometric change in response to zinc binding (Figure 3b). The phosphorescence spectrum of zinc-free ZIrF consists of emission bands from the dfppy (461 nm and 490 nm) and phen (528 nm) ligands. Addition of zinc ion selectively turned on the phosphorescence of phen ligand, affording a 22-fold increase in the phosphorescence intensity ratio of 528 nm vs 460 nm. A binding titration isotherm, plotting the phosphorescence intensity ratio, again returned a 1:1 binding curve (Figure 3d), which is consistent with the titration results based on total phosphorescence intensity (Figure 3c). This ratiometric phosphorescence response changes the emission color from blue to yellow, which generates a shift in the Commission internationale de L’Eclairage chromaticity coordinate from (x,y) = (0.245,0.437) to (0.321,0.582). The phosphorescence quantum yields (Φp) of ZIrF were determined by employing an absolute method (see Experimental Details), returning values for the zinc-free and -bound forms of 2.0% and 58%, respectively. This change in Φp resulted in ca. 30-fold increase in brightness (4449/153). The photoluminescence lifetime of ZIrF measured in Ar-saturated CH3CN solutions experienced a modest increase upon zinc coordination (τobs = 1.2 μs and 1.9 μs for zinc-free and -bound forms, respectively). Radiative (kr) and nonradiative decay (knr) rate constants, calculated by applying relationships kr = Φp/τobs and knr = (1−Φp)/τobs, reveal that zinc coordination effects an increase in radiative rate and a decrease in nonradiative rate. The photophysical parameters for ZIrF and its zinc complex are summarized in Table 2.
Figure 3.
(a) Change in phosphorescence spectrum with increasing total zinc concentration. (b) Spectra shown in (a) are plotted to have same intensities at 528 nm: Blue line, zinc-free; red line, 1.8 equiv of zinc ion. (c) A titration isotherm plotting phosphorescence intensity as a function of amount of added zinc ion (equiv). (d) Change in phosphorescence intensity ratio at 528 nm vs 460 nm with various amount of added zinc ion. Condition: 10 μM ZIrF in air-equilibrated CH3CN, λex = 340 nm.
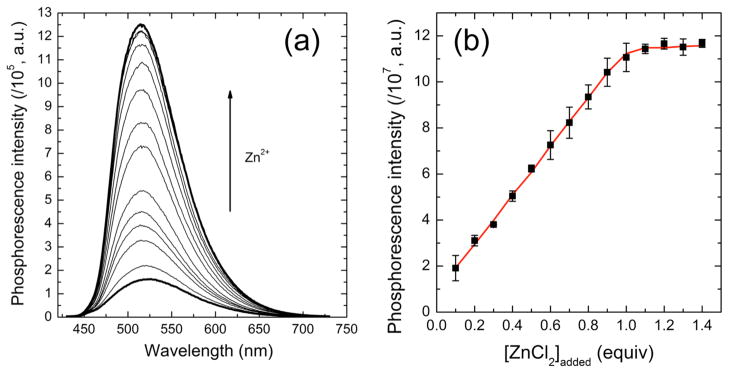
The zinc-sensing ability of ZIrF (10 μM) was further examined in pH 7.0 buffered solutions (25 mM PIPES). The phosphorescence spectrum of a zinc-free form of ZIrF showed a peak at 520 nm and is brighter than that taken in acetonitrile. The Φp determined relative to a fluorescein standard (ΦFl = 0.79,142 0.1 N NaOH) is 5%. Addition of ZnCl2 produced a phosphorescence turn-on with a turn-on ratio of 12 (Figure 4a). The phosphorescence titration isotherm shown in Figure 4b indicates 1:1 binding, which was further confirmed by a Job’s plot (SI, Figure S4). An apparent dissociation constant (Kd) was calculated by applying eq 2, derived from a theoretical 1:1 binding model. Eq 2 was then combined with a quadratic equation simulating the free zinc concentration ([Zn]free) (eq 3). Mathematical derivations for eqs 2 and 3 are provided in Supporting Information. In eq 2, the phosphorescence intensity (P.I.) of ZIrF is corrected by a contribution from protonated species at pH 7.0 (0.00263; vide infra). Iterations by nonlinear least squares fits of eqs 2 and 3 returned Kd = 11 nM.
Figure 4.
(a) Change in phosphorescence spectrum with varying total zinc concentration. (b) Corresponding phosphorescence titration isotherm. The red solid line is a theoretical fit. Refer to text for the theoretical model. Conditions: 10 μM ZIrF in air-equilibrated pH 7.0 buffer (25 mM PIPES), λex = 340 nm.
| (2) |
| (3) |
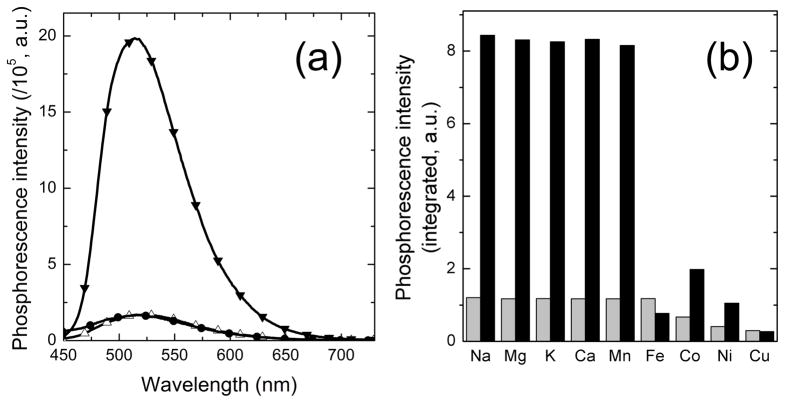
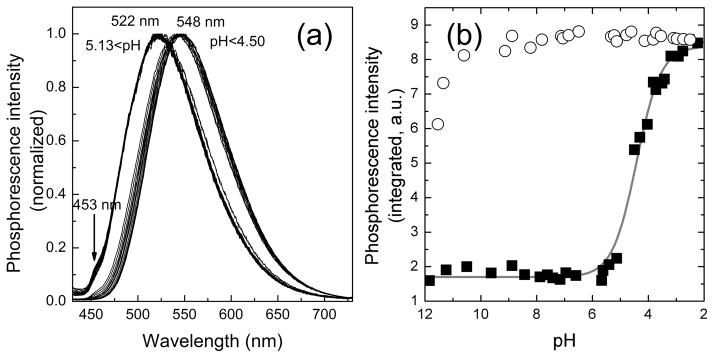
Addition of TPEN (5 equiv) to a ZIrF solution containing ZnCl2 (1 equiv) promptly restored the phosphorescence spectrum to that of the zinc-free form (Figure 5a). In addition, the phosphorescence turn-on response of ZIrF is selective for zinc among the biologically abundant metal ions. Paramagnetic Fe2+, Co2+, Ni2+, and Cu2+ ions bind more strongly than zinc, but they quench the phosphorescence. Na+, Mg2+, K+, Ca2+, and Mn2+ ions did not interfere with the zinc-induced phosphorescence turn-on (Figure 5b). Finally, the effect of protonation on phosphorescence intensity was investigated. As shown in Figure 6a, the phosphorescence spectrum of ZIrF exhibited a phosphorescence ratiometric change between pH 5.13 and 4.50. At pH values ≥ 5.13, ZIrF displayed a 522 nm-centered phosphorescence with a shoulder at 453 nm, a spectral behavior similar that for the zinc-free form in CH3CN. The phosphorescence spectrum shifted bathochromically to 548 nm under more acidic conditions (pH ≤ 4.50) with a concomitant increase in phosphorescence intensity. This proton-induced phosphorescence turn-on is consistent with photoinduced electron transfer (PeT) being responsible for the quenching process that exists in the zinc-free form of ZIrF. The observation that protonation causes a red-shift in the phosphorescence spectrum suggests the presence of an additional mechanism for the phosphorescence modulation other than PeT. A typical sigmoidal curve is observed for the pH titration of the phosphorescence intensity of ZIrF (Figure 6b). A pKa value of 4.42 was calculated by employing eq 1 (Experimental Details), which is well below the typical physiological pH range. In contrast, the zinc-bound form maintained its high phosphorescence intensity in a broad pH range between 10 – 2.5. This result demonstrates that proton-induced phosphorescence turn-on is minimal (0.3 % enhancement at pH 7.0) for ZIrF, a favorable property for targeting a broad range of biological specimens.
Figure 5.
(a) Phosphorescence spectra of ZIrF showing reversible binding with zinc ions. Empty triangles, zinc-free solution; filled inverted triangles, in the presence of zinc ion (1 equiv); filled circles, after subsequent addition of TPEN (5 equiv). (b) Phosphorescent zinc selectivity of ZIrF. Grey bars, in the presence of metal ions; black bars, after subsequent addition of ZnCl2 (1 equiv). Na+, Mg2+, K+, and Ca2+ ions are 100 equiv. Other divalent metal ions are 1 equiv. Chloride salts were used. Conditions: 10 μM ZIrF in air-equilibrated pH 7.0 buffer (25 mM PIPES), λex = 340 nm.
Figure 6.
(a) Change in phosphorescence spectra of ZIrF at decreasing pH from 11.8 to 2.3. (b) pH titration of phosphorescence intensity for zinc-free form (filled squares) and zinc-bound form (4 equiv of ZnCl2; empty circles) of ZIrF. Conditions: 10 μM ZIrF in air-equilibrated milli-Q water containing 100 mM KCl, λex = 340 nm.
Photophysical Mechanism of the Phosphorescence Response
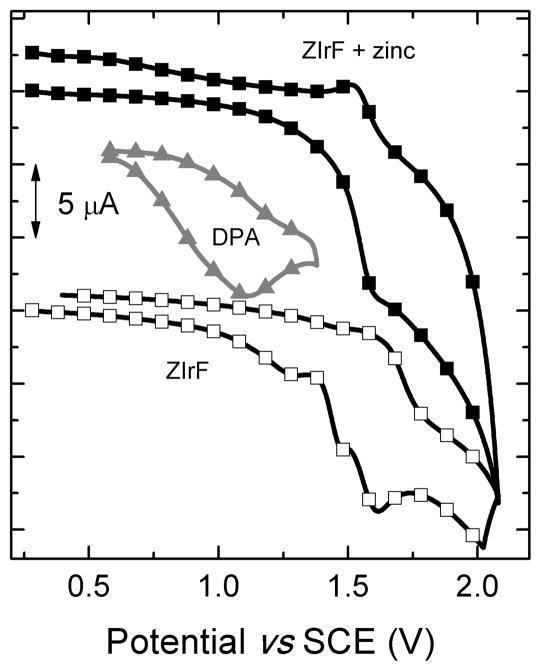
The Ir(IV)/Ir(III) potential occurs at 1.61 V (vs SCE) in ZIrF, as indicated in the cyclic voltammogram, Figure 7. ZIrF also has an irreversible oxidation at 1.28 V (vs SCE), which disappears when zinc ions are introduced into the solution (Figure 7). We assign this feature to oxidation of the DPA moiety by comparison to the oxidation of di(2-picolyl)amine (Figure 7, filled triangles); the potential of this unit will increase significantly upon binding to Zn2+. Insertion of this value (Eox(D+/D) = 1.28 V), the reduction potential of ZIrF (Ered(A/A−) = −1.32 V; SI, Figure S5), excitation energy (ΔE00 = 3.65 eV), and charge separation term value (c = 0.69 eV) into the Rehm-Weller equation returns a positive driving force for PeT (−ΔGPeT = − (Eox(D+/D) − Ered(A/A−)) + ΔE00 + c = 1.74 eV).143,144 The charge separation term (c) was calculated by adopting −e2/4r,145 where r (5.2 Å) was determined by the optimized geometry of ZIrF (Figure 1 and SI, Table S1). Thus, PeT is facile and leads to phosphorescence turn-off for zinc-free form.
Figure 7.
Cyclic voltammogram of ZIrF in the absence (empty squares) or presence (filled squares) of Zn(ClO4)2 (5 equiv). The cyclic voltammogram of di(2-picolyl)amine (DPA) is shown for comparison (filled triangles). Conditions: Scan rate = 100 mV/s; 1 mM in Ar-saturated CH3CN containing Bu4NPF6 (0.1 M) supporting electrolyte; Pt wire counter and working electrodes; and the Ag/AgNO3 couple for the reference electrode.
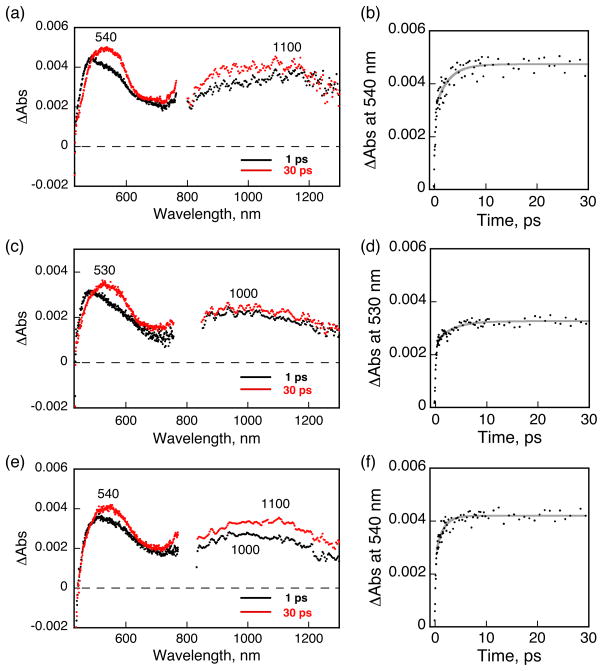
To gain additional insight into the excited-state photophysics involved in the zinc-induced phosphorescence change, we performed femtosecond laser flash photolysis studies of Ar-saturated CH3CN solutions (0.30 mM, λex = 420 nm) of IrF and ZIrF. Transient absorption spectra of the IrF reference compound obtained upon femtosecond laser excitation are shown in Figure 8a. Visible and near infrared (NIR) absorption bands at 540 and 1100 (very weak) nm, respectively, are characteristic of the phenanthroline radical anion.146,147 The solution spectrum of the uncomplexed phenanthroline radical ion has absorptions at 604 and 657 nm,146,147 which in the complex are blue-shifted to the broad single absorption at 540 nm owing to electron-withdrawing influence of the Ir(IV) core. From the time-dependent growth of the 540 nm band (Figure 8b) we compute a time constant of 2.6 ps, which corresponds to the conversion rate of the Franck-Condon 1MLCT state to the thermally equilibrated 3MLCT state.148,149
Figure 8.
Femtosecond transient absorption spectra measured at 1 and 30 ps delay (left panels) and absorption time profiles (right panels) for (a, b) IrF (0.3 mM), (c, d) Zn-free form (0.3 mM), and (e, f) Zn-bound form of ZIrF (0.3 mM, 1 mM zinc ion). Ar-saturated CH3CN solutions were excited at 420 nm.
The transient absorption spectrum of the zinc-free form of ZIrF observed at 30 ps after femtosecond laser excitation in Figure 8c displays a similar absorption band at 530 nm, but the broad NIR band (1000 nm) is clearly blue-shifted as compared to the NIR 3MLCT band (1100 nm) of IrF. This difference may result from a CT state different from that of 3MLCT, because the DPA moiety in ZIrF is easier to be oxidized compared with the Ir(III) metal center judging from the CV results in Figure 7. Moreover, there is virtually no emission from the CT state of ZIrF in contrast to IrF. We therefore tentatively assign the absorption bands at 530 and 1000 nm to intraligand CT transitions from DPA to the phenanthroline moiety (ILphenCT). Upon photoexcitation, the 1MLCT state may also be formed, and the 530 nm absorbance band in Figure 8d having a time constant of 3.3 ps may correspond to electron transfer from the DPA moiety to the phen ligand to produce the ILphenCT state. Although these absorption bands do not decay on the time scale of our femtosecond laser flash photolysis measurements (up to 3 ns), we could not observe any transient absorption in the nanosecond laser flash photolysis measurements (data not shown). Thus, the ILphenCT must decay at sub-microsecond regime with no emission via back electron transfer to the ground state. This behavior may explain the quenching of the phosphorescence emission by the DPA moiety in the zinc-free state.
Addition of zinc ion to ZIrF resulted in an interesting change in the transient absorption spectra, as shown in Figure 8e. Upon photoexcitation, the observed transient absorption spectrum at 1 ps is the same as that in the absence of zinc ion, exhibiting the broad NIR band at 1000 nm. At 30 ps, the NIR band is red-shifted to 1100 nm, as occurs for the reference compound (IrF). This result suggests that the ILphenCT state initially formed is converted to the MLCT state, which becomes energetically more favorable because of the positive shift of the one-electron oxidation potential of the DPA moiety induced by zinc binding (Figure 7). The time profile of the absorbance at 540 nm in Figure 8f affords a time constant of 1.4 ps, corresponding to electron transfer from the Ir(III) core to the zinc-bound phen moiety to produce the emissive MLCT state.
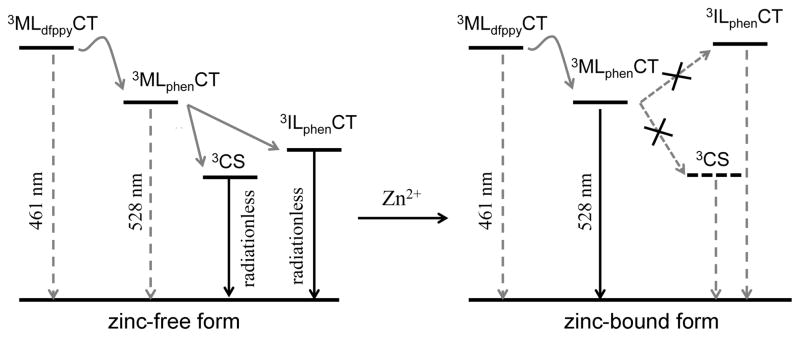
DFT/TD-DFT calculations also suggest that DPA promotes the ILphenCT transition that contributes to the lowest energy triplet state of ZIrF (vide supra). In contrast, the lowest energy triplet state of IrF mainly consists of the MLphenCT transition together with other transitions centered on the phen ligand. The calculations predict that zinc coordination at DPA stabilizes HOMO–5 and HOMO–9 (Figure 1), which subsequently suppresses ILphenCT character. This prediction is in accord with the loss of the ILphenCT character for the zinc-bound form observed in the femtosecond transient absorption spectra (Figure 8e). Taken together, the most reasonable scheme that accounts for our results is depicted in Figure 9. In the absence of zinc ions, excited-state energy equilibrium occurs via a thermal activation barrier between the dfppy (3MLdfppyCT) and the phen (3MLphenCT) ligand states, from which internal conversion corresponding to a nonradiative ILphenCT transition state takes place, yielding weak phosphorescence. Additionally, PeT is facilitated from DPA to Ir(IV), generating a nonemissive charge-separated state (CS). Zinc coordination at DPA suppresses PeT and, at the same time, destabilizes the ILphenCT transition state to restore the emissive MLphenCT state, leading to the phosphorescence turn-on.
Figure 9.
Schematic representation of the mechanism for zinc-induced phosphorescence turn-on of ZIrF (MLdfppyCT, metal-to-dfppy ligand charge-transfer transition state; MLphenCT, metal-to-phen ligand charge-transfer transition state; CS, charge-separated state; ILphenCT, intraligand charge-transfer transition state of phen ligand).
Time-Gated Acquisition of Phosphorescence Response
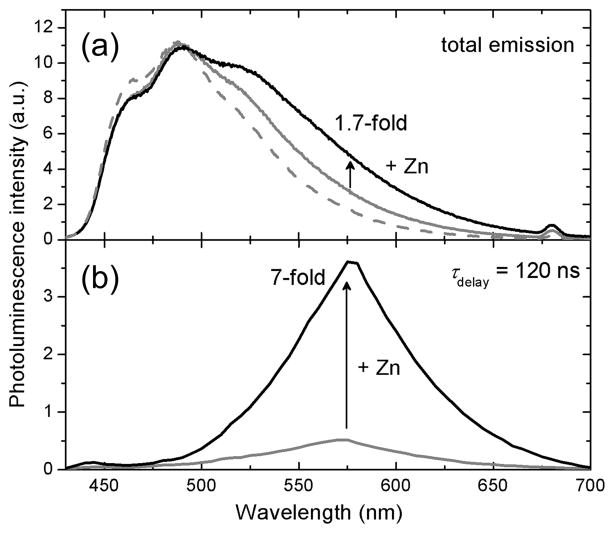
One advantage of using phosphorescence signals is the possibility of performing time-gated acquisition, which allows for decay of background from autofluorescence before acquiring the data of interest. To illustrate this notion, we measured photoluminescence in the presence of 10-methylacridinium (Acr+) ion to simulate typical autofluorescence. Acr+ is the product of 10-methyl-9,10-dihydroacridine oxidation, an NADH analogue. The total photoluminescence spectrum of a PIPES buffered solution (pH 7.0) containing ZIrF (10 μM) and Acr+ (2 μM) is dominated by broad fluorescence at 430 – 650 nm, emanating from Acr+ (Figure 10a). Under these conditions, photoluminescence turn-on by zinc (5 equiv) is very low, only 1.7-fold. In contrast, time-gated acquisition of the spectrum after a 120 ns delay completely removed the Acr+ fluorescence contribution, affording a 7-fold turn-on (Figure 10b). This result highlights the value of time-gated acquisition of phosphorescence signals in improving the signal-to-noise (S/N) ratio for bioimaging applications. A similar improvement in the S/N ratio is attainable by using a zinc sensor such as Zinpyr-147 with visible-excitation (~500 nm) (SI, Figure S6). Such fluorescent sensors that can be excited in the visible or NIR are typically less versatile synthons, however, owing to the requirement of a rigid π-conjugated framework. In addition, there are numerous long wavelength-emitting chromophores in biological samples that potentially deteriorate S/N ratios. The fluorescence spectrum of NADH, for example, spans a broad range, from 400 nm to 600 nm, with strong visible absorption.150–152 Thus, sensors with long-lived photoluminescence are versatile alternatives for improving S/N ratios. We also envision that background emission can be totally removed by lowering the pKa to eliminate proton-induced turn-on signals. Previous work has established the ability to fine-tune the pKa of fluorescent zinc sensors.32–38
Figure 10.
Time-gated acquisition of zinc-induced photoluminescence turn-on of ZIrF. (a) Total photoluminescence spectrum of an air-equilibrated pH 7.0 buffer solution (25 mM PIPES) containing ZIrF (10 μM) and Acr+ (2 μM): Solid grey line, total photoluminescence spectrum; dashed grey line, fluorescence spectrum of Acr+ (2 μM); solid black line, after addition of ZnCl2 (5 equiv). (b) Time-gated photoluminescence spectrum acquired after 120 ns delay: Grey line, zinc-free state; black line, after addition of ZnCl2 (5 equiv). Excitation wavelength was 342 nm.
Intracellular Zinc Imaging
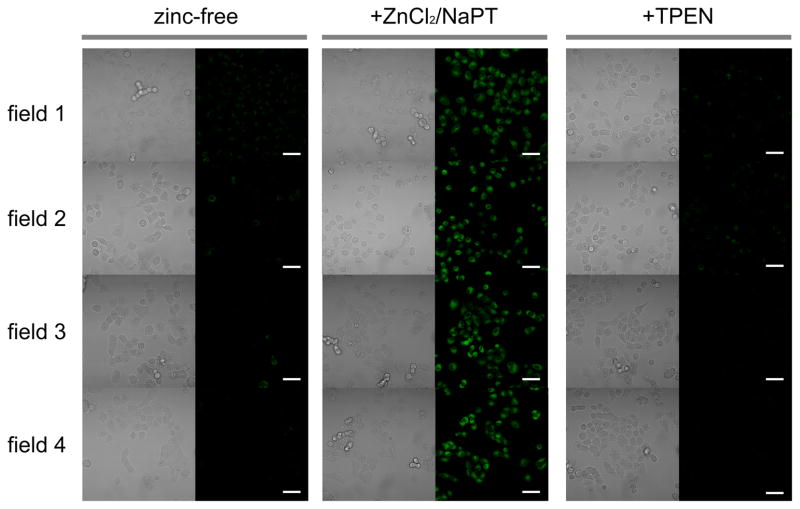
As a more realistic demonstration of the value of ZIrF we imaged mobile zinc in live A549, adenocarcinoma human alveolar basal epithelial cells. Our experiments proved that ZIrF is cell-permeable. As shown in Figure 11, dim background signals can be seen in ZIrF-treated (5 μM, 30 min) A549 cells. Exogenously supplied zinc ions caused the appearance of distinct photoluminescence signals in the cytoplasm. Subsequent incubation with the cell-permeable zinc-specific chelator, TPEN reduced the signal intensity, as expected for a zinc-responsive turn-on probe. Furthermore, the signal intensity did not increase for 60 min unless exogenous zinc ions were not supplied (SI, Figure S7). Photoluminescence turn-on was also observed for fixed cells (SI, Figure S8). Quantification of the photoluminescence intensity of microscope images of the A549 cells revealed an approximately 2-fold enhancement following zinc addition (SI, Figure S8).
Figure 11.
Phosphorescent detection of exogenously supplied intracellular zinc ions in live A549 cells. A549 cells were incubated with ZIrF (5 μM, 30 min; left columns), then with ZnCl2/NaPT (1:1, v/v, 50 μM, 15 min; middle columns), and finally with TPEN (100 μM, 15 min; right columns): Left panels, bright field images; right panels, phosphorescence images. Scale bar corresponds to 50 μm. Identical intensity scale has been applied. Images were acquired from four independent experiments (field 1 – 4).
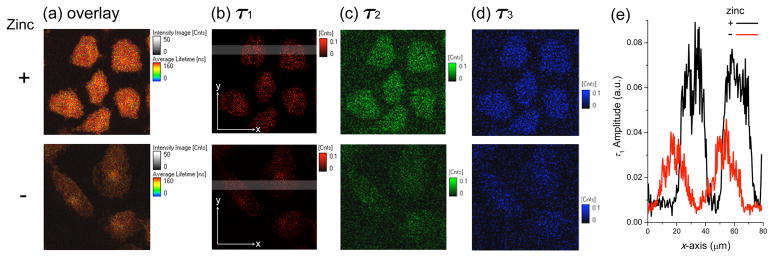
Having established phosphorescent intracellular zinc imaging with ZIrF by confocal laser scanning microscope, photoluminescence lifetime imaging experiments were performed for fixed A549 cells in order to isolate the phosphorescence signal from other contributions to the total photoluminescence (Figure 12). Photoluminescence lifetime images were acquired for an 80 μm × 80 μm sample area consisting of 200 × 200 pixels at an acquisition rate of 2 ms/pixel. A 375 nm ps diode laser was employed for excitation. Images at six different fields were taken for consistency (additional images are supplied in SI, Figure S9). Photoluminescence decay profiles of an entire image were deconvoluted as three exponential processes with short- (0.80 ns), mid- (6.1 ns), and long-lived (140 ns and 160 ns for zinc-free and zinc-supplemented A549 cells, respectively) components (Table 3 and SI, Figure S10). In contrast to the mid- (τ2, green) and short-lived (τ3, blue) components, which are invariant to the presence of zinc ions, the long-lived component (τ1, red) experienced an apparent increase in lifetime, resulting in a corresponding increase in the average photoluminescence lifetime (τavg) (Table 3). The fact that the zinc-induced enhancement affected only τ1 indicates phosphorescence emission. Because the phosphorescence lifetime (τobs) of ZIrF measured in Ar-saturated CH3CN solutions increases slightly (58%) upon interaction with zinc ions (Table 2), the increase in τavg from 120 ns to 130 ns is reasonable. Therefore we can set a threshold of 125 ns for semi-quantitative detection by time-resolved studies. The prominent enrichment in the red colors of the overlay images (Figure 12a) is attributed to zinc-induced enhancement in the long-lived component. Amplitude curves recorded along the x-axis for long-lived component images (Figure 12e) unambiguously confirm the increased signals from the cells. Most importantly, the presence of a substantial amount of zinc-independent fluorescence signals (τ2 and τ3 images) underscores the importance of removing background.
Figure 12.
(a) Fluorescence lifetime microscope images (80 μm × 80 μm) of fixed A549 cells treated with ZIrF (5 μM, 30 min). Cells in the upper panels were incubated with ZnCl2/NaPT (10 μM, 15 min) prior to ZIrF treatment. (a) Overlay of images (b), (c), and (d): (b) Long-lived component (τ1) image; (c) mid-range component (τ2) image; (d) short-lived component (τ3) image. Refer to Table 3 for the values of τ1, τ2, τ3, and their amplitudes. The same intensity scale is applied as for the lifetime images. (e) Amplitude plots of x-scan for grey regions in image (b).
Table 3.
Analysis of the Decay Traces of the Photoluminescence Lifetime Images of ZIrF-Incubated A549 Cells Treated with (+) or without (−) Zinc Ionsa
| Zinc | τavg (ns)b | A1 | τ1 (ns) | A2 | τ2 (ns) | A3 | τ3 (ns) | χ2 |
|---|---|---|---|---|---|---|---|---|
| − | 120 | 93 | 140 | 280 | 6.1 | 580 | 0.80 | 0.97(3) |
| + | 130 | 110 | 160 | 390 | 6.1 | 660 | 0.80 | 0.99(7) |
a triple exponential decay model was applied: A, amplitude; τ, time constant.
.
The photostability of phosphorescence signals from ZIrF was compared with that of the known fluorescent zinc sensor, Zinpyr-1 (ZP1).47 HeLa cells were incubated with ZnCl2/NaPT (50 μM, 30 min), fixed with methanol, and thoroughly rinsed with fresh medium to remove floating cells after fixation. The cells were then treated with either ZIrF or ZP1 (10 μM, 20 min) and the extracellular solution was removed completely before imaging. The photoluminescence images were acquired for the treated cells during continuous exposure to an excitation beam using DAPI (λex = 300 – 400 nm) and fluorescein (λex = 450 – 490 nm) excitation filters for ZIrF and ZP1, respectively. As shown in Figure 13, the photoluminescence intensity of ZP1 significantly diminished over 15 min while that of ZIrF remained high. These results highlight the superior photostability of the Ir(III) complex compared to that of the widely used xanthene-based probe.
Figure 13.
Comparison of photostability of ZIrF and ZP1. HeLa cells were incubated with Zn/NaPT, fixed, and then treated with either ZIrF or ZP1. Photoluminescence microscope images were taken every three min as the cells were illuminated by the excitation beam.
One concern in the application of ZIrF for live cell studies is its moderate cytotoxicity. MTT assays established that IC50 values of ZIrF for A549 (5 h incubation at 37 °C) and HeLa (12 h incubation at 37 °C) cells were 8.6 μM and 0.91 μM, respectively (SI, Figure S11). We additionally observed that prolonged irradiation (≥30 min) of ZIrF-incubated live cells resulted in significant cell death. We postulated that generation of detrimental levels of singlet oxygen (1O2) through collisional triplet-triplet energy transfer from photoexcited ZIrF to molecular oxygen may have produced this harmful effect. Quantum yield for photoinduced singlet oxygen generation (Φ(1O2)) of ZIrF was determined to be 0.92 by employing 1,3-diphenylisobenzofuran (DPBF) and methylene blue as a 1O2-responsive substrate and a standard material (Φ(1O2) = 0.52), respectively (SI, Figure S12).153 This result suggests that ZIrF is a highly efficient photosensitizer for singlet oxygen generation, and reducing Φ(1O2) remains a significant challenge to the future development of phosphorescent zinc sensors.
IV. Summary
We designed and synthesized a phosphorescent sensor (ZIrF) capable of detecting zinc ions in biological samples. The sensor consists of a zinc-binding di(2-picolyl)amine unit and a phosphorescent Ir(III) complex with two blue-phosphorescent 2-(2,4-difluorophenyl)pyridine ligands and a yellow-phosphorescent 1,10-phenanthroline ligand. As a result, the sensor exhibits dual emission in the blue (461 nm) and yellow (528 nm) regions in its zinc-free state while zinc addition invokes selective turn-on of the yellow phosphorescence. DFT/TD-DFT calculations, electrochemical measurements, and steady-state and transient spectroscopic investigations including femtosecond laser flash photolysis established that a combined effect of PeT modulation and perturbation of the lowest triplet states (i.e., MLCT vs ILCT) is responsible for the zinc-induced phosphorescence change. The sensor displayed a 12-fold phosphorescence turn-on at pH 7.0 in response to zinc ions. A Job’s plot and a titration isotherm plotting phosphorescence intensity vs zinc concentration established a 1:1 binding stoichiometry with Kd = 11 nM. The pKa of the sensor was determined to be as low as 4.16, well below the physiological range. ZIrF exhibits excellent reversibility and phosphorescence selectivity for zinc. We were able to isolate the zinc-responsive phosphorescence signals from total photoluminescence contaminated by simulated fluorescence noise from 10-methylacridinium ion. Finally, the phosphorescent zinc detection ability of ZIrF was applied to live cell imaging using A549 cells. Confocal laser scanning microscope techniques were used to visualize phosphorescence turn-on in response to intracellular zinc ions. Fluorescence lifetime imaging (FLIM) experiments detected an increase in photoluminescence lifetime for the zinc-treated fixed A549 cells, which allowed for selection of long-lived phosphorescence images. To the best of our knowledge, ZIrF is the first phosphorescent sensor that has been successfully applied for imaging zinc ions in biological samples. Although potential 1O2 generation in the presence of the probe may be responsible for moderate cytotoxicity, we believe that the present results provide a valuable beginning to the development of phosphorescent sensors for mobile zinc bioimaging applications.
Supplementary Material
Acknowledgments
This work was supported by a grant from the National Institute of General Medical Sciences (Grant GM065519 to SJL). Spectroscopic instrumentation at the MIT DCIF is maintained with funding from NIH Grant 1S10RR13886-01. The research at EWU was supported by NRF/MEST of Korea through the CRI, GRL (2010-00353), WCU (R31-2008-000-10010-0), and the Converging Research Center Program (2010K001391). YY acknowledges RP-Grant 2010 of Ewha Womans University for financial support, Prof. Soo Young Park at Seoul National University for use of a TCSPC system, and Prof. Daniela Buccella at New York University for helpful comments and suggestions. The research at Osaka University was supported by Grants-in-Aid (Nos. 20108010 and 23750014) and a Global COE program, “the Global Education and Research Center for Bio-Environmental Chemistry” from the Japan Society of Promotion of Science (JSPS).
Footnotes
Supporting Information Available. Complete author list for reference 123; synthesis; experimental details for femtosecond laser flash photolysis and determination of singlet oxygen generation quantum yield; mathematical derivations for eqs 3 and 4; Figures S1 – S12, displaying the solution UV-vis and solvatochromic behaviors, phosphorescent zinc response of IrF, a Job’s plot, cyclic voltammogram, fluorescence spectra of buffer solutions containing ZP1 and Acr+, more confocal laser scanning micrographs and FLIM images, analysis of the FLIM data, MTT assay results for A549 and HeLa cells treated with ZIrF, and determination of the singlet oxygen generation quantum yield; and Table S1 and S2, summarizing metric parameters for the calculated structures of ZIrF and IrF, and analysis of the FLIM results. This material is available free of charge via the Internet at http://pubs.acs.org.
References
- 1.Burdette SC, Lippard SJ. Coord Chem Rev. 2001;216–217:333–361. [Google Scholar]
- 2.Palmer AE, Franz KJ. Chem Rev. 2009;109:4533–4535. doi: 10.1021/cr900293t. [DOI] [PubMed] [Google Scholar]
- 3.Que EL, Domaille DW, Chang CJ. Chem Rev. 2008;108:1517–1549. doi: 10.1021/cr078203u. [DOI] [PubMed] [Google Scholar]
- 4.da Silva JJRF, Williams RJP. The Biological Chemistry of Elements: The Inorganic Chemistry of Life. 2. Oxford UP; New York: 2001. [Google Scholar]
- 5.Frederickson CJ. Int Rev Neurobiol. 1989;31:145–238. doi: 10.1016/s0074-7742(08)60279-2. [DOI] [PubMed] [Google Scholar]
- 6.Frederickson CJ, Koh J-Y, Bush AI. Nat Rev Neurosci. 2005;6:449–462. doi: 10.1038/nrn1671. [DOI] [PubMed] [Google Scholar]
- 7.Takeda A. Biometals. 2001;14:343–351. doi: 10.1023/a:1012982123386. [DOI] [PubMed] [Google Scholar]
- 8.Canani Berni R, Buccigrossi V, Passariello A. Curr Opin Gastroen. 2011;27:8–12. doi: 10.1097/MOG.0b013e32833fd48a. [DOI] [PubMed] [Google Scholar]
- 9.Taylor CG. Biometals. 2005;18:305–312. doi: 10.1007/s10534-005-3686-x. [DOI] [PubMed] [Google Scholar]
- 10.Wills NK, Ramanujam VMS, Kalariya N, Lewis JR, van Kuijk FJGM. Exp Eye Res. 2008;87:80–88. doi: 10.1016/j.exer.2008.04.013. [DOI] [PubMed] [Google Scholar]
- 11.Costello LC, Franklin RB. Mol Cancer. 2006;5:17. doi: 10.1186/1476-4598-5-17. [DOI] [PMC free article] [PubMed] [Google Scholar]
- 12.Jo SM, Won MH, Cole TB, Jensen MS, Palmiter RD, Danscher G. Brain Res. 2000;865:227–236. doi: 10.1016/s0006-8993(00)02227-7. [DOI] [PubMed] [Google Scholar]
- 13.Yamaguchi S, Miura C, Kikuchi K, Celino FT, Agusa T, Tanabe S, Miura T. Proc Natl Acad Sci USA. 2009;106:10859–10864. doi: 10.1073/pnas.0900602106. [DOI] [PMC free article] [PubMed] [Google Scholar]
- 14.Li Y, Hough CJ, Frederickson CJ, Sarvey JM. J Neurosci. 2001;21:8015–8025. doi: 10.1523/JNEUROSCI.21-20-08015.2001. [DOI] [PMC free article] [PubMed] [Google Scholar]
- 15.Li Y, Hough CJ, Suh SW, Sarvey JM, Frederickson CJ. J Neurophysiol. 2001;86:2597–2604. doi: 10.1152/jn.2001.86.5.2597. [DOI] [PubMed] [Google Scholar]
- 16.Fraker PJ, King LE. Annu Rev Nutr. 2004;24:277–298. doi: 10.1146/annurev.nutr.24.012003.132454. [DOI] [PubMed] [Google Scholar]
- 17.Bush AI, Pettingell WH, Multhaup G, Paradis Md, Vonsattel J-P, Gusella JF, Beyreuther K, Masters CL, Tanzi RE. Science. 1994;265:1464–1467. doi: 10.1126/science.8073293. [DOI] [PubMed] [Google Scholar]
- 18.Lee J-Y, Cole TB, Palmiter RD, Suh SW, Koh J-Y. Proc Natl Acad Sci USA. 2002;99:7705–7710. doi: 10.1073/pnas.092034699. [DOI] [PMC free article] [PubMed] [Google Scholar]
- 19.Suh SW, Jensen KB, Jensen MS, Silva DS, Kesslak PJ, Danscher G, Frederickson CJ. Brain Res. 2000;852:274–278. doi: 10.1016/s0006-8993(99)02096-x. [DOI] [PubMed] [Google Scholar]
- 20.Choi DW, Koh JY. Annu Rev Neurosci. 1998;21:347–375. doi: 10.1146/annurev.neuro.21.1.347. [DOI] [PubMed] [Google Scholar]
- 21.Weiss JH, Sensi SL, Koh JY. Trends Pharmacol Sci. 2000;21:395–401. doi: 10.1016/s0165-6147(00)01541-8. [DOI] [PubMed] [Google Scholar]
- 22.Koh J-Y, Suh SW, Gwag BJ, He YY, Hsu CY, Choi DW. Science. 1996;272:1013–1016. doi: 10.1126/science.272.5264.1013. [DOI] [PubMed] [Google Scholar]
- 23.Walker CF, Black RE. Annu Rev Nutr. 2004;24:255–275. doi: 10.1146/annurev.nutr.23.011702.073054. [DOI] [PubMed] [Google Scholar]
- 24.McRae R, Bagchi P, Sumalekshmy S, Fahrni CJ. Chem Rev. 2009;109:4780–4827. doi: 10.1021/cr900223a. [DOI] [PMC free article] [PubMed] [Google Scholar]
- 25.Kimura E, Koike T. Chem Soc Rev. 1998;27:179–184. [Google Scholar]
- 26.Lim NC, Freake HC, Brueckner C. Chem Eur J. 2005;11:38–49. doi: 10.1002/chem.200400599. [DOI] [PubMed] [Google Scholar]
- 27.Jiang P, Guo Z. Coord Chem Rev. 2004;248:205–229. [Google Scholar]
- 28.Linert W, Jameson GNL, Jameson RF, Jellinger KA. Met Ions Life Sci. 2006;1:281–320. [Google Scholar]
- 29.Tomat E, Lippard SJ. Curr Opin Chem Biol. 2010;14:225–230. doi: 10.1016/j.cbpa.2009.12.010. [DOI] [PMC free article] [PubMed] [Google Scholar]
- 30.Nolan EM, Lippard SJ. Acc Chem Res. 2009;42:193–203. doi: 10.1021/ar8001409. [DOI] [PMC free article] [PubMed] [Google Scholar]
- 31.Frederickson CJ, Kasarskis EJ, Ringo D, Frederickson RE. J Neurosci Methods. 1987;20:91–103. doi: 10.1016/0165-0270(87)90042-2. [DOI] [PubMed] [Google Scholar]
- 32.Chang CJ, Nolan EM, Jaworski J, Burdette SC, Sheng M, Lippard SJ. Chem Biol. 2004;11:203–210. doi: 10.1016/j.chembiol.2004.01.017. [DOI] [PubMed] [Google Scholar]
- 33.Chang CJ, Nolan EM, Jaworski J, Okamoto K, Hayashi Y, Sheng M, Lippard SJ. Inorg Chem. 2004;43:6774–6779. doi: 10.1021/ic049293d. [DOI] [PubMed] [Google Scholar]
- 34.Nolan EM, Burdette SC, Harvey JH, Hilderbrand SA, Lippard SJ. Inorg Chem. 2004;43:2624–2635. doi: 10.1021/ic035158+. [DOI] [PubMed] [Google Scholar]
- 35.Burdette SC, Frederickson CJ, Bu W, Lippard SJ. J Am Chem Soc. 2003;125:1778–1787. doi: 10.1021/ja0287377. [DOI] [PubMed] [Google Scholar]
- 36.Sun W-C, Gee KR, Klaubert DH, Haugland RP. J Org Chem. 1997;62:6469–6475. [Google Scholar]
- 37.Leonhardt H, Gordon L, Livingston R. J Phys Chem. 1971;75:245–249. [Google Scholar]
- 38.Hirano T, Kikuchi K, Urano Y, Nagano T. J Am Chem Soc. 2002;124:6555–6562. doi: 10.1021/ja025567p. [DOI] [PubMed] [Google Scholar]
- 39.Komatsu K, Kikuchi K, Kojima H, Urano Y, Nagano T. J Am Chem Soc. 2005;127:10197–10204. doi: 10.1021/ja050301e. [DOI] [PubMed] [Google Scholar]
- 40.Nolan EM, Ryu JW, Jaworski J, Feazell RP, Sheng M, Lippard SJ. J Am Chem Soc. 2006;128:15517–15528. doi: 10.1021/ja065759a. [DOI] [PMC free article] [PubMed] [Google Scholar]
- 41.Goldsmith CR, Lippard SJ. Inorg Chem. 2006;45:555–561. doi: 10.1021/ic051113s. [DOI] [PubMed] [Google Scholar]
- 42.Nolan EM, Jaworski J, Racine ME, Sheng M, Lippard SJ. Inorg Chem. 2006;45:9748–9757. doi: 10.1021/ic061137e. [DOI] [PMC free article] [PubMed] [Google Scholar]
- 43.Nolan EM, Lippard SJ. Inorg Chem. 2004;43:8310–8317. doi: 10.1021/ic048778z. [DOI] [PubMed] [Google Scholar]
- 44.Xu Z, Yoon J, Spring DR. Chem Soc Rev. 2010;39:1996–2006. doi: 10.1039/b916287a. [DOI] [PubMed] [Google Scholar]
- 45.Hirano T, Kikuchi K, Urano Y, Higuchi T, Nagano T. J Am Chem Soc. 2000;122:12399–12400. [Google Scholar]
- 46.Walkup GK, Burdette SC, Lippard SJ, Tsien RY. J Am Chem Soc. 2000;122:5644–5645. doi: 10.1021/ja010059l. [DOI] [PubMed] [Google Scholar]
- 47.Burdette SC, Walkup GK, Spingler B, Tsien RY, Lippard SJ. J Am Chem Soc. 2001;123:7831–7841. doi: 10.1021/ja010059l. [DOI] [PubMed] [Google Scholar]
- 48.Burdette SC, Lippard SJ. Inorg Chem. 2002;41:6816–6823. doi: 10.1021/ic026048q. [DOI] [PubMed] [Google Scholar]
- 49.Gee KR, Zhou Z-L, Ton-That D, Sensi SL, Weiss JH. Cell Calcium. 2002;31:245–251. doi: 10.1016/S0143-4160(02)00053-2. [DOI] [PubMed] [Google Scholar]
- 50.Qian W-J, Gee KR, Kennedy RT. Anal Chem. 2003;75:3468–3475. doi: 10.1021/ac0341057. [DOI] [PubMed] [Google Scholar]
- 51.Sensi SL, Ton-That D, Sullivan PG, Jonas EA, Gee KR, Kaczmarek LK, Weiss JH. Proc Natl Acad Sci USA. 2003;100:6157–6162. doi: 10.1073/pnas.1031598100. [DOI] [PMC free article] [PubMed] [Google Scholar]
- 52.Sensi SL, Ton-That D, Weiss JH, Rothe A, Gee KR. Cell Calcium. 2003;34:281–284. doi: 10.1016/s0143-4160(03)00122-2. [DOI] [PubMed] [Google Scholar]
- 53.Zhang X-a, Hayes D, Smith SJ, Friedle S, Lippard SJ. J Am Chem Soc. 2008;130:15788–15789. doi: 10.1021/ja807156b. [DOI] [PMC free article] [PubMed] [Google Scholar]
- 54.Wong BA, Friedle S, Lippard SJ. Inorg Chem. 2009;48:7009–7011. doi: 10.1021/ic900990w. [DOI] [PMC free article] [PubMed] [Google Scholar]
- 55.Woodroofe CC, Masalha R, Barnes KR, Frederickson CJ, Lippard SJ. Chem Biol. 2004;11:1659–1666. doi: 10.1016/j.chembiol.2004.09.013. [DOI] [PubMed] [Google Scholar]
- 56.Komatsu K, Urano Y, Kojima H, Nagano T. J Am Chem Soc. 2007;129:13447–13454. doi: 10.1021/ja072432g. [DOI] [PubMed] [Google Scholar]
- 57.Mizukami S, Okada S, Kimura S, Kikuchi K. Inorg Chem. 2009;48:7630–7638. doi: 10.1021/ic900247r. [DOI] [PubMed] [Google Scholar]
- 58.Dhara K, Karan S, Ratha J, Roy P, Chandra G, Manassero M, Mallik B, Banerjee P. Chem Asian J. 2007;2:1091–1100. doi: 10.1002/asia.200700152. [DOI] [PubMed] [Google Scholar]
- 59.Liu Y, Zhang N, Chen Y, Wang L-H. Org Lett. 2007;9:315–318. doi: 10.1021/ol062816w. [DOI] [PubMed] [Google Scholar]
- 60.Zhang Y, Guo X, Si W, Jia L, Qian X. Org Lett. 2008;10:473–476. doi: 10.1021/ol702869w. [DOI] [PubMed] [Google Scholar]
- 61.Liu Z, Zhang C, Li Y, Wu Z, Qian F, Yang X, He W, Gao X, Guo Z. Org Lett. 2009;11:795–798. doi: 10.1021/ol802537c. [DOI] [PubMed] [Google Scholar]
- 62.Mikata Y, Yamashita A, Kawamura A, Konno H, Miyamoto Y, Tamotsu S. Dalton Trans. 2009:3800–3806. doi: 10.1039/b820763a. [DOI] [PubMed] [Google Scholar]
- 63.Tamanini E, Katewa A, Sedger LM, Todd MH, Watkinson M. Inorg Chem. 2009;48:319–324. doi: 10.1021/ic8017634. [DOI] [PubMed] [Google Scholar]
- 64.Jiang W, Fu Q, Fan H, Wang W. Chem Commun. 2008:259–261. doi: 10.1039/b712377a. [DOI] [PubMed] [Google Scholar]
- 65.Qian F, Zhang C, Zhang Y, He W, Gao X, Hu P, Guo Z. J Am Chem Soc. 2009;131:1460–1468. doi: 10.1021/ja806489y. [DOI] [PubMed] [Google Scholar]
- 66.Xu Z, Kim G-H, Han SJ, Jou MJ, Lee C, Shin I, Yoon J. Tetrahedron. 2009;65:2307–2312. [Google Scholar]
- 67.Aoki S, Kaido S, Fujioka H, Kimura E. Inorg Chem. 2003;42:1023–1030. doi: 10.1021/ic020545p. [DOI] [PubMed] [Google Scholar]
- 68.Gee KR, Zhou Z-L, Qian W-J, Kennedy R. J Am Chem Soc. 2002;124:776–778. doi: 10.1021/ja011774y. [DOI] [PubMed] [Google Scholar]
- 69.Huston ME, Haider KW, Czarnik AW. J Am Chem Soc. 1988;110:4460–4462. [Google Scholar]
- 70.Koike T, Watanabe T, Aoki S, Kimura E, Shiro M. J Am Chem Soc. 1996;118:12696–12703. [Google Scholar]
- 71.Nolan EM, Jaworski J, Okamoto K, Hayashi Y, Sheng M, Lippard SJ. J Am Chem Soc. 2005;127:16812–16823. doi: 10.1021/ja052184t. [DOI] [PMC free article] [PubMed] [Google Scholar]
- 72.Wang H-H, Gan Q, Wang X-J, Xue L, Liu S-H, Jiang H. Org Lett. 2007;9:4995–4998. doi: 10.1021/ol702192m. [DOI] [PubMed] [Google Scholar]
- 73.Wu Y, Peng X, Guo B, Fan J, Zhang Z, Wang J, Cui A, Gao Y. Org Biomol Chem. 2005;3:1387–1392. doi: 10.1039/b501795e. [DOI] [PubMed] [Google Scholar]
- 74.Zalewski PD, Millard SH, Forbes IJ, Kapaniris O, Slavotinek A, Betts WH, Ward AD, Lincoln SF, Mahadevan I. J Histochem Cytochem. 1994;42:877–884. doi: 10.1177/42.7.8014471. [DOI] [PubMed] [Google Scholar]
- 75.Aoki S, Sakurama K, Matsuo N, Yamada Y, Takasawa R, Tanuma S-i, Shiro M, Takeda K, Kimura E. Chem Eur J. 2006;12:9066–9080. doi: 10.1002/chem.200600379. [DOI] [PubMed] [Google Scholar]
- 76.Hirano T, Kikichi K, Urano Y, Higuchi T, Nagano T. Angew Chem Int Ed. 2000;39:1052–1054. doi: 10.1002/(sici)1521-3773(20000317)39:6<1052::aid-anie1052>3.0.co;2-5. [DOI] [PubMed] [Google Scholar]
- 77.Park MS, Swamy KMK, Lee YJ, Lee HN, Jang YJ, Moon YH, Yoon J. Tetrahedron Lett. 2006;47:8129–8132. [Google Scholar]
- 78.Gunnlaugsson T, Lee TC, Parkesh R. Org Biomol Chem. 2003;1:3265–3267. doi: 10.1039/b309569j. [DOI] [PubMed] [Google Scholar]
- 79.Huang S, Clark RJ, Zhu L. Org Lett. 2007;9:4999–5002. doi: 10.1021/ol702208y. [DOI] [PubMed] [Google Scholar]
- 80.Wu J-S, Liu W-M, Zhuang X-Q, Wang F, Wang P-F, Tao S-L, Zhang X-H, Wu S-K, Lee S-T. Org Lett. 2007;9:33–36. doi: 10.1021/ol062518z. [DOI] [PubMed] [Google Scholar]
- 81.Zapata F, Caballero A, Espinosa A, Tarraga A, Molina P. Org Lett. 2007;9:2385–2388. doi: 10.1021/ol070828r. [DOI] [PubMed] [Google Scholar]
- 82.Zhou Y, Kim HN, Yoon J. Bioorg Med Chem Lett. 2010;20:125–128. doi: 10.1016/j.bmcl.2009.11.028. [DOI] [PubMed] [Google Scholar]
- 83.Li H-y, Gao S, Xi Z. Inorg Chem Commun. 2009;12:300–303. [Google Scholar]
- 84.Dessingou J, Joseph R, Rao CP. Tetrahedron Lett. 2005;46:7967–7971. [Google Scholar]
- 85.Dennis AE, Smith RC. Chem Commun. 2007:4641–4643. doi: 10.1039/b710740d. [DOI] [PubMed] [Google Scholar]
- 86.Sclafani JA, Maranto MT, Sisk TM, Van Arman SA. Tetrahedron Lett. 1996;37:2193–2196. [Google Scholar]
- 87.Dineley KE, Malaiyandi LM, Reynolds IJ. Mol Pharmacol. 2002;62:618–627. doi: 10.1124/mol.62.3.618. [DOI] [PubMed] [Google Scholar]
- 88.Fahrni CJ, Henary MM, VanDerveer DG. J Phys Chem A. 2002;106:7655–7663. [Google Scholar]
- 89.Henary MM, Fahrni CJ. J Phys Chem A. 2002;106:5210–5220. [Google Scholar]
- 90.Maruyama S, Kikuchi K, Hirano T, Urano Y, Nagano T. J Am Chem Soc. 2002;124:10650–10651. doi: 10.1021/ja026442n. [DOI] [PubMed] [Google Scholar]
- 91.Woodroofe CC, Lippard SJ. J Am Chem Soc. 2003;125:11458–11459. doi: 10.1021/ja0364930. [DOI] [PubMed] [Google Scholar]
- 92.Chang CJ, Jaworski J, Nolan EM, Sheng M, Lippard SJ. Proc Natl Acad Sci USA. 2004;101:1129–1134. doi: 10.1073/pnas.0308079100. [DOI] [PMC free article] [PubMed] [Google Scholar]
- 93.Taki M, Wolford JL, O’Halloran TV. J Am Chem Soc. 2004;126:712–713. doi: 10.1021/ja039073j. [DOI] [PubMed] [Google Scholar]
- 94.Ajayaghosh A, Carol P, Sreejith S. J Am Chem Soc. 2005;127:14962–14963. doi: 10.1021/ja054149s. [DOI] [PubMed] [Google Scholar]
- 95.Wang J, Xiao Y, Zhang Z, Qian X, Yang Y, Xu Q. J Mater Chem. 2005;15:2836–2839. [Google Scholar]
- 96.Woodroofe CC, Won AC, Lippard SJ. Inorg Chem. 2005;44:3112–3120. doi: 10.1021/ic048789s. [DOI] [PubMed] [Google Scholar]
- 97.Kiyose K, Kojima H, Urano Y, Nagano T. J Am Chem Soc. 2006;128:6548–6549. doi: 10.1021/ja060399c. [DOI] [PubMed] [Google Scholar]
- 98.Qiao W, Mooney M, Bird AJ, Winge DR, Eide DJ. Proc Natl Acad Sci USA. 2006;103:8674–8679. doi: 10.1073/pnas.0600928103. [DOI] [PMC free article] [PubMed] [Google Scholar]
- 99.Tang B, Huang H, Xu K, Tong L, Yang G, Liu X, An L. Chem Commun. 2006:3609–3611. doi: 10.1039/b606809j. [DOI] [PubMed] [Google Scholar]
- 100.van Dongen EMWM, Dekkers LM, Spijker K, Meijer EW, Klomp LWJ, Merkx M. J Am Chem Soc. 2006;128:10754–10762. doi: 10.1021/ja0610030. [DOI] [PubMed] [Google Scholar]
- 101.Vinkenborg JL, Nicolson TJ, Bellomo EA, Koay MS, Rutter GA, Merkx M. Nat Methods. 2006;6:737–740. doi: 10.1038/nmeth.1368. [DOI] [PMC free article] [PubMed] [Google Scholar]
- 102.Wu Z, Zhang Y, Ma JS, Yang G. Inorg Chem. 2006;45:3140–3142. doi: 10.1021/ic051589b. [DOI] [PubMed] [Google Scholar]
- 103.Xu Z, Qian X, Cui J, Zhang R. Tetrahedron. 2006;62:10117–10122. [Google Scholar]
- 104.Lu C, Xu Z, Cui J, Zhang R, Qian X. J Org Chem. 2007;72:3554–3557. doi: 10.1021/jo070033y. [DOI] [PubMed] [Google Scholar]
- 105.Atilgan S, Ozdemir T, Akkaya EU. Org Lett. 2008;10:4065–4067. doi: 10.1021/ol801554t. [DOI] [PubMed] [Google Scholar]
- 106.Roussakis E, Voutsadaki S, Pinakoulaki E, Sideris DP, Tokatlidis K, Katerinopoulos HE. Cell Calcium. 2008;44:270–275. doi: 10.1016/j.ceca.2007.12.008. [DOI] [PubMed] [Google Scholar]
- 107.Zhang L, Clark RJ, Zhu L. Chem Eur J. 2008;14:2894–2903. doi: 10.1002/chem.200701419. [DOI] [PubMed] [Google Scholar]
- 108.Zhang Y, Guo X, Si W, Jia L, Qian X. Org Lett. 2008;10:473–476. doi: 10.1021/ol702869w. [DOI] [PubMed] [Google Scholar]
- 109.Ballesteros-Garrido R, Abarca B, Ballesteros R, Ramirez de Arellano C, Leroux FR, Colobert F, Garcia-Espana E. New J Chem. 2009;33:2102–2106. [Google Scholar]
- 110.Xu Z, Baek K-H, Kim HN, Cui J, Qian X, Spring DR, Shin I, Yoon J. J Am Chem Soc. 2010;132:601–610. doi: 10.1021/ja907334j. [DOI] [PubMed] [Google Scholar]
- 111.Zhang X-a, Lovejoy KS, Jasanoff A, Lippard SJ. Proc Natl Acad Sci USA. 2007;104:10780–10785. doi: 10.1073/pnas.0702393104. [DOI] [PMC free article] [PubMed] [Google Scholar]
- 112.Kiyose K, Kojima H, Urano Y, Nagano T. J Am Chem Soc. 2006;128:6548–6549. doi: 10.1021/ja060399c. [DOI] [PubMed] [Google Scholar]
- 113.Highly Efficient OLEDs with Phosphorescent Materials. Wiley-VCH; Weinheim, Germany: 2008. [DOI] [PubMed] [Google Scholar]
- 114.Chou P-T, Chi Y. Chem Eur J. 2007;13:380–395. doi: 10.1002/chem.200601272. [DOI] [PubMed] [Google Scholar]
- 115.Zhao Q, Li F, Huang C. Chem Soc Rev. 2010;39:3007–3030. doi: 10.1039/b915340c. and and references therein. [DOI] [PubMed] [Google Scholar]
- 116.Barigelletti F, Flamigni L, Calogero G, Hammarstrom L, Sauvage J-P, Collin J-P. Chem Commun. 1998:2333–2334. [Google Scholar]
- 117.Siu PKM, Lai S-W, Lu W, Zhu N, Che C-M. Eur J Inorg Chem. 2003:2749–2752. [Google Scholar]
- 118.Araya JC, Gajardo J, Moya SA, Aguirre P, Toupet L, Williams JAG, Escadeillas M, Le Bozec H, Guerchais V. New J Chem. 2010;34:21–24. [Google Scholar]
- 119.Lee P-K, Law WH-T, Liu H-W, Lo KK-W. Inorg Chem. 2011;50:8570–8579. doi: 10.1021/ic201153d. [DOI] [PubMed] [Google Scholar]
- 120.Fukuzumi S, Tokuda Y, Kitano T, Okamoto T, Otera J. J Am Chem Soc. 1993;115:8960–8968. [Google Scholar]
- 121.Nolan EM, Lippard SJ. J Am Chem Soc. 2003;125:14270–14271. doi: 10.1021/ja037995g. [DOI] [PubMed] [Google Scholar]
- 122.You Y, Tomat E, Hwang K, Atanasijevic T, Nam W, Jasanoff AP, Lippard SJ. Chem Commun. 2010;46:4139–4141. doi: 10.1039/c0cc00179a. [DOI] [PMC free article] [PubMed] [Google Scholar]
- 123.Frisch MJ, et al. Gaussian 03 Revision. D.01. Gaussian, Inc; Wallingford CT: 2004. [Google Scholar]
- 124.Becke AD. J Phys Chem. 1988;88:2547–2553. [Google Scholar]
- 125.Becke AD. J Phys Chem. 1993;98:5648–5652. [Google Scholar]
- 126.Becke AD. Phys Rev A. 1988;38:3098–3100. doi: 10.1103/physreva.38.3098. [DOI] [PubMed] [Google Scholar]
- 127.Hay PJ, Wadt WR. J Chem Phys. 1985;82:299–310. [Google Scholar]
- 128.Cheng Y-M, Li EY, Lee G-H, Chou P-T, Lin S-Y, Shu C-F, Hwang K-C, Chen Y-L, Song Y-H, Chi Y. Inorg Chem. 2007;46:10276–10286. doi: 10.1021/ic7015269. [DOI] [PubMed] [Google Scholar]
- 129.Tamayo AB, Alleyne BD, Djurovich PI, Lamansky S, Tsyba I, Ho NN, Bau R, Thompson ME. J Am Chem Soc. 2003;125:7377–7387. doi: 10.1021/ja034537z. [DOI] [PubMed] [Google Scholar]
- 130.Nonoyama M. Bull Chem Soc Jpn. 1974;47:767–768. [Google Scholar]
- 131.Li J, Djurovich PI, Alleyne BD, Yousufuddin M, Ho NN, Thomas JC, Peters JC, Bau R, Thompson ME. Inorg Chem. 2005;44:1713–1727. doi: 10.1021/ic048599h. [DOI] [PubMed] [Google Scholar]
- 132.You Y, Park SY. J Am Chem Soc. 2005;127:12438–12439. doi: 10.1021/ja052880t. [DOI] [PubMed] [Google Scholar]
- 133.Duan H-S, Chou P-T, Hsu C-C, Hung J-Y, Chi Y. Inorg Chem. 2009;48:6501–6508. doi: 10.1021/ic9003164. [DOI] [PubMed] [Google Scholar]
- 134.You Y, Seo J, Kim SH, Kim KS, Ahn TK, Kim D, Park SY. Inorg Chem. 2008;47:1476–1487. doi: 10.1021/ic701778f. [DOI] [PubMed] [Google Scholar]
- 135.You Y, Kim KS, Ahn TK, Kim D, Park SY. J Phys Chem C. 2007;111:4052–4060. [Google Scholar]
- 136.Holmes RJ, Forrest SR, Tung Y-J, Kwong RC, Brown JJ, Garon S, Thompson ME. Appl Phys Lett. 2003;82:2422–2424. [Google Scholar]
- 137.Lee JR, Liou YR, Huang WL. Inorg Chim Acta. 2001;319:83–89. [Google Scholar]
- 138.King KA, Watts RJ. J Am Chem Soc. 1987;109:1589–1590. [Google Scholar]
- 139.Ohsawa Y, Sprouse S, King KA, DeArmond MK, Hanck KW, Watts RJ. J Phys Chem. 1987;91:1047–1054. [Google Scholar]
- 140.Von Lippert E. Z Electrochem. 1957;61:962–975. [Google Scholar]
- 141.Mataga N, Kaifu Y, Koizumi M. Bull Chem Soc Jpn. 1956;29:465–470. [Google Scholar]
- 142.Umberger JQ, LaMer VK. J Am Chem Soc. 1945;67:1099–1109. [Google Scholar]
- 143.Miura T, Urano Y, Tanaka K, Nagano T, Ohkubo K, Fukuzumi S. J Am Chem Soc. 2003;125:8666–8671. doi: 10.1021/ja035282s. [DOI] [PubMed] [Google Scholar]
- 144.Kennedy DP, Kormos CM, Burdette SC. J Am Chem Soc. 2009;131:8578–8586. doi: 10.1021/ja901653u. [DOI] [PubMed] [Google Scholar]
- 145.Suppan P. J Chem Soc, Faraday Trans 1. 1986;82:509–511. [Google Scholar]
- 146.Kato T, Shida T. J Am Chem Soc. 1979;101:6869–6879. [Google Scholar]
- 147.Turró C, Chung YC, Leventis N, Kuchenmeister ME, Wagner PJ, Leroi GE. Inorg Chem. 1996;35:5104–5106. doi: 10.1021/ic9601091. [DOI] [PubMed] [Google Scholar]
- 148.Iwamura M, Takeuchi S, Tahara T. J Am Chem Soc. 2007;129:5248–5256. doi: 10.1021/ja069300s. [DOI] [PubMed] [Google Scholar]
- 149.Shaw GB, Grant CD, Shirota H, Castner EW, Jr, Meyer GJ, Chen LX. J Am Chem Soc. 2007;129:2147–2160. doi: 10.1021/ja067271f. [DOI] [PubMed] [Google Scholar]
- 150.Pogue BW, Pitts JD, Mycek M-A, Sloboda RD, Wilmot CM, Brandsema JF, O’Hara JA. Photochem Photobiol. 2011;74:817–824. doi: 10.1562/0031-8655(2001)074<0817:ivnfma>2.0.co;2. [DOI] [PubMed] [Google Scholar]
- 151.Lakowicz JR, Szmacinski H, Nowaczyk K, Johnson ML. Proc Natl Acad Sci USA. 1993;89:1271–1275. doi: 10.1073/pnas.89.4.1271. [DOI] [PMC free article] [PubMed] [Google Scholar]
- 152.Rover L, Jr, Fernandes JCB, De Oliveira Neto G, Kubota LT, Katekawa E, Serrano SHP. Anal Biochem. 1998;260:50–55. doi: 10.1006/abio.1998.2656. [DOI] [PubMed] [Google Scholar]
- 153.Adarsh N, Avirah RR, Ramaiah D. Org Lett. 2010;12:5720–5723. doi: 10.1021/ol102562k. [DOI] [PubMed] [Google Scholar]
Associated Data
This section collects any data citations, data availability statements, or supplementary materials included in this article.


