Abstract
Previously, we have shown that wild type N-ras (wt N-ras) harbors an anti-malignant effect against mutated Ras and in tumors without Ras mutations. To investigate the molecular bases of this anti-malignant activity, we have studied the potency of this anti-malignant effect in a model system against SV40 large T antigen (SV40T). We show that wild-type N-ras (wt N-ras) counteracts the effects of SV40T in NIH3T3 cells as seen by a decrease in proliferation, anchorage independence and changes in migration. We also show that wt N-ras elicits the same anti-malignant effects in some human tumor cell lines (HT1080 and MDA-MB-231). Through mRNA and microRNA (miRNAs) expression profiling we have identified genes (decorin) and miRNAs (mir-29A, let-7b) modulated by wt N-ras potentially responsible for the anti-malignant effect. Wt N-ras appears to mediate its anti-malignant effect by downregulating some of the targets of the TGFβ pathway and decorin, which are able to reverse the inhibition of migration induced by wt N-ras. Our experiments show that the molecules that mediate the anti-malignant effect by wt N-ras appear to be different from those modulated by transforming N-ras. The components of the pathways modulated by wt N-ras mediating its anti-malignant effects are potential targets for therapeutic intervention in cancer.
Keywords: Signal transduction pathways, Guanine nucleotide binding proteins and effectors, Ras, anti-malignant effects, migration
INTRODUCTION
Ras proteins are critical components of signaling pathways that link the activation of cell surface receptors with transcriptional events leading to the control of proliferation, differentiation and apoptosis (Bos, 1997; Malumbres and Pellicer, 1998). Ras genes have been extensively studied because they are mutated in approximately 30% of all human cancers. They are considered to be dominant at the cellular level, unlike the tumor suppressor genes (TSGs), which in most instances require the inactivation of both alleles in the host cell to allow the transformed phenotype to develop. We observed early on that wild type Ras genes were frequently deleted in mouse tumors induced by carcinogens and γ-radiation (Corominas et al., 1991; Diamond et al., 1988; Guerrero et al., 1985; Newcomb et al., 1988) suggesting that the normal alleles might be somehow impeding tumor development and therefore being selected out in the course of tumor growth. These observations remained untested in a mechanistic experimental design until it was shown that normal K-ras and N-ras alleles were displaying a protective effect in tumor formation in mouse knockout models (Diaz et al., 2002; Zhang et al., 2001). These experiments indicated that normal Ras alleles, in our case wt N-ras, were able to at least partially counteract the malignant effects of its mutated counterpart. We proceeded to investigate if wt N-ras was able to have an anti-malignant effect in other contexts. To investigate this point we induced tumors with methylcholanthrene (MCA) in wt and KO N-ras mice (Diaz et al., 2004). The N-ras KO mice developed more tumors, but more importantly the cell lines established from the N-ras KO tumors presented more malignant features than those established from wt mice tumors. To demonstrate that these phenotypic differences were due to the absence of wt N-ras alleles, we transfected the tumor cell lines from N-ras KO mice with wt N-ras (Diaz et al., 2002). These experiments indeed showed that the introduction of wt N-ras in the N-ras KO tumor cells modified their phenotype to a less malignant one, similar to the one displayed by the tumor cells derived from wt mice. These tumor cell lines lacked any mutated Ras alleles, therefore these experiments indicated that wt N-ras had an anti-malignant effect even in situations in which the malignancy was driven by other oncogenes and/or TSGs. Since the molecular underpinnings of these MCA induced tumors were unknown, we decided to study the anti-malignant effects of wt N-ras in a controlled model system in which NIH3T3 cells have been transformed by the potent SV40 T antigen oncogene, as well as in several human tumor cell lines.
The experimental system described in this report provides an approach to uncover signal transduction pathways activated by wt N-ras that could eventually be used to block malignant routes stimulated by oncogenes. This requires investigating the cellular and molecular underpinnings of the oncogenic transformation and the molecules used by wt N-ras to block them. Ras is known to have many effectors and among them there is a family of genes, known as RASSF, that is sometimes deleted in tumors (Vos and Clark, 2006). These genes apparently induce apoptosis and, therefore, can slow or block the development of tumors. Other pathways that have frequently been implicated in modulating the malignant phenotype are the pathways activated by TGFβ. These TGFβ-activated pathways have been implicated in a number of functions, some of which are apparently contradictory (Massague, 2008; Roberts and Wakefield, 2003), including tumor suppression, one of the earliest studied functions of TGFβ and, more recently, in promoting metastasis (Welm, 2008) and in the epithelial-mesenchymal transformation (EMT) (Zavadil and Bottinger, 2005; Zavadil et al., 2007). Given the interaction between Ras and TGFβ-activated pathways, we have analyzed the involvement of TGFβ in the wt N-ras induced anti-malignant effect. We thought it would be important to determine if wt N-ras is able to reverse some properties of the oncogenic transformation, including cell proliferation, migration, and invasion. We also sought to investigate the pathways utilized to block these malignant features.
It should be obvious that if we uncover the pathways utilized by a normal gene (wt N-ras) to block different aspects of the oncogenic transformation, these pathways would be prime targets to design strategies in the fight against cancer.
MATERIALS and METHODS
Cell culture
NIH-3T3 cell lines were maintained in Dubelcco’s modified Eagle medium (DMEM; Gibco Life Technologies) supplemented with 10% calf serum, penicillin G (50 U/ml), streptomycin (50 mg/ml) (Gemini Bio-Products, West Sacramento, CA) and 0.5 mg/ml fungizone), and incubated in standard conditions of humidity (95%), CO2 atmosphere (5%) and temperature (37° C). Human breast cancer cell line MDA-MB-231 and fibrosarcoma cell line HT1080 were maintained in DMEM and α-MEM respectively (Gibco Life Technologies), supplemented with 10% fetal bovine serum, penicillin and fungizone.
Plasmids, transfection and infection assays
The plasmid expressing the large T antigen of SV40 was a gift from K. Rundell (University of Michigan). The human cDNA of wild type N-ras (wt N-ras or N-rasN) or oncogenic N-ras containing a codon 61 point mutation (N-rasT) were cloned on a pCDNA3(+)/Zeo plasmid (Invitrogen, California, CA) and on the retroviral vector MSCV-GFP (pMIGR1). The constitutively active TGF-β type I receptor pCMV5–TβRI–T204D, was a gift from J. Massague. The transfection assays were carried out using Lipofectamine 2000 (Invitrogen, California, CA) or Effectene (Qiagen, Valencia, CA) according to the manufacturer’s protocol. One of the clones was transfected with pcDNA3-N-ras or pcDNA3-N-rasT and cells were selected after addition of 400 mg/ml Zeocin (Invitrogen, California, CA) and grown for 14 days. For infection assays, NIH-3T3, SV5-NN4, HT1080 and MDA-MB-231 cells were infected with retroviral supernatant in the presence of 8 μg/mL polybrene (Sigma) for 12h and the assays were made 72h after infection.
Soft agar assay
Agar colony assays were performed as described (Cartwright et al., 1987). Briefly, 3×10⁴ cells were suspended in 1 ml of DMEM supplemented with 10% FBS and 0.33% Bacto-Agar (Difco Laboratories, Detroit, MI). The cell suspension was added to chilled, 60-mm diameter plates containing a 7 ml base of DMEM supplemented with 10% FBS and 0.5% agar. After the agar had solidified, plates were returned to a 37 °C incubator. Cultures were fed twice a week and colonies were counted fourteen days later.
Growth in Low serum
Growth in low serum was performed as described (Diaz et al., 2002) in 60-mm plates. Cells (103) were plated and grown in 10% or 1% calf serum DMEM. The number of cells was determined every 3 days using a hemocytometer over a two-week period. Each experiment was performed in duplicate.
MTT assay
SV5 and SV5-NN4 cells were seeded onto 96-well plates at 1 × 10⁴ cells/well in 100 μl complete medium. Next day cells were incubated with 10% or 1% calf serum. After 1 day of incubation, MTT [3-(4,5-dimethylthiazol-2-yl)-2,5-diphenyltetrazolium bromide] stock solution was added to each well at a final concentration of 0.5 mg/ml and incubated at 37°C for 4 h. The precipitate was then solubilized by addition of 100 μl of dymethylsulfate (DMSO) and shaked for 10 minutes to obtain the final product of MTT metabolism, formazan precipitate. The proliferation rate was determined measuring the optical density at 550 nm using a microplate reader, followed by blank subtraction. The data are expressed as the means ± SD of the percentage of SV5-NN4 respect to SV5 cells (n = 3).
Wound Healing
The wound-healing assay was carried out according to previous studies (Lee et al., 2001). Briefly, cells were seeded on 6-well tissue culture plates. When the cells reached 90% confluence, they were scraped with a pipette tip from the center of each well and marked at the injury line. Photomicrographs of the wounds were taken at 0, 24 and 40 hours. The percentage of uncovered wound was measured using ImagenJ software (http://www.le.ac.uk/biochem/microscopy/wound-healing-assay.html).
Migration/Invasion Assay
BD Biocoat chambers (BD Biosciences Discovery Labware, Bedford, MA) with 8-μm pore size polystyrene filter inserts covered with matrigel were used according to the manufacturer’s instructions. Briefly, cells (5 × 10⁴) in 400 μl of DMEM with 10% FBS were seeded onto the upper compartment of each chamber and placed into wells containing 600 μl of complete medium in the lower chamber. Cells were allowed to adhere, and then the medium in the upper chamber was replaced with complete medium. The migration chambers were incubated for 24 hours at 37°C. After incubation, the inserts were washed to remove the cells from the top, fixed and stained and the number of migrating/invading cells was counted (Zagzag et al., 2008).
Cell cycle distribution
The cell cycle distribution was determined by staining DNA with propidium iodide (PI; Sigma, St Louis, MO) as previously described (Park et al., 2003). In brief, cells were washed in PBS and fixed in 70% ethanol. Cells were again washed with PBS and then incubated with PI (50 μg/ml) with simultaneous treatment of 0.1 mg/ml RNase A (Sigma, St Louis, MO) at 37°C for 30 min. The percentage of cells in the different phases of the cell cycle was measured with a FACScan flow cytometer (Becton Dickinson, San Jose, CA) and analyzed using ModFit LT software (Becton Dickinson, San Jose, CA).
Luciferase assay
For the luciferase assays 200 ng of 3TPLux, a TGFβ-inducible reporter plasmid, was used to transfect SV5-NN4 stably expressing the construct TGFΒRI-T240D. Transient transfections were performed by lipofection with Effectene (Qiagen, California, USA) following the manufacturer’s recommendations. Cells were plated onto 24-well plates to reach confluence the following day for transfection. Twenty-four hours after transfection 100 μM of human recombinant TGF-β1 (Roche, Basel, Switzerland) was added. Forty-eight hours after transfection, cells were collected and the luciferase assay performed in accordance with the manufacturer’s recommendations (Dual-Luciferase Reporter Assay System, Promega Corporation, Madison, WI).
Immunoblotting
Proteins were extracted, separated by electrophoresis through 15% or 10% SDS-PAGE gels (Bio-Rad, Richmond, CA) and transferred to PVDF membranes (Millipore) and reacted with antibodies as previously described (Hernandez-Munoz et al., 2003). The primary antibodies used in this study were mouse anti-N-ras (F155) and mouse anti-SV40 T Ag (Santa Cruz Biotechnology, Santa Cruz, CA). The immunoblots were developed with a horseradish peroxidase-conjugated secondary antibody (Amersham, Buckinghamshire, U.K.) followed by chemiluminescence (Pierce’s SuperSignal West Pico Maximum Sensitivity Substrate).
Microarray experiments and data analysis
Total RNA (8 μg) from triplicates of exponentially growing NIH3T3 cell lines stably expressing the SV40 large T antigen (SV5) and from cells expressing both, the large T antigen and wt-N-ras (SV5-NN4), was collected using the Trizol method (Invitrogen, California, CA). To isolate small RNAs (microRNAs) we used a modified Trizol protocol, where RNA is precipitated overnight with isopropanol and linear acrylamide (Ambion, Foster City, CA). The quantity and quality of the RNAs was determined using a NanoDrop ND-1000 UV spectrophotometer (Thermo Scientific, Waltham, MA) and an Agilent 2100 Bioanalyzer (Agilent Technologies, Palo Alto, CA). Biotinylated cRNA was processed for hybridization of total RNA on Mouse Genome 430A 2.0 arrays (Affymetrix, Santa Clara, CA) or microRNA on the miRVANA 350 microRNA array, following manufacturer’s recommendations. Normalization, filtering and analysis of the raw data, was performed using GeneSpring microarray analysis software (Agilent Technologies, Palo Alto, CA). The statistically significant differences in gene expression between SV5 and SV5-NN4 NIH3T3 transfectants were identified by T-test (p<0.05). The raw Affymetrix array data were deposited at the NCBI Gene Expression Database (GEO) under the accession ID GSE28678.
Real Time PCR
Total RNA was isolated using Trizol. To generate cDNA, 1 μg of total RNA was retrotranscribed using the iScript cDNA synthesis kit according to the manufacturer’s protocol. Diluted cDNA (2 μl) was amplified using the MyiQ real-time PCR detection system (Biorad, Richmond, CA) and iQ SYBR Green Supermix (Biorad, Richmond, CA). We usedβ-actin as an internal normalization control. The conditions of QRT-PCR were as previously described (Perez de Castro et al., 2005). The sequences of the PCR primers (5′ to 3′) Forward and Reverse are described in Supplementary Table 1.
Statistical analysis
Statistical differences between group parameters were determined using a Student t test and Prism software (GraphPad Software, Inc., San Diego, CA). P < 0.05 was considered the minimum level of statistical significance. Data are expressed as mean ± S.D.
RESULTS
Wild type N-ras inhibits the oncogenic transformation induced by SV40 large T Antigen (SV40T)
wt N-ras is able to reduce anchorage-independent growth of transformed cells
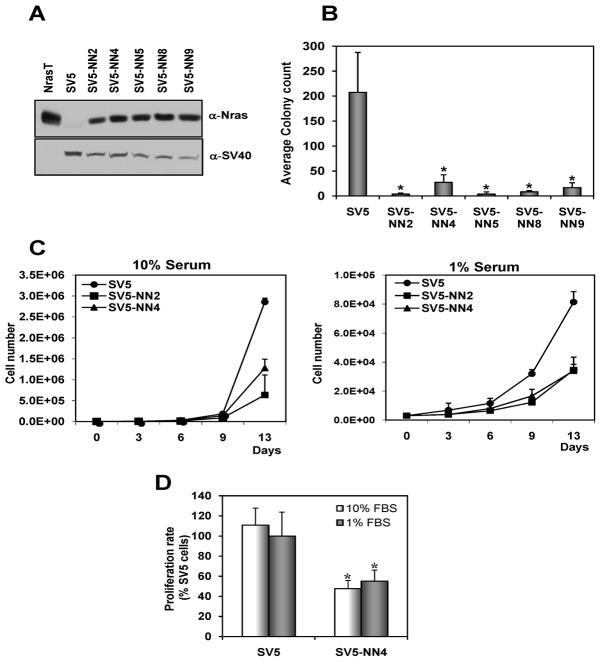
The ability of cancer cells to form colonies in soft agar is a measure of their ability to proliferate in anchorage-independent conditions. Anchorage-independent growth is thought to enable the cells to invade and metastasize, characteristics that distinguish malignant from normal cells. We first established NIH-3T3 clones expressing SV40 large T antigen (SV5 cells), which form colonies in soft agar. These clones were then transfected with the N-ras proto-oncogene (wt N-ras), which produced stable clones (SV5-NN clones). We analyzed 8 clones and 5 of them (SV5-NN2, SV5-NN4, SV5-NN5, SV5-NN8 and SV5-NN9) expressed wt N-ras and SV40T (Figure 1A). These clones express levels of the exogenous wt N-ras at similar levels as normal thymus or testes. SV5 cells and SV5-NN clones were compared for their ability to form colonies on a semi-solid medium. The results (Figure 1B) show that the N-ras proto-oncogene reduces, in a statistically significant manner (p<0.05), the number of colonies in the soft agar assay. This effect is observed in multiple established clones proving it is not simply due to a rare accident produced by transfection.
Fig. 1. Overexpression of the N-ras proto-oncogene reduces the oncogenic transformation in SV40 transformed cells.
A, NIH3T3 SV40 transformed cells (SV5) and cells expressing both SV40T and wt N-ras (SV5-NN clones) were immunobloted with antibodies against N-ras and SV40. As positive control, NIH3T3 cells transformed with the N-ras oncogene (NrasT) were used. B, Introduction of the N-ras proto-oncogene in SV40 transformed cells significantly reduces anchorage independence). * p<0.05. C, N-ras proto-oncogene (wt N-ras) reduces proliferation in SV40 transformed cells. SV5 and SV5-NN cells (clones 2 and 4) were seeded on day 0 and counted every three days over two weeks while growing in 10% or 1% serum. D, Indirect determination of cell proliferation rate by colorimetric assessment of MTT to formazan conversion. SV5 and SV5-NN4 cells were plated at 1 × 10⁴ cells per well of 96-well plate, and optical density (OD) was measured at 550 nm using a plate reader. Data are expressed as means ± SD (n = 3). * p<0.05.
Wild type N-ras inhibits the rate of proliferation of SV5 cells under both normal (10%) serum and reduced (1%) serum conditions
Cancer cells have the ability to grow in low serum due to their lack of dependence on growth factors. To ascertain if the N-ras proto-oncogene is also able to reduce proliferation in 3T3 cells transformed by SV40, we studied the growth rate in SV40 transformed cells (SV5) and in cells expressing both SV40T and wt N-ras (SV5-NN clones). We show that SV5 transformed cells grow at a much faster rate than the SV5-NN clones and that only SV5 cells can proliferate under low serum conditions (Figure 1C). Furthermore, colorimetric measurement of MTT to formazan conversion showed the inhibitory rate of proliferation activitydue to wt-Nras (Figure 1D).
Wt N-ras reduces the migration ability of SV40 transformed cells and results in their accumulation in G2/M phase
The wound-healing migration assay is an established and widely used test that allows an examination of cell migration in response to an artificial wound produced on a cell monolayer (Lee et al., 2001). We have shown that wt N-ras is able to reduce the rate of growth in cells transformed with SV40T. Our next goal was to show that wt N-ras was also able to inhibit the ability of SV5 cells to migrate as tumor cells. We obtained several stable clones of SV5-NN cells. Since they all behaved in the same way, we chose SV5-NN4 for a more thorough analysis. At 24 hours after wound generation, SV5 cells have essentially closed the wound. In contrast, at the same time, the wound in SV5-NN4 cells (a clone of wt N-ras transfected SV5 cells used throughout this study) is still open (Figure 2A). We used ImageJ software to quantify the percentage of cells closing the wound. SV5 cells had only 10% of uncovered wound, however in NN4 cells the uncovered wound was 40% (Figure 2B). This effect cannot be attributed to the faster growth of SV5 cells, since Figure 1C shows very little difference in proliferation by the time in which the wound-healing assay is terminated (24 or 40h). There are also numerous literature reports showing increased migration without significant contribution from proliferation (De Donatis et al., 2008; Gao et al., 2005; Shizukuda et al., 1999). In addition to examining the growth properties elicited by wt N-ras, we studied its impact on cell cycle progression. The population of cells in the G2/M phase was significantly increased in SV5-NN4 cells compared to SV5 cells (Figure 2C).
Fig. 2. The proto-oncogene N-ras reduces migration of SV40 transformed cells and produces cell cycle arrest at the G2/M phase.
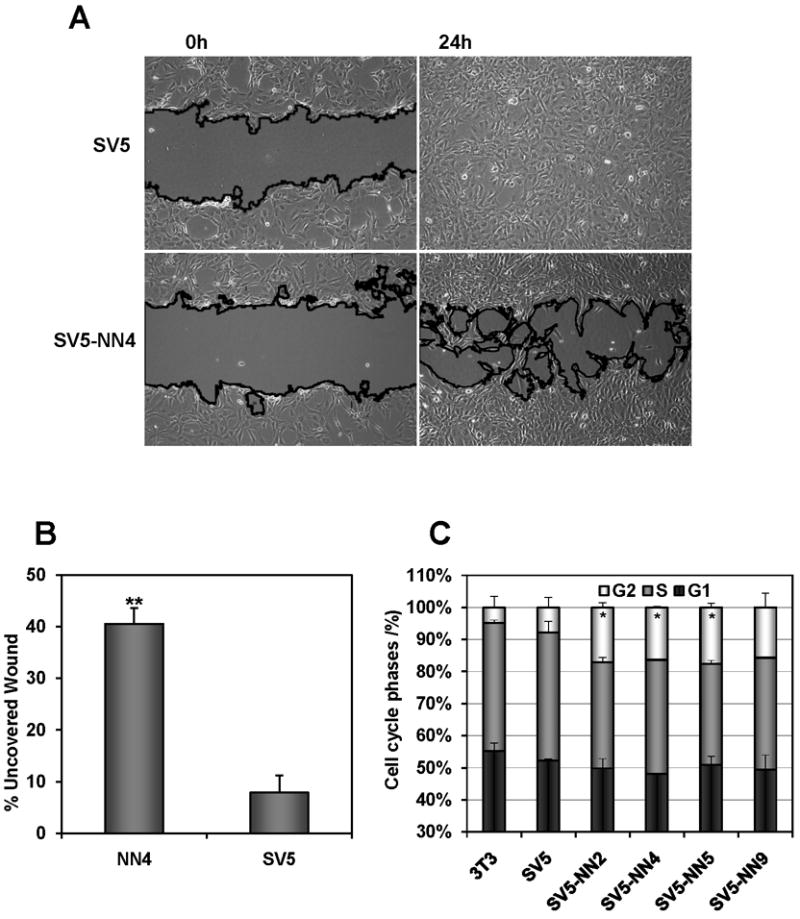
A, SV5 and SV5-N-rasN cells were seeded near confluence to perform the wound-healing assay. Pictures were taken at time 0 and 24 hours after the wound was made. B, Percentage of uncovered wound of three independent experiments, where the width of the wound is measured at 24 hours along the scratch wound. ** p<0.01. C, DNA content in the different phases of the cell cycle was measured in SV5 and SV5-N-rasN clones in exponentially growing cells using propidium iodide and FACS analysis. * p<0.05.
wt N-ras also inhibited the malignant properties of certain human tumor cell lines
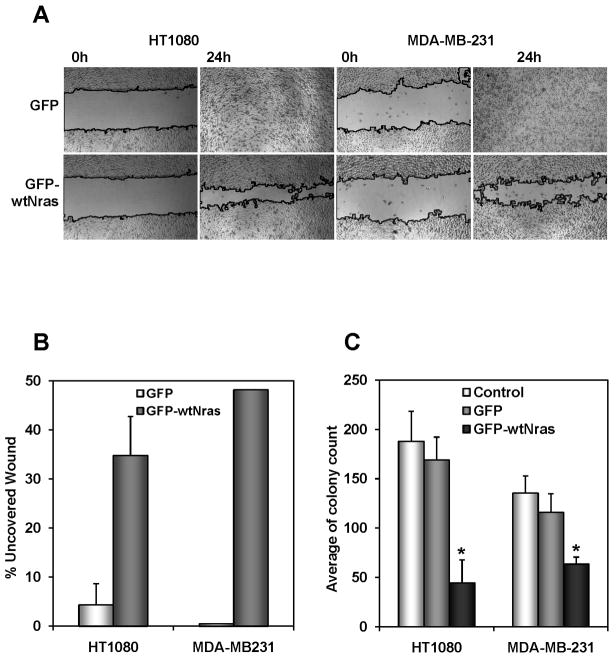
To confirm that these anti-malignant effects observed in our model system were relevant in human cancer, we proceeded to introduce the wt N-ras gene by retroviral transduction into a panel of human tumor cell lines. We chose HT1080 (fibrosarcoma), MDA-MB-231 (breast), PC3 (prostate) and ES2 (ovary). Two of the tumor cell lines, HT1080 and MDA-MB-231 responded similarly to the SV5-NN cells with a decrease in their migration, as measured by the wound healing assay (Fig 3A and B) and a decrease in their anchorage independence (Fig 3C). These results confirm that the anti-malignant effect elicited by wt N-ras is relevant in a human cancer setting and validates the use of the SV5/SV5-NN4 model system to study the molecular pathways mediating these anti-malignant effects. A system which is cleaner with a limited set of molecular alterations. It is important to note here that HT1080 and MDA-MB-231 contain Ras mutations, but none of the SV-NN clones used in this study contain Ras mutations indicating that wt-N-ras is able to counteract the oncogenic transformation phenotype on mutant Ras-containing cells, as well as tumor cell lines containing wild type Ras genes.
Fig. 3. N-ras proto-oncogene decreases oncogenic transformation in human tumor cell lines.
A, Introduction of the N-ras proto-oncogene in HT1080 and MDA-MB-231 cells significantly reduces its migration ability. Both cell lines infected with pMIGR1 (GFP) or pMIGR1-wt N-ras (GFP-wt N-ras) were seeded and the pictures were taken at time 0 and 24 hours after the wound was made. B, Quantification of migration by measuring the distance between the invading fronts of cells in three random selected microscopic fields for each condition. The degree of migration is expressed as percent of uncovered wound. C, N-ras proto-oncogene reduces human tumor cell growth on a soft agar assay. HT1080 and MDA-MB-231 cells non infected (Control) or infected with pMIGR1 and pMIGR1-wt N-ras (GFP-wtNras) were seeded on day 0 and the number of colonies was counted two weeks later. Data represent mean of three independent experiments. * p<0.05.
Molecular mediators of the anti-malignant effect of wt N-ras
mRNA expression profile of cells expressing wt N-ras
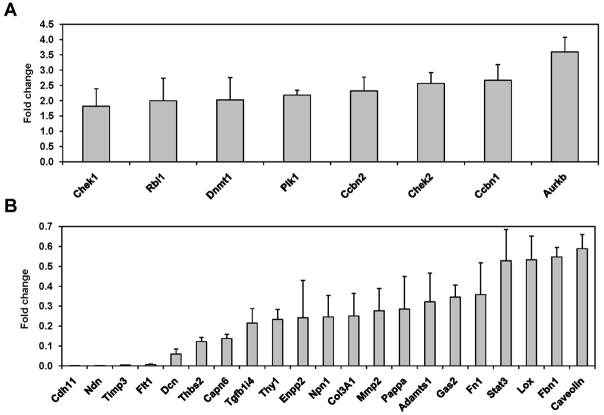
Having shown that wt N-ras is able to counteract the malignant properties of the SV40T oncogene, we next wanted to identify the molecular pathways that wt N-ras utilizes to produce this effect. To elucidate this, we studied the gene expression profile of SV5 and SV5-NN4 cells using RNA expression display. In total, we found, in triplicate experiments, 259 down-regulated genes and 150 up-regulated genes, more than 2 fold (T-test, p<0.05). We then selected some of the up- and down-regulated genes based on two criteria: 1) the extent of modulation by wt N-ras and 2) their implication on pathways that play important roles in the oncogenic transformation, including cell cycle, invasion, proliferation, etc (Table 1). In order to confirm the results obtained by the microarray, we performed quantitative RT-PCR for the selected genes and we were able to confirm that the genes identified indeed were up-(Fig. 4A) or downregulated (Fig. 4B) at the RNA level. The expression levels of some of these genes were also measured in other SV-NN clones and the results were consistent with those in SV5-NN4. Additionally, our analysis of the expression of RASSF1, 2, 3, 4, 5 and 6 in the SV5-NN4 cells by microarray and independently by QRT-PCR does not show any difference in their levels of expression with respect to their parental SV5 cells (data not shown). We thus conclude that these genes are not the effectors wt N-ras uses to mediate the anti-malignant effect.
Table 1.
List of selected genes up or down-regulated by wt N-ras and fold change of their modulation.
| Upregulated
| |||
|---|---|---|---|
| Fold change | Gene Title_Affymetrix | Gene Symbol | p-value |
| 2.917 | aurora kinase B | Aurkb | 0.046 |
| 2.770 | cyclin B1 | Ccnb1 | 0.092 |
| 2.743 | cyclin B2 | Ccnb2 | 0.004 |
| 2.724 | cyclin F | Ccnf | 0.085 |
| 3.122 | tight junction protein 2 | Tjp2 | 0.073 |
| 2.589 | checkpoint kinase 1 homolog (S. pombe) | Chek1 | 0.129 |
| 2.561 | CHK2 checkpoint homolog (S. pombe) | Chek2 | 0.018 |
| 2.418 | DNA methyltransferase (cytosine-5) 1 | Dnmt1 | 0.053 |
| 2.238 | retinoblastoma-like 1 (p107) | Rbl1 | 0.002 |
| 2.205 | RAD51 homolog (S. cerevisiae) | Rad51 | 0.113 |
| 2.117 | polo-like kinase (Drosophila) | Plk | 0.033 |
| 2.259 | geminin | Gmnn | 0.083 |
|
| |||
| Downregulated
| |||
| Fold change | Gene Title_Affymetrix | Gene Symbol | p-value |
| 0.010 | cadherin 11 | Cdh11 | 0.139 |
| 0.010 | necdin | Ndn | 0.013 |
| 0.099 | tissue inhibitor of metalloproteinase 3 | Timp3 | 0.109 |
| 0.115 | decorin | Dcn | 0.051 |
| 0.135 | ectonucleotide pyrophosphatase/phosphodiesterase 2 | Enpp2 | 0.028 |
| 0.142 | a disintegrin-like and metalloprotease (reprolysin type) with thrombospondin type 1 motif, 1 | Adamts1 | 0.046 |
| 0.145 | calpain 6 | Capn6 | 0.007 |
| 0.203 | neoplastic progression 1 | Npn1 | 0.088 |
| 0.243 | pregnancy-associated plasma protein A | Pappa | 0.028 |
| 0.272 | thrombospondin 2 | Thbs2 | 0.066 |
| 0.279 | growth arrest specific 2 | Gas2 | 0.089 |
| 0.351 | matrix metalloproteinase 2 | Mmp2 | 0.028 |
| 0.387 | transforming growth factor beta 1 induced transcript 4 | Tgfb1i4 | 0.044 |
| 0.410 | fibronectin 1 | Fn1 | 0.069 |
| 0.411 | thymus cell antigen 1, theta | Thy1 | 0.007 |
| 0.425 | fibrillin 1 | Fbn1 | 0.000 |
| 0.429 | lysyl oxidase | Lox | 0.151 |
| 0.438 | procollagen, type III, alpha 1 | Col3a1 | 0.082 |
| 0.493 | caveolin, caveolae protein | Cav | 0.020 |
| 0.637 | signal transducer and activator of transcription 3 | Stat3 | 0.024 |
Fig. 4. Validation by real time RT-PCR of the up- and down-regulated genes obtained using the expression display approach.
Total RNA from SV5 and SV5-NN4 cells, was purified and the mRNA levels of selected up-, A, and down-regulated genes, B, were analyzed by real time RT-PCR in SV5 and SV5-NN4 cells. Fold change was calculated using the Mgst3 gene as control, which was equally expressed on the different microarrays. Data represent the mean of 3 PCR amplifications expressed as fold-increase/decrease compared with SV5 cells.
Analysis of micro RNAs modulated in wt N-ras transfected cells
Many microRNAs (miRNAs) have been shown to be involved in processes that are dysregulated in tumorigenesis, such as proliferation, survival, and differentiation (Calin and Croce, 2006). We performed an expression display analysis of the miRNAs that are modulated by wt N-ras and have identified a number of miRNA that are either up-regulated, including let-7b and miR-125b, or down-regulated, miR-499, in this system. Performing a bioinformatic analysis using the miRBase (Sanger), TargetScan and Pictar databases we have observed that several of the predicted targets of the miRNAs, modulated by wt N-ras in our system, had already been identified as modulated in their expression by our microarray expression display. Although the main regulatory mode for miRNAs is through inhibition of translation, there is also evidence that they can also reduce RNA levels of their target genes and those appear to have been detected by the expression microarray. The fact that several of the known target genes for these miRNAs overlap with the list of genes (in bold) uncovered in the RNA expression display (Table 2), suggests that some of the genes we found downregulated by wt N-ras may be regulated through modulation of miRNAs, which validates the use of both approaches to determine which pathways are involved in the anti-malignant effects of wt N-ras. We performed quantitative RT-PCR to validate the results obtained using the microRNA array (Supplementary Figure 1).
Table 2.
MicroRNAs up- and down-regulated by wt Nras
| miR Upregulated by Nras in SV40 cells
| |||
|---|---|---|---|
| Name | FC (average) | STDEV | Predicted Targets |
| let_7b | 2.66 | 0.60 | Adamts5, Rab9, Pappa, Col6a2, Pcdhb9, Nid2, Rras, Stat3 |
| let_7a | 2.50 | 0.61 | Col6a2 |
| miR_125b | 2.37 | 0.32 | Igf2 |
| miR_99b | 2.23 | 1.19 | None |
| miR_29a | 2.23 | 0.08 | Tgfb1i4, Col6a2, Nid2, Ctsk, Cav2 |
| miR_27a | 2.03 | 0.66 | Rabl4, Idb4, Gstm1 |
| miR_16 | 1.96 | 0.37 | Rabl4, Bcl2l2, Adamts5, Capn6 |
| let_7d | 1.88 | 0.49 | Adamts5, Pappa, Col6a2 |
| miR_23b | 1.75 | 0.19 | Fnta, Col6a1, Capn6 |
| let_7f | 1.75 | 0.43 | Pappa, Col6a2 |
| miR_23a | 1.65 | 0.26 | Fnta, Col6a1, Capn6 |
|
| |||
| miR Downregulated by Nras in SV40 cells
| |||
| Name | FC (average) | STDEV | Predicted Targets |
| miR_26a | 0.64 | 0.17 | Atm |
| miR_26b | 0.54 | 0.21 | None |
| miR_34a | 0.44 | 0.14 | Gmn |
| miR_449 | 0.41 | 0.17 | Gmn, Hoxd8 |
| miR_298 | 0.41 | 0.24 | None |
| miR_33 | 0.39 | 0.11 | Gmn |
| miR_499 | 0.37 | 0.10 | Aurkb, Dnmt1 |
| miR_183 | 0.37 | 0.17 | None |
| miR_140 | 0.37 | 0.04 | None |
| miR_122a | 0.37 | 0.12 | None |
| miR_421 | 0.36 | 0.09 | Dnmt1 |
Restoring the TGFβ pathway in SV5-NN4 cells rescues its migration properties but does not result in an increase in proliferation
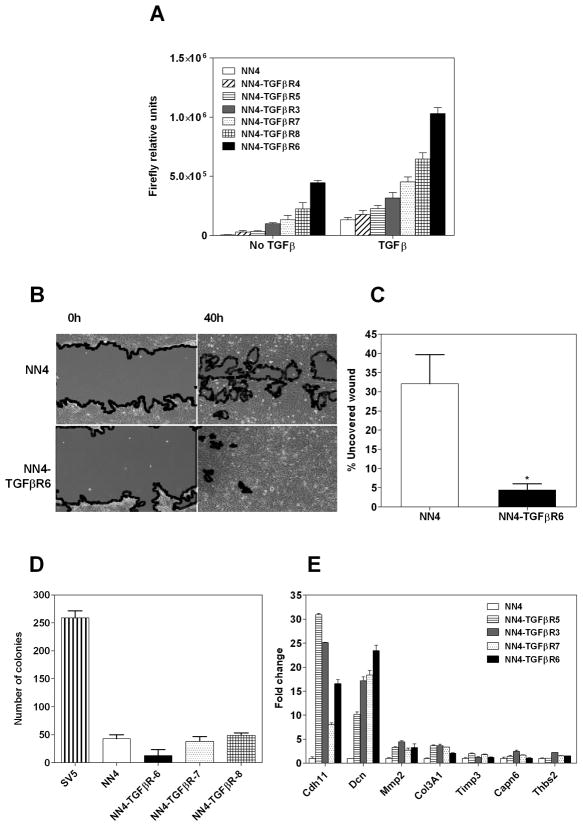
TGFβ signaling has an important role in tumor suppression and metastasis promotion (Massague, 2008). Analysis of our microarray data indicated that some of the down-regulated genes are TGFβ signaling pathway components and targets. This led us to hypothesize that the reduction of the oncogenic transformation in SV5 cells by wt N-ras may be due to an attenuation of the signaling through the TGFβ pathway signaling. Thus, we created stable clones in SV5-NN4 cells that express a constitutively active TGFβ Receptor I. To identify the clones with an activated TGFβ pathway, we transfected these cells with 3TPLux, a TGFβ-inducible reporter plasmid (Figure 5A). The addition of TGFβ still is able to increase the activation of the pathway due to the fact that this mutant is only able to activate the pathway at 60% of its maximum (Massague, personal communication). Once the clones were characterized, we wanted to explore whether TGFβ would counteract the anti-malignant properties, induced by wt N-ras, in SV5-NN4 cells. We performed a wound-healing assay and analyzed cell behavior at times 0 h and 40 h post-wounding (Figure 5B and C). We found that the constitutively active TGFβ I receptor was indeed able to rescue the migration properties of the transformed cells (p<0.05). We proceeded then to test its effects on anchorage independence. We performed a soft agar assay with some of the clones that express this mutant, but none was able to form colonies in this medium (Figure 5D). We also sought to determine if the most relevant genes identified on the previous QRT-PCR experiment to be down-regulated by wt N-ras were affected by constitutive activation of TGFβ. Thus, we performed a QRT-PCR on these cells and found that TGFβ reactivated the expression of Cadherin 11 and Decorin, and slightly MMP2 and Col3A1, but was unable to rescue other genes down-regulated by wt N-ras (Figure 5D). These experiments allowed us to conclude that the TGFβ pathway appears to mediate only some of the anti-malignant effects of wt N-ras.
Fig 5. Reconstitution of the TGFβ pathway restores migration but not anchorage independence.
A, SV5-NN4 clones stably expressing a constitutively activated TGFβ receptor were transiently transfected with 3TPLux, a TGFβ-inducible reporter plasmid. 24 hours after transfection, cells were treated or not with TGFβ during 24 hours. At 48 h post-transfection cells were lysed and firefly luciferase activity was determined. Bars represent the mean ± S.D. of 3 independent experiments. B, Wound healing of SV5-NN4 cells and SV5-NN4 cells expressing stably the constitutively activated TGFβ receptor I at times 0 and 40 hours. C, Percentage of uncovered wound of three separate experiments, measured at 24 hours along the scratch wound. * p<0.05. D, Soft agar assay of SV5, SV5-NN4 and some of the TGFβ expressing clones. Cells were seeded at day cero on a semi-solid medium and counted after 14 days. E, Quantitative PCR of genes downregulated in SV5-NN4 cells reactivated by TGFβ signaling. Fold change values are normalized to NN4 cells using Msgt3 as housekeeping gene.
Overexpression of Decorin increases proliferation and rescues migration
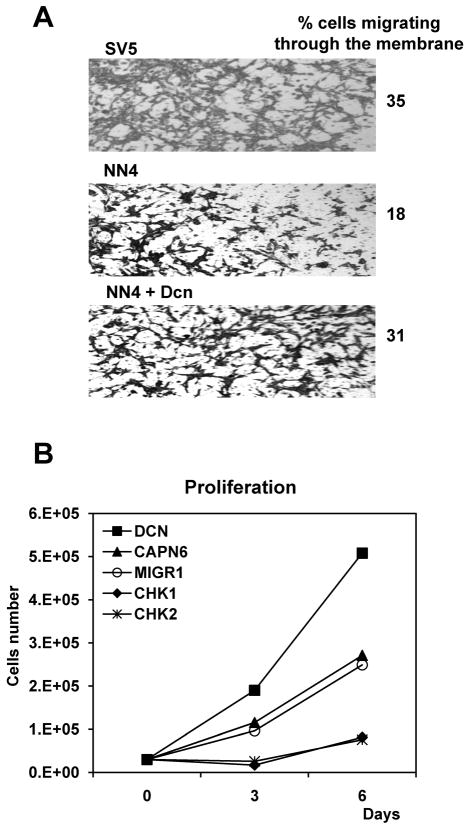
Our next goal was to see if the genes modulated by this pathway and other genes down-regulated or up-regulated by wt N-ras were able to rescue the oncogenic transformation exhibited by SV5 cells. We performed the biological assays in SV5-NN4 cells first by overexpressing a selection of the wt N-ras downregulated genes: Calpain 6, Decorin, Thbs2 and Tgfb1i4 (also called TSC22D1), and secondly by inhibiting with shRNA the wt N-ras upregulated genes: Chek1 and Chek2. We studied the migration pattern of the transduced cells 42 hours after the wound was made and found that only Decorin was able to induce an increase in the migratory phenotype of the SV5-NN4 cells (Figure 6A and data not shown). The interpretation of these results is that Decorin is downregulated by wt-N-ras as a way to inhibit migration and malignancy. When Decorin is added, migration is increased and that is consistent with our observation that wt N-ras downregulates its expression, as a mediator of its anti-malignant effects, as we have shown in the expression display analyses. The observation that Decorin reduces migration in 3T3 cells (more uncovered wound, figure 6B) is consistent with previous observations that Decorin inhibits proliferation in normal cells (Xaus et al., 2001) and since definitely does not produce any increase in migration there, indicates that the increase in migration observed in NN4 cells (less uncovered wound) is specific to the system with wt-N-ras. Our next goal was to observe the role of Decorin in invasion and proliferation. We found that NN4 cells infected with Decorin (Figure 7A) were more invasive (31%) than NN4 infected with an empty vector (MIGR1) (18%) and they could proliferate faster than NN4 cells infected with MIGR1 (Figure 7B). In the three NN4-TGFβ clones analyzed it appears to be a positive correlation between the rate of wound healing and the decorin expression levels.
Fig. 6. Decorin restores migration in SV5-NN4 cells.
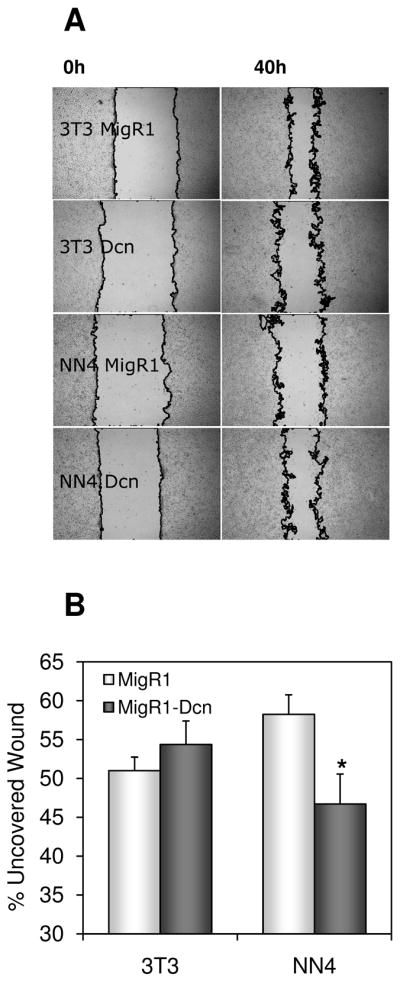
A, NIH3T3 and SV5-NN4 (NN4) cells infected with pMIGR1 (MigR1) or pMIGR1-Decorin (MigR1-Dcn) were seeded 72 hours post-infection, and the pictures were taken at time 0 and 24 hours after the wound was made. B, Quantification of migration by measuring the uncovered wound in three random selected microscopic fields for each condition. Data represent the mean ± S.D. from 3 independent experiments. * p<0.05.
Fig. 7. Decorin increases invasion and proliferation in SV5-NN4 cells.
A, SV5, NN4 and NN4 cells infected with a retroviral vector harboring decorin (Dcn) were seeded on migration chambers and the cells were photographed and counted after 24 hours. B, SV5-NN4 cells transduced by pMIGR1, Capn6, Dcn and the shRNA of Chek1 and Chek2 were plated 72 hours post-infection and the number of cells was determined every 3 days using a hemocytometer.
wt N-ras is not mediating the anti-malignant effect through the same pathways activated by transforming N-ras
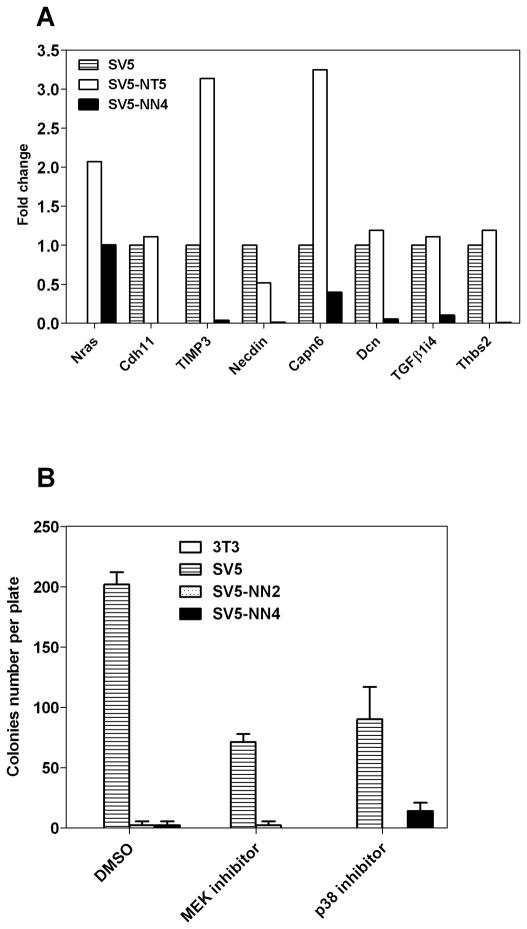
We have analyzed the expression of the genes modulated by wt N-ras in cells transformed by oncogenic N-ras. As shown in Figure 8A, the seven genes analyzed show the inverse expression pattern between the two cell types, supporting our hypothesis that the two alleles may be using different pathways to exert their opposed effects (compare the white with the black histogram values in figure 8A). We would like to emphasize that figure 8 is quite important to indicate that the effects of wt N-ras are opposite to those of activated N-ras. Given the complexity of the figure, it is important to remark that all the genes included are modulated in the opposite direction by wt N-ras and activated N-ras. It is therefore apparent that both N-ras isoforms are acting through different pathways and this is one of the important results of this report. Activated N-ras does not inhibit the malignant properties of SV5 (data not shown) indicating that the inhibition of transformation is an exclusive property of the wt allele.
Fig 8. Wt N-ras is not mediating the anti-malignant effect through classical pathways.
A, Comparative analysis by QRT-PCR of some of the genes downregulated by wt N-ras on SV5 cells and SV5 expressing the wt N-ras (SV5-NN4) or oncogenic (SV5-NT5) N-ras alleles. B, Reduction of colony number by wt N-ras is not through MEK and p38 pathways. Cells were grown on a semi-solid agarose medium in the presence of the MEK inhibitor (PD98059), p38 inhibitor (SB202190) or the vehicle (DMSO) and the number of colonies was counted 14 days later.
We also performed the anchorage-independence assay with SV5-NN cells using the MEK inhibitor, PD98059 and the p38 inhibitor, SB202190 in order to investigate pathways known to be activated by oncogenic N-ras which could be implicated in the reduced colony number seen in soft agar. As shown in Figure 8B, none of these inhibitors increased anchorage independent growth in the SV5-NN clones. This indicates that these pathways are not involved in mediating the anti-malignant effect of wt N-ras. Taken together these experiments suggest that wt N-ras activates alternative pathways to the conventional signal transduction routes known to be stimulated by oncogenic Ras. These results raise the possibility that unknown pathways still exist that are activated by Ras and that some of these pathways may be activated only by wt Ras, but not by oncogenic Ras. The uncovering of those pathways using the model system presented here could provide important new avenues to block the malignant state.
DISCUSSION
The results presented above raise several interesting questions about the mechanisms that genes use to regulate properties associated with malignant transformation. We have explored in the present report the ability of wt N-ras to counteract transforming properties of the SV40T oncogene, as well as the oncogenic transformation in some human tumor cell lines. These results with human tumor cell lines provide the rationale for the relevance of these studies in our SV5-NN model system. In previous reports, we and others have presented evidence indicating that wild type Ras genes could have a blunting effect on the transforming properties of their counterpart Ras oncogenes (Diaz et al., 2004; James et al., 2003) and we proposed several molecular mechanisms for that antagonistic effect (Diaz et al., 2005). We also reported evidence that wt N-ras has wider anti-malignant effects (Diaz et al., 2002), but we did not have information about what genes were the target of these anti-malignant effects. In the present report we show that wt N-ras displays anti-malignant effect against SV40T and in human tumor cell lines, raising the possibility that it could have a general anti-malignant effect against a variety of sources. This has spurred our interest to investigate the molecular mechanisms that could mediate this wt N-ras anti-malignant effect.
The tools that different genes utilize to modify the cell phenotype are usually a combination of modifications in gene and/or protein expression or modification, and more recently, changes in microRNA levels have also entered the equation (Calin and Croce, 2006). We report a number of findings that analyze the bases of this effect. One is the wt N-ras antagonism of some TGFβ activated pathways (see fig 5). Although TGFβ was considered for many years as the epitome of growth inhibitory factors (Laiho et al., 1990; Wakefield and Sporn, 1990), more recently it has been observed that it has many other activities and some of them have been shown to be important on the epithelial-mesenchymal transformation (EMT)(Derynck and Akhurst, 2007; Thuault et al., 2006; Zavadil and Bottinger, 2005; Zavadil et al., 2007), that it is so important in permitting some tumors to escape their environment to invade and metastasize (Buck et al., 2004; Dalal et al., 1993; Gupta and Massague, 2006; Kang et al., 2003; McEarchern et al., 2001; Padua et al., 2008). This appears to be one of the targets for the wt N-ras anti-malignant activity. Analyzing our expression profiling, after the introduction of wt N-ras in the cells, several prominent components of this pathway are modulated by wt N-ras in the opposite direction than TGFβ does (Cadherin 11, Thrombospondin 2, Timp3). In addition, many of the genes modulated by wt N-ras are not regulated in cells transformed by the N-ras oncogene (see fig 8A), supporting the hypothesis that the two N-ras isoforms regulate different pathways. There is evidence that decorin binds to the TGFβ receptor (Riquelme et al., 2001). The effect of the interaction between decorin and the TGFβ pathway is still a matter of debate, either as inactivating it (Border et al., 1992) or leading to its increased activity (Takeuchi et al., 1994).
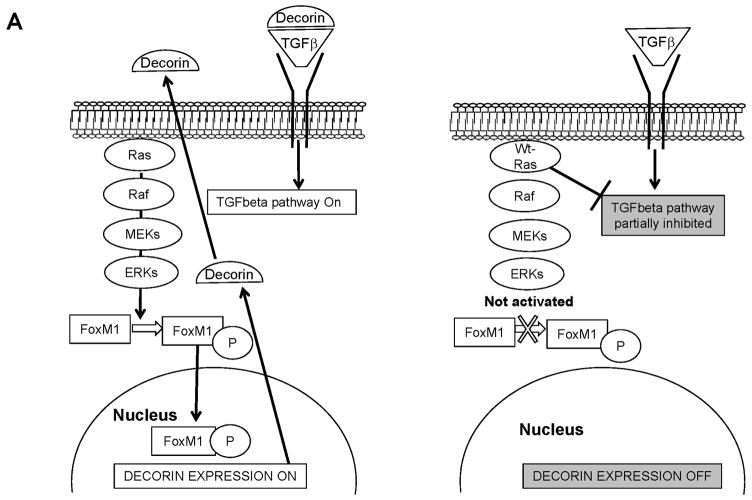
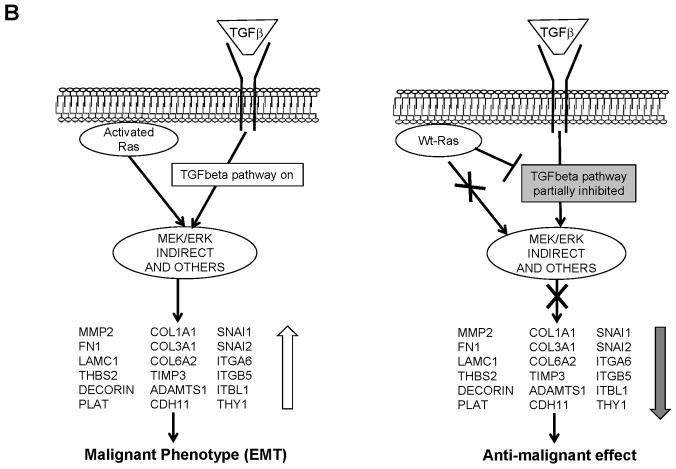
Using the DIRE analysis on the EGR browser we have tentatively identified some Transcription factors (TF) that have Transcription Factor Binding Sites (TFBS) in several of the genes modulated by wt N-ras (Supplementary Table 2). The Forkhead transcription factor FoxM1 appears to be a decorin regulator. FoxM1 is essential for mitotic progression (Wang et al., 2005), it localizes mainly in the cytoplasm in late G1/S and its nuclear translocation occurs during entry into G2/M. This translocation is associated with FoxM1 phosphorylation by ERK1/2 (Kim et al., 2005), which promotes tumour cell invasiveness. The downregulation of FoxM1 inhibits cell growth, cell migration and invasion (Padua et al., 2008) and mice deficient in FoxM1 have diminished TGFβ signalling (Kim et al., 2005). In our system, we would like to hypothesize that one potential molecule that wt N-ras may use to trigger its anti-malignant effect could be FoxM1 (see figure 9). Consistent with that idea is to note that FoxM1 has been shown to be activated by the active Ras pathway (Ma et al., 2005) and therefore this connects it to the observations in our system, although further characterization of the system would be necessary in the future to determine the extent of involvement of this protein in mediating wt N-ras effects. In SV5-NN4 cells, wt N-ras is not activating the Raf/MEK/MAPK signalling (Fig. 8B) and FoxM1 would be localized mainly in the cytoplasm remaining inactive as a non-phosphorylated form. In this scenario, TGFβ signalling would be decreased and decorin expression would be low (see figure 9A). In addition, many of the genes modulated by wt N-ras are modulated in the opposite direction by TGFβ to induce the EMT, which is instrumental in malignant transformation. This group of genes we postulate are those that mediate some of the anti-malignant effect by partially inhibiting some TGFβ activated pathways (see figure 9B)
Fig 9. Potential routes used by wt N-ras to mediate its anti-malignant effects.
A, In the left panel we represent the situation in which the Ras pathway is activated and in turn it activates FoxM1, which induces the expression of decorin that in turn facilitates the activation of the TGFβ pathways responsible for EMT and malignant transformation. In the right panel we represent our observation that wt N-ras does not activate the Ras pathway, FoxM1 is not activated and decorin is downregulated, which contributes to partial inhibition of the TGFβ pathway and inhibition of EMT. B, In the left panel we represent the effects of a Ras and TGFβ activated pathways facilitating EMT through the modulation of group of genes. In the right panel, we represent the results observed in our experiments in which wt N-ras has been shown to do not activate the Ras pathway and partially block the transcriptional program elicited by TGFβ. Since wt N-ras modulates in the opposite orientation as TGFβ many genes involved in EMT, this is a potential mechanism for mediating some of its anti-malignant effects.
We have found a good correlation among the miRNAs modulated by wt N-ras and the coding genes that change expression levels as measured by gene expression profiling (Table 1 and table 2), which reinforces the importance of the two independent analyses and provides additional evidence in the quest for the relevant target genes.
Besides the general interest of understanding the molecular bases to block transformation, it is important for the Ras field to explore the differences that separate the wild type allele of the oncogenic one. As mentioned in the Introduction, it has been an accepted concept that oncogenes are dominant over proto-oncogenes and that Ras proto-oncogenes activate the same pathways that the oncogenes, but at a lower level (Mangues et al., 1996). Here we report that the N-ras proto-oncogene has anti-malignant effects and that it does so by modulating different genes than its oncogenic counterpart, which indicates that it should be activating different pathways.
The anti-malignant effect elicited by wt N-ras described in this report has provided a number of candidate genes (Table 1), which will permit us to test their role in the different functions that together constitute the oncogenic transformation. Identification of these candidate genes provides important insights into the molecular bases of malignant transformation and identifies precious targets to design new therapeutic strategies.
Supplementary Material
Acknowledgments
We are grateful to Kathleen Rundell for the SV40 plasmid. The microarray analyses were performed with the help of the NYU Cancer Institute Genomics Facility. This work was supported by a grant to A.P. from the National Institutes of Health, CA36327. The first author was a recipient of a postdoctoral fellowship from the Ministry of Education and Science (Spain) and a CIBERehd contract from the Carlos III Institute of Health, Ministry of Science (Spain).
Footnotes
STATEMENT REGARDING CONFLICTS OF INTEREST
The authors declare no conflict of interest
Contributor Information
Marta Benet, Email: marta.benet@ciberehd.org.
Robin Yates Dulman, Email: rydulman@gmail.com.
Raffi Suzme, Email: raffi.suzme@nyumc.org.
Eleazar Vega-Saenz de Miera, Email: eleazar.vega@gmail.com.
Martha E. Vega, Email: Martha.Vega@nyumc.org.
Thuy Nguyen, Email: tn335@nyu.edu.
Jiri Zavadil, Email: Jiri.Zavadil@nyumc.org.
Angel Pellicer, Email: angel.pellicer@nyumc.org.
References
- Border WA, Noble NA, Yamamoto T, Harper JR, Yamaguchi Y, Pierschbacher MD, Ruoslahti E. Natural inhibitor of transforming growth factor-beta protects against scarring in experimental kidney disease. Nature. 1992;360(6402):361–364. doi: 10.1038/360361a0. [DOI] [PubMed] [Google Scholar]
- Bos JL. Ras-like GTPases. Biochim Biophys Acta. 1997;1333(2):M19–31. doi: 10.1016/s0304-419x(97)00015-2. [DOI] [PubMed] [Google Scholar]
- Buck MB, Fritz P, Dippon J, Zugmaier G, Knabbe C. Prognostic significance of transforming growth factor beta receptor II in estrogen receptor-negative breast cancer patients. Clin Cancer Res. 2004;10(2):491–498. doi: 10.1158/1078-0432.ccr-0320-03. [DOI] [PubMed] [Google Scholar]
- Calin GA, Croce CM. MicroRNA signatures in human cancers. Nat Rev Cancer. 2006;6(11):857–866. doi: 10.1038/nrc1997. [DOI] [PubMed] [Google Scholar]
- Cartwright CA, Eckhart W, Simon S, Kaplan PL. Cell transformation by pp60c-src mutated in the carboxy-terminal regulatory domain. Cell. 1987;49(1):83–91. doi: 10.1016/0092-8674(87)90758-6. [DOI] [PubMed] [Google Scholar]
- Corominas M, Perucho M, Newcomb EW, Pellicer A. Differential expression of the normal and mutated K-ras alleles in chemically induced thymic lymphomas. Cancer Res. 1991;51(19):5129–5133. [PubMed] [Google Scholar]
- Dalal BI, Keown PA, Greenberg AH. Immunocytochemical localization of secreted transforming growth factor-beta 1 to the advancing edges of primary tumors and to lymph node metastases of human mammary carcinoma. Am J Pathol. 1993;143(2):381–389. [PMC free article] [PubMed] [Google Scholar]
- De Donatis A, Comito G, Buricchi F, Vinci MC, Parenti A, Caselli A, Camici G, Manao G, Ramponi G, Cirri P. Proliferation versus migration in platelet-derived growth factor signaling: the key role of endocytosis. J Biol Chem. 2008;283(29):19948–19956. doi: 10.1074/jbc.M709428200. [DOI] [PubMed] [Google Scholar]
- Derynck R, Akhurst RJ. Differentiation plasticity regulated by TGF-beta family proteins in development and disease. Nat Cell Biol. 2007;9(9):1000–1004. doi: 10.1038/ncb434. [DOI] [PubMed] [Google Scholar]
- Diamond LE, Guerrero I, Pellicer A. Concomitant K- and N-ras gene point mutations in clonal murine lymphoma. Mol Cell Biol. 1988;8(5):2233–2236. doi: 10.1128/mcb.8.5.2233. [DOI] [PMC free article] [PubMed] [Google Scholar]
- Diaz R, Ahn D, Lopez-Barcons L, Malumbres M, Perez de Castro I, Lue J, Ferrer-Miralles N, Mangues R, Tsong J, Garcia R, Perez-Soler R, Pellicer A. The N-ras proto-oncogene can suppress the malignant phenotype in the presence or absence of its oncogene. Cancer Res. 2002;62(15):4514–4518. [PubMed] [Google Scholar]
- Diaz R, Lopez-Barcons L, Ahn D, Garcia-Espana A, Yoon A, Matthews J, Mangues R, Perez-Soler R, Pellicer A. Complex effects of Ras proto-oncogenes in tumorigenesis. Carcinogenesis. 2004;25(4):535–539. doi: 10.1093/carcin/bgh026. [DOI] [PubMed] [Google Scholar]
- Diaz R, Lue J, Mathews J, Yoon A, Ahn D, Garcia-Espana A, Leonardi P, Vargas MP, Pellicer A. Inhibition of Ras oncogenic activity by Ras protooncogenes. Int J Cancer. 2005;113(2):241–248. doi: 10.1002/ijc.20563. [DOI] [PubMed] [Google Scholar]
- Gao CF, Xie Q, Su YL, Koeman J, Khoo SK, Gustafson M, Knudsen BS, Hay R, Shinomiya N, Vande Woude GF. Proliferation and invasion: plasticity in tumor cells. Proc Natl Acad Sci U S A. 2005;102(30):10528–10533. doi: 10.1073/pnas.0504367102. [DOI] [PMC free article] [PubMed] [Google Scholar]
- Guerrero I, Villasante A, Corces V, Pellicer A. Loss of the normal N-ras allele in a mouse thymic lymphoma induced by a chemical carcinogen. Proc Natl Acad Sci U S A. 1985;82(23):7810–7814. doi: 10.1073/pnas.82.23.7810. [DOI] [PMC free article] [PubMed] [Google Scholar]
- Gupta GP, Massague J. Cancer metastasis: building a framework. Cell. 2006;127(4):679–695. doi: 10.1016/j.cell.2006.11.001. [DOI] [PubMed] [Google Scholar]
- Hernandez-Munoz I, Benet M, Calero M, Jimenez M, Diaz R, Pellicer A. rgr oncogene: activation by elimination of translational controls and mislocalization. Cancer Res. 2003;63(14):4188–4195. [PubMed] [Google Scholar]
- James RM, Arends MJ, Plowman SJ, Brooks DG, Miles CG, West JD, Patek CE. K-ras proto-oncogene exhibits tumor suppressor activity as its absence promotes tumorigenesis in murine teratomas. Mol Cancer Res. 2003;1(11):820–825. [PubMed] [Google Scholar]
- Kang Y, Siegel PM, Shu W, Drobnjak M, Kakonen SM, Cordon-Cardo C, Guise TA, Massague J. A multigenic program mediating breast cancer metastasis to bone. Cancer Cell. 2003;3(6):537–549. doi: 10.1016/s1535-6108(03)00132-6. [DOI] [PubMed] [Google Scholar]
- Kim IM, Ramakrishna S, Gusarova GA, Yoder HM, Costa RH, Kalinichenko VV. The forkhead box m1 transcription factor is essential for embryonic development of pulmonary vasculature. J Biol Chem. 2005;280(23):22278–22286. doi: 10.1074/jbc.M500936200. [DOI] [PubMed] [Google Scholar]
- Laiho M, DeCaprio JA, Ludlow JW, Livingston DM, Massague J. Growth inhibition by TGF-beta linked to suppression of retinoblastoma protein phosphorylation. Cell. 1990;62(1):175–185. doi: 10.1016/0092-8674(90)90251-9. [DOI] [PubMed] [Google Scholar]
- Lee MS, Moon EJ, Lee SW, Kim MS, Kim KW, Kim YJ. Angiogenic activity of pyruvic acid in in vivo and in vitro angiogenesis models. Cancer Res. 2001;61(8):3290–3293. [PubMed] [Google Scholar]
- Ma RY, Tong TH, Cheung AM, Tsang AC, Leung WY, Yao KM. Raf/MEK/MAPK signaling stimulates the nuclear translocation and transactivating activity of FOXM1c. J Cell Sci. 2005;118(Pt 4):795–806. doi: 10.1242/jcs.01657. [DOI] [PubMed] [Google Scholar]
- Malumbres M, Pellicer A. RAS pathways to cell cycle control and cell transformation. Front Biosci. 1998;3:d887–912. doi: 10.2741/a331. [DOI] [PubMed] [Google Scholar]
- Mangues R, Symmans WF, Lu S, Schwartz S, Pellicer A. Activated N-ras oncogene and N-ras proto-oncogene act through the same pathway for in vivo tumorigenesis. Oncogene. 1996;13(5):1053–1063. [PubMed] [Google Scholar]
- Massague J. TGFbeta in Cancer. Cell. 2008;134(2):215–230. doi: 10.1016/j.cell.2008.07.001. [DOI] [PMC free article] [PubMed] [Google Scholar]
- McEarchern JA, Kobie JJ, Mack V, Wu RS, Meade-Tollin L, Arteaga CL, Dumont N, Besselsen D, Seftor E, Hendrix MJ, Katsanis E, Akporiaye ET. Invasion and metastasis of a mammary tumor involves TGF-beta signaling. Int J Cancer. 2001;91(1):76–82. doi: 10.1002/1097-0215(20010101)91:1<76::aid-ijc1012>3.0.co;2-8. [DOI] [PubMed] [Google Scholar]
- Newcomb EW, Steinberg JJ, Pellicer A. ras oncogenes and phenotypic staging in N-methylnitrosourea- and gamma-irradiation-induced thymic lymphomas in C57BL/6J mice. Cancer Res. 1988;48(19):5514–5521. [PubMed] [Google Scholar]
- Padua D, Zhang XH, Wang Q, Nadal C, Gerald WL, Gomis RR, Massague J. TGFbeta primes breast tumors for lung metastasis seeding through angiopoietin-like 4. Cell. 2008;133(1):66–77. doi: 10.1016/j.cell.2008.01.046. [DOI] [PMC free article] [PubMed] [Google Scholar]
- Park WH, Jung CW, Park JO, Kim K, Kim WS, Im YH, Lee MH, Kang WK, Park K. Trichostatin inhibits the growth of ACHN renal cell carcinoma cells via cell cycle arrest in association with p27, or apoptosis. Int J Oncol. 2003;22(5):1129–1134. [PubMed] [Google Scholar]
- Perez de Castro I, Benet M, Jimenez M, Alzabin S, Malumbres M, Pellicer A. Mouse p10, an alternative spliced form of p15INK4b, inhibits cell cycle progression and malignant transformation. Cancer Res. 2005;65(8):3249–3256. doi: 10.1158/0008-5472.CAN-03-3445. [DOI] [PubMed] [Google Scholar]
- Riquelme C, Larrain J, Schonherr E, Henriquez JP, Kresse H, Brandan E. Antisense inhibition of decorin expression in myoblasts decreases cell responsiveness to transforming growth factor beta and accelerates skeletal muscle differentiation. J Biol Chem. 2001;276(5):3589–3596. doi: 10.1074/jbc.M004602200. [DOI] [PubMed] [Google Scholar]
- Roberts AB, Wakefield LM. The two faces of transforming growth factor beta in carcinogenesis. Proc Natl Acad Sci U S A. 2003;100(15):8621–8623. doi: 10.1073/pnas.1633291100. [DOI] [PMC free article] [PubMed] [Google Scholar]
- Shizukuda Y, Tang S, Yokota R, Ware JA. Vascular endothelial growth factor-induced endothelial cell migration and proliferation depend on a nitric oxide-mediated decrease in protein kinase Cdelta activity. Circ Res. 1999;85(3):247–256. doi: 10.1161/01.res.85.3.247. [DOI] [PubMed] [Google Scholar]
- Takeuchi Y, Kodama Y, Matsumoto T. Bone matrix decorin binds transforming growth factor-beta and enhances its bioactivity. J Biol Chem. 1994;269(51):32634–32638. [PubMed] [Google Scholar]
- Thuault S, Valcourt U, Petersen M, Manfioletti G, Heldin CH, Moustakas A. Transforming growth factor-beta employs HMGA2 to elicit epithelial-mesenchymal transition. J Cell Biol. 2006;174(2):175–183. doi: 10.1083/jcb.200512110. [DOI] [PMC free article] [PubMed] [Google Scholar]
- Vos MD, Clark GJ. RASSF family proteins and Ras transformation. Methods Enzymol. 2006;407:311–322. doi: 10.1016/S0076-6879(05)07026-6. [DOI] [PubMed] [Google Scholar]
- Wakefield LM, Sporn MB. Suppression of carcinogenesis: a role for TGF-beta and related molecules in prevention of cancer. Immunol Ser. 1990;51:217–243. [PubMed] [Google Scholar]
- Wang IC, Chen YJ, Hughes D, Petrovic V, Major ML, Park HJ, Tan Y, Ackerson T, Costa RH. Forkhead box M1 regulates the transcriptional network of genes essential for mitotic progression and genes encoding the SCF (Skp2-Cks1) ubiquitin ligase. Mol Cell Biol. 2005;25(24):10875–10894. doi: 10.1128/MCB.25.24.10875-10894.2005. [DOI] [PMC free article] [PubMed] [Google Scholar]
- Welm AL. TGFbeta primes breast tumor cells for metastasis. Cell. 2008;133(1):27–28. doi: 10.1016/j.cell.2008.03.012. [DOI] [PubMed] [Google Scholar]
- Xaus J, Comalada M, Cardo M, Valledor AF, Celada A. Decorin inhibits macrophage colony-stimulating factor proliferation of macrophages and enhances cell survival through induction of p27(Kip1) and p21(Waf1) Blood. 2001;98(7):2124–2133. doi: 10.1182/blood.v98.7.2124. [DOI] [PubMed] [Google Scholar]
- Zagzag D, Esencay M, Mendez O, Yee H, Smirnova I, Huang Y, Chiriboga L, Lukyanov E, Liu M, Newcomb EW. Hypoxia- and vascular endothelial growth factor-induced stromal cell-derived factor-1alpha/CXCR4 expression in glioblastomas: one plausible explanation of Scherer’s structures. Am J Pathol. 2008;173(2):545–560. doi: 10.2353/ajpath.2008.071197. [DOI] [PMC free article] [PubMed] [Google Scholar]
- Zavadil J, Bottinger EP. TGF-beta and epithelial-to-mesenchymal transitions. Oncogene. 2005;24(37):5764–5774. doi: 10.1038/sj.onc.1208927. [DOI] [PubMed] [Google Scholar]
- Zavadil J, Narasimhan M, Blumenberg M, Schneider RJ. Transforming growth factor-beta and microRNA:mRNA regulatory networks in epithelial plasticity. Cells Tissues Organs. 2007;185(1–3):157–161. doi: 10.1159/000101316. [DOI] [PubMed] [Google Scholar]
- Zhang Z, Wang Y, Vikis HG, Johnson L, Liu G, Li J, Anderson MW, Sills RC, Hong HL, Devereux TR, Jacks T, Guan KL, You M. Wildtype Kras2 can inhibit lung carcinogenesis in mice. Nat Genet. 2001;29(1):25–33. doi: 10.1038/ng721. [DOI] [PubMed] [Google Scholar]
Associated Data
This section collects any data citations, data availability statements, or supplementary materials included in this article.


