Abstract
Background
We hypothesized that two independent wavelengths of near-infrared (NIR) fluorescent light could be used to identify bile ducts and hepatic arteries simultaneously, and intraoperatively.
Materials and Methods
Three different combinations of 700 nm and 800 nm fluorescent contrast agents specific for bile ducts and arteries were injected into N = 10 35-kg female Yorkshire pigs intravenously. Combination 1 (C-1) was methylene blue (MB) for arterial imaging and indocyanine green (ICG) for bile duct imaging. Combination 2 (C-2) was ICG for arterial imaging and MB for bile duct imaging. Combination 3 (C-3) was a newly developed, zwitterionic NIR fluorophore ZW800-1 for arterial imaging and MB for bile duct imaging. Open and minimally invasive surgeries were imaged using the FLARE™ and m-FLARE™ systems, respectively.
Results
Although the desired bile duct and arterial anatomy could be imaged with contrast-to-background ratios (CBRs) ≥ 6 using all 3 combinations, each one differed significantly in terms of repetition and prolonged imaging. ICG injection resulted in high CBR of the liver and common bile duct (CBD) and prolonged imaging time (120 min) of the CBD (C-1). However, because ICG also resulted in high background of liver and CBD relative to arteries, ICG produced a lower arterial CBR (C-2) at some time points. C-3 provided the best overall performance, although C-2, which is clinically available, did enable effective laparoscopy.
Conclusions
We demonstrate that dual-channel NIR fluorescence imaging provides simultaneous, real-time, and high resolution identification of bile ducts and hepatic arteries during biliary tract surgery.
Keywords: Near-infrared fluorescence, dual-channel imaging, hepatic artery, cystic artery, bile duct, indocyanine green, methylene blue, ZW800-1, laparoscopic cholecystestomy, image guided surgery
INTRODUCTION
Laparoscopic cholecystectomy (LC) is one of the most commonly performed hepatobiliary surgeries. However, in 2.6% to 10% of cases (1–7), conversion to open cholecystectomy (OC) is necessary, typically due to unexpected anatomy (14.8%–74.5%), severe inflammation or adhesion (27.7%–62%), hemorrhage (3.2%–33.3%), or bile duct injury (4.3%–12%) (3–6). To help prevent bile duct injury, we have previously described the use of intraoperative near-infrared (NIR) fluorescence imaging to visualize the extrahepatic bile ducts in real time (8, 9).
Due to possible anatomical variations of the hepatic artery, unexpected laceration and hemorrhage is also a major complication of LC (10–13). Although typically not life-threatening, hemorrhage often leads to conversion to OC, and a prolonged hospital stay and convalescence (14). Additionally, if concomitant hepatic arterial injury and bile duct injury has occurred, liver necrosis, abscess, or stenosis of the bile duct may result after reconstruction (13, 15, 16).
Presently, computed tomography (CT) and magnetic resonance (MR) angiography provide excellent visualization of the hepatic artery anatomy during preoperative planning (17, 18). Nevertheless, these studies are costly and do not provide intraoperative assessment and reassessment. The enabling technology for our studies is the Fluorescence-Assisted Resection and Exploration (FLARE™) optical imaging platform and the minimally invasive FLARE™ system (m-FLARE™), which both provide simultaneous acquisition of color video and two independent channels of NIR fluorescence, one centered at 700 nm, and the other at 800 nm.
We hypothesized that by combining FLARE™ and m-FLARE™ with anatomy-specific NIR fluorescent contrast agents, most of which are already clinically available, both the bile duct and hepatic artery anatomy could be visualized in real-time intraoperatively, simultaneously, and with high resolution, during both OC and LC.
MATERIALS AND METHODS
NIR Fluorescent Contrast Agents for Bile Duct and Hepatic Artery Imaging
Methylene blue (MB) was purchased from Taylor Pharmaceuticals (Decatur, IL) as a 10-mg/ml (31.3-mM) stock solution. Indocyanine green (ICG) was purchased from Akorn Inc., (Decatur, IL) and resuspended with the supplied diluent to yield a 2.5-mg/ml (3.2-mM) stock solution. ZW800-1 was synthesized from small molecule reactants (Choi et al., manuscript in preparation) and resuspended in saline as a 2.5-mg/ml (2.2-mM) stock solution.
Optical Property Measurements
Optical properties of NIR fluorescent contrast agents were measured in swine bile or 100% fetal bovine serum buffered with 50 mM HEPES, pH 7.4 (FBS). For fluorescence quantum yield (QY) measurements of MB, oxazine 725 in ethylene glycol (QY = 19%) (19) was used as a calibration standard, under conditions of matched absorbance at 655 nm. For QY of ICG and ZW800-1, ICG in dimethylsulfoxide (QY=13%) (20) was used as a calibration standard under conditions of matched absorbance at 770 nm. Measurements were performed using HR2000 absorbance (200–1,100 nm) and USB2000FL fluorescence (350–1,000 nm) spectrometers (Ocean Optics, Dunedin, FL). NIR excitation was provided by a 770-nm NIR laser diode light source (Electro Optical Components, Santa Rosa, CA) set to 8 mW and coupled through a 300-μm core diameter, and an optical fiber numerical aperture (NA) of 0.22 (Fiberguide Industries, Stirling, NJ).
NIR Fluorescent Contrast Agent Combinations
Dose, timing, and anatomical structures imaged for each contrast agent combination are shown in Table 1. Combination 1 (C-1) was MB for arterial anatomy and ICG for bile duct imaging. Combination 2 (C-2) was ICG for arterial anatomy and MB for bile duct imaging. Combination 3 (C-3) was ZW800-1 for arterial imaging and MB for bile duct imaging. For arterial imaging, there is a 10 to 20 s lag between injection and optimal imaging depending on the length of intravenous tubing. For bile duct imaging, there is a time lag of minutes to hours depending on the clearance properties of the contrast agent, i.e., the time it takes for elimination from blood into bile. For MB imaging of the bile duct, a concentration of 2.0 mg/kg diluted in 20-ml saline was injected over 5 min to minimize the likelihood of methemoglobin production.
Table 1.
Combinations of Bile Duct and Arterial NIR Fluorescent Contrast Agents
| Combination | Bile Duct | Artery* | ||
|---|---|---|---|---|
| Fluorophore | Dose | Fluorophore | Dose | |
| C-1 | ICG1 | 0.04 mg/kg | MB | 0.3 mg/kg |
| C-2 | MB2 | 2.0 mg/kg | ICG | 0.04 mg/kg |
| C-3 | MB2 | 2.0 mg/kg | ZW800-1 | 0.05 mg/kg |
ICG was injected 60 to 90 min prior to imaging
MB was injected 5 min prior to imaging
Fluorophores for arterial visualization were injected immediately prior to imaging
FLARE™ Imaging System
The FLARE™ imaging system has been described in detail previously by our laboratory (21, 22). Color video (i.e., the surgical field) and two independent channels (centered at 700 nm and 800 nm) of NIR fluorescence emission images are obtained simultaneously and in real time, and merged together. The NIR fluorescence images can be assigned different “pseudo-colors” from a multicolor palette and overlaid on top of the color video images.
m-FLARE™ Imaging System Components
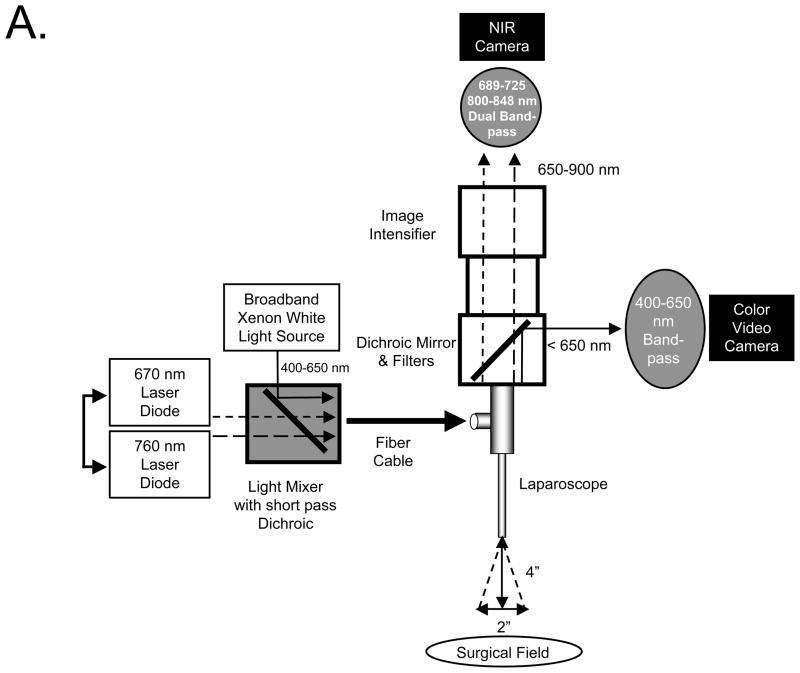
The first prototype laparoscopic FLARE™ imaging system was described in detail previously by our laboratory (8, 23). The newest version, known as m-FLARE™, utilizes white light from a custom 300W Xenon light source (Wilson Associates, Weymouth, MA), equipped with filtration to remove all NIR and infrared light, which was combined with light from a 1 W 670 nm and 2.5W 760-nm laser diode assembly (OZ Optics, Quebec, CA) through a custom light mixer (Qioptiq Imaging Solutions, Rochester, NY) into a 0.6-NA fiber-optic cable that illuminates a standard rigid laparoscope (10-mm diameter, 0°; Storz, Tuttlingen, Germany). The optimal distance between the laparoscope and the surgical field is 4 inches. Through a laparoscope, 30,000 lx of white light (400–650 nm), 6.0 mW/cm2 of 670 nm near-infrared (NIR) fluorescence excitation light, and 20.0 mW/cm2 of 760-nm NIR fluorescence excitation light are generated over 2 inches field of view (FOV). The eyepiece of the laparoscope was attached to custom optics (Qioptiq Imaging Solutions, Fairport, NY), which permitted simultaneous acquisition of color video and 700 or 800-nm NIR light using a scA640-74gc (Basler, Ahrensburg, Germany) color CCD camera and GC655 (Prosilica, Stadtroda, Germany) NIR camera. Excitation light sequences rapidly between 670 nm and 760 nm excitation to provide 2 semi-independent channels of fluorescence emission.
Animal Model System
Animals were studied under the supervision of an approved institutional protocol. Ten female Yorkshire pigs from E.M. Parsons and Sons (Hadley, MA) averaging ≈ 35 kg were induced with 4.4 mg/kg intramuscular Telazol™, intubated, and maintained with 2% isoflurane. Heart rate, ECG, oxygen saturation, and body temperature were monitored throughout the experiments (24, 25).
Simultaneous NIR Fluorescence Imaging of Bile Ducts and Hepatic Arteries
A standard midline laparotomy was performed and a right transrectus incision was made. Intact extrahepatic bile ducts and hepatic arteries were studied without dissection of the hepatoduodenal ligament. For quantitative assessment, each NIR fluorescent contrast agent combination (Table 1) was studied in groups of N = 3 pigs during open surgery using the FLARE™ imaging system (N = 9 pigs total). An additional animal (N = 1) was studied during laparoscopy using the m-FLARE™ imaging system. Images were recorded at the time of injection (T = 0 min), then 5, 10, 30, 60, 90, 120 min postinjection using a camera exposure time of 150 ms for MB, 30 ms for ICG, and 150 ms for ZW800-1, respectively. Exposure times were chosen such that the fluorescence cameras were never saturated.
Quantitative Assessment
To quantify contrast agent performance, fluorescence intensity (FI) of the bile ducts, liver, right hepatic artery (RHA), and cystic artery (CA) were measured. At each time point, the FI of a region of interest (ROI) over the common bile duct (CBD), liver, RHA, and CA were quantified using custom software. The contrast-to-background ratio (CBR) was calculated using the formula CBR = (FI of ROI – BG intensity)/BG intensity, where the exposed rectus muscle was used as background. To summarize large amounts of data in Table format, 3 grades were defined as “−”, “+”, and “++” by comparing CBR of liver and/or CBD. When the mean CBR of artery was higher than that of liver and CBD, the evaluation of that combination was “++”. When the mean CBR of artery was lower than either that of liver or that of CBD, the assessment was “+”. Finally, when CBR of artery was lower than both that of liver and that of CBD, the assessment was “−”.
RESULTS
Optical Properties of Near-Infrared Fluorescent Contrast Agents
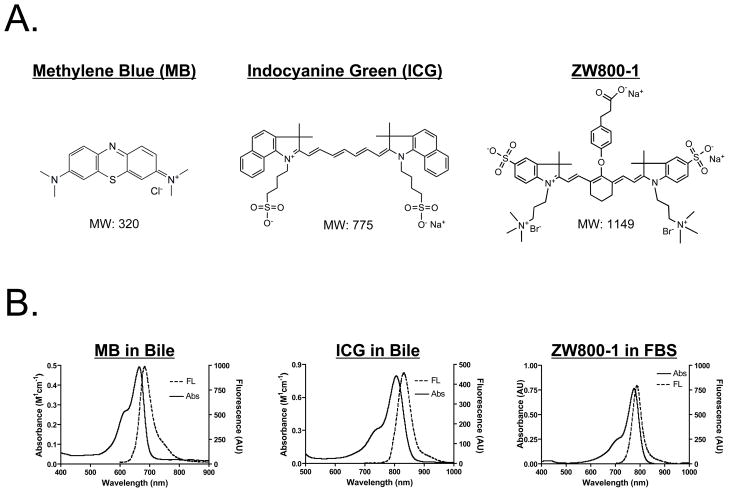
The chemical structure, absorbance, and fluorescence curves for all fluorescent contrast agents are shown in Figure 1. Table 2 details the optical properties of each agent in FBS and swine bile. To summarize, MB exhibits fluorescence properties compatible with NIR fluorescence channel #1 (700 nm) of the FLARE™ and m-FLARE™ imaging systems, and ICG and ZW800-1 exhibits fluorescence properties compatible with NIR fluorescence channel #2 (800 nm) of the FLARE™ and m-FLARE™ imaging systems.
Figure 1. Optical Properties of Bile Duct and Arterial NIR Fluorescent Contrast Agents.
A. Chemical structures and molecular weights (MW) of MB (left), ICG (middle), and ZW800-1 (right).
B. Absorbance and fluorescence spectra of MB in bile (left), ICG in bile (middle), and ZW800-1 in fetal bovine serum (FBS; right).
Table 2.
Optical Properties of Methylene Blue (MB), Indocyanine Green (ICG), and ZW800-1
| Optical Property | MB | ICG | ZW800-1 | ||
|---|---|---|---|---|---|
| FBS | Swine Bile | FBS | Swine Bile | FBS | |
| Extinction coefficient (M−1 cm−1) | 71,200 | 53,300 | 121,000 | 109,000 | 249,000 |
| Absorbance maximum (nm) | 665 | 668 | 807 | 806 | 772 |
| Emission maximum (nm) | 688 | 688 | 822 | 832 | 788 |
| Quantum yield (%) | 3.8 | 4.7 | 9.3 | 4.0 | 15.1 |
Dual-Channel NIR Fluorescence Imaging of Bile Ducts and Hepatic Arteries During Open Surgery
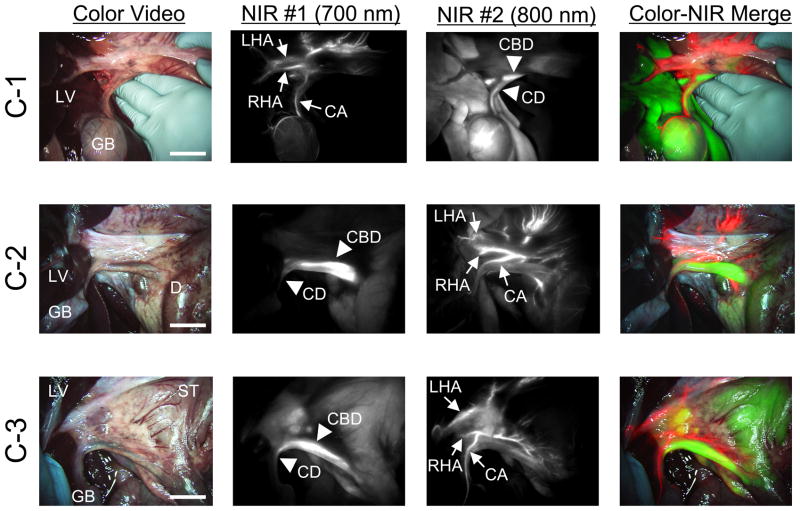
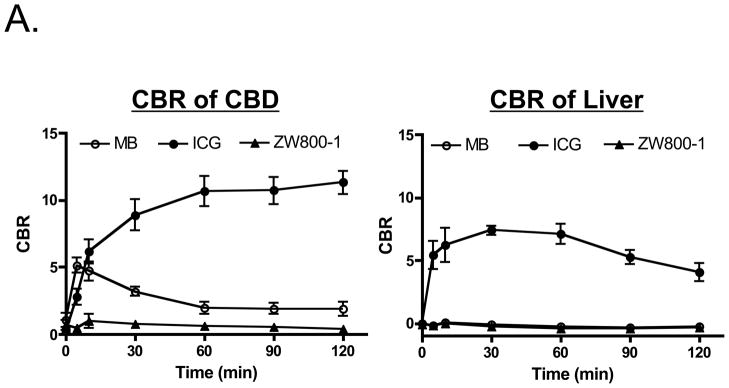
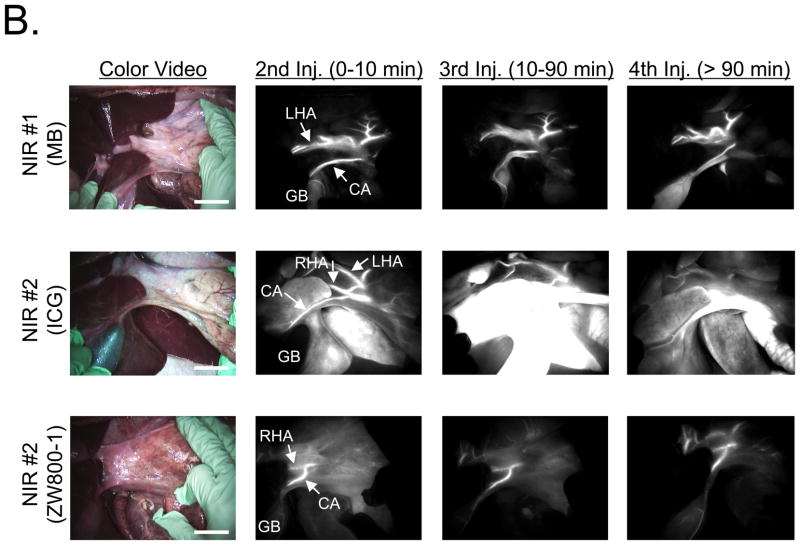
MB and ICG were used for bile duct imaging because after intravenous injection, they are naturally cleared from the blood into bile and render it highly NIR fluorescent (8). MB, ICG, and ZW800-1 were used for hepatic artery imaging because each provides bright arterial signal after intravenous injection as a rapid bolus (26). The maximum CBR on RHA and CA after bolus injection (10–20 s after injection) are shown in Table 3. As shown in Figure 2, all 3 NIR fluorescent contrast agent combinations provided the desired identification of bile ducts and hepatic arteries prior to dissection of the hepatoduodenal ligament. However, there were significant differences in contrast agent timing and performance. As shown in Figure 3A, ICG was cleared slowly from the blood into bile, providing prolonged and high contrast of the bile ducts, but also extremely high background in the liver. MB was cleared quickly from the blood into bile with little liver fluorescence, but resulted in a lower overall CBR. Because of ICG’s high retention in liver, repetitive arterial imaging was also problematic (Figure 3B). ZW800-1 provided high hepatic artery contrast and repetitive imaging (Figure 3B) because of its exclusive clearance via renal filtration. Performance results for all NIR fluorescent contrast agent combinations are summarized in Table 4.
Table 3.
The Maximum CBR of RHA and CA after Injection
| Fluorophore | CBR of RHA (Mean ± SEM) | CBR of CA (Mean ± SEM) |
|---|---|---|
| MB | 7.84 ± 0.30 | 7.80 ± 0.19 |
| ICG | 6.73 ± 0.36 | 6.52 ± 0.25 |
| ZW800-1 | 8.65 ± 0.37 | 8.57 ± 0.35 |
Figure 2. Simultaneous Dual-Channel Imaging of Bile Ducts and Hepatic Arteries.
The timing and dose of each combination are described in Table 1. The images are obtained by C-1 (top row), C-2 (middle row), and C-3 (bottom row). Shown are color video (left), 700 nm NIR fluorescence channel #1 (NIR #1; 2nd column), 800 nm NIR fluorescence channel #2 (NIR #2; 3rd column), and a pseudo-colored merge of the three (right). Red was used to pseudo-color arteries and green was used to pseudo-color bile ducts in the merged image. Arrowheads indicate bile ducts. CA: cystic artery, CBD: common bile duct, CD: cystic duct, D: duodenum, GB: gallbladder, LV: liver, LHA: left hepatic artery, RHA: right hepatic artery, ST: stomach. Scale bar = 3 cm.
Figure 3. Repetitive Injections for Visualization of the Hepatic Arteries.
A. Direct comparison (N = 3 pigs per contrast agent) of CBR (mean ± SEM) in the CBD (left) and liver (right) for MB, ICG, and ZW800-1 as a function of time postinjection. Doses used are listed in Table 1.
B. Visualization of hepatic arteries after repeated injections of MB (top row), ICG (middle row), and ZW800-1 (bottom row). Shown are color video (left), 700 nm NIR fluorescence channel #1 for MB (NIR #1; top row) and 800 nm NIR fluorescence channel #2 (NIR #2; middle and bottom rows) for ICG and ZW800-1. Arrows indicate arteries. CA: cystic artery, GB: gallbladder, LHA: left hepatic artery, RHA: right hepatic artery. Scale bar = 3 cm.
Table 4.
Injection Timing for Arterial Imaging
| Fluorophore | Time Interval | Performance | Pros and Cons | |
|---|---|---|---|---|
| MB | 0 – 10 min | ++ | ||
| 10 – 90 min | ++ | Multiple injections without high background | ||
| ≥ 90 min | ++ | |||
| ICG | 0 – 10 min | ++ | Multiple injections without high background | |
| 10 – 90 min | − | Interference from ICG accumulation in liver and clearance into bile, leading to high background | ||
| ≥ 90 min | + | Artery can be visualized although bile ducts are still very bright | ||
| ZW800-1 | 0 – 10 min | ++ | ||
| 10 – 90 min | ++ | Multiple injections without high background | ||
| ≥ 90 min | ++ |
++: High contrast arterial imaging (mean CBR of artery > both mean CBR of liver and mean CBR of CBD)
+ : Low contrast arterial imaging (mean CBR of artery < either mean CBR of liver or mean CBR of CBD)
− : Poor contrast arterial imaging (mean CBR of artery < both mean CBR of liver and mean CBR of CBD)
Dual-Channel NIR Fluorescence Imaging of Bile Ducts and Hepatic Arteries During Minimally Invasive Surgery
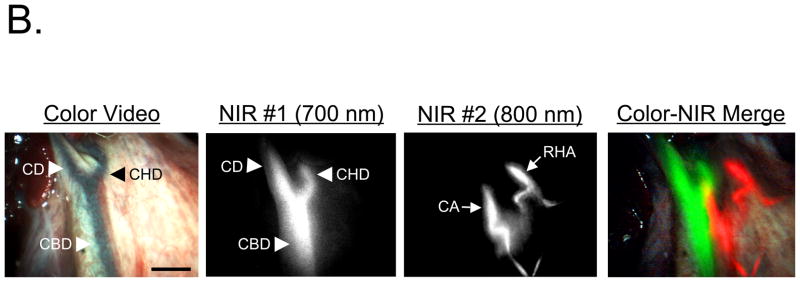
Light paths and system components of the m-FLARE™ minimally invasive imaging system are show in Figure 4A. NIR fluorescent contrast agent combination C-2 was chosen for laparoscopic imaging because both agents are already available clinically. Performance of the m-FLARE™ imaging system is shown in Figure 4B and suggests that simultaneous, real-time identification of bile ducts and hepatic arteries is possible, with results similar to open surgery using the FLARE™ imaging system, although resolution and exposure time are not yet optimal.
Figure 4. Minimally Invasive, Dual-Channel Imaging of Bile Ducts and Hepatic Arteries.
A. Light paths and system components of the m-FLARE™ minimally invasive, dual-channel laparoscopic imaging system.
B. Simultaneous, real-time imaging of bile ducts (arrowheads) and hepatic arteries (arrows) using m-FLARE™ and C-2 (MB for bile duct imaging and ICG for hepatic artery imaging). Shown are color video (left), 700 nm NIR fluorescence channel #1 (NIR #1; 2nd column), 800 nm NIR fluorescence channel #2 (NIR #2; 3rd column), and a pseudo-colored merge of the three (right). Red was used to pseudo-color arteries and green was used to pseudo-color bile ducts in the merged image. CA: cystic artery, CBD: common bile duct, CD: cystic duct, CHD: common hepatic duct, RHA: right hepatic artery. Scale bar = 1 cm.
DISCUSSION
In this study, we explored the use of 2 independent wavelengths of invisible NIR fluorescent light to provide simultaneous contrast of extrahepatic bile ducts and hepatic arteries during hepatobiliary surgery. To maximize the likelihood of future clinical translation, 2 of the NIR fluorescent contrast agent combinations chosen (C-1 and C-2) were composed of injectable agents already FDA-approved for other indications. The third contrast agent combination was composed of a new, improved 800-nm NIR fluorescent contrast agent that exhibits no clearance through the liver.
A key finding of this study is that all 3 combinations permit simultaneous and real-time identification of the extrahepatic bile ducts and hepatic arteries. However, differences in performance require careful selection of the correct combination. If the goal is immediate clinical translation, then C-2 (MB for bile duct imaging and ICG for arterial imaging) is the best choice because non-bolus injection of MB minimizes the risk of adverse events, MB does not result in high liver background when imaging bile ducts, and ICG provides extremely high contrast in the hepatic arteries. The only drawback to C-2 is that ICG exhibits high and prolonged retention and background in liver tissue, thus making repetitive imaging of the hepatic arteries increasingly difficult (Figure 3B). To solve this problem, C-3 replaces ICG with ZW800-1. Although ZW800-1 is not yet available clinically, it has recently been accepted by the National Cancer Institute Experimental Therapeutics (NExT) Program and is in the process of being translated for first-inhuman testing.
A second key finding of this study is that simultaneous identification of bile ducts and hepatic arteries is possible during both open and minimally invasive surgery. This is important because most cholecystectomies are now performed using laparoscopy, yet some LC requires conversion to OC. Nevertheless, the m-FLARE™ system is not yet optimal and will require a redesign of the laser light delivery module and camera optics to provide the high performance seen with FLARE™ during open surgery. Even when the technology becomes optimized, it remains to be seen whether FLARE™ or m-FLARE™ will reduce the need for pre-operative imaging studies.
We focused on cholecystectomy because it is a commonly performed procedure. However, the technology may also prove useful during liver resection and transplant given the complexity of the bile duct and hepatic artery anatomy in the hepatic hilum.
Acknowledgments
Sources of Financial Support: This study was funded by National Institutes of Health (National Cancer Institute) grant #R01-CA-115296.
This work was funded by National Institutes of Health (National Cancer Institute) grant #R01-CA-115296 to JVF. We thank Lindsey Gendall for editing and Eugenia Trabucchi for administrative assistance.
ABBREVIATIONS
- CA
Cystic artery
- CBD
Common bile duct
- CBR
Contrast-to-background ratio
- CD
Cystic duct
- C-1
Combination 1
- C-2
Combination 2
- C-3
Combination 3
- CT
Computed tomography
- ECG
Electrocardiogram
- FI
Fluorescence intensity
- FLARE™
Fluorescence-Assisted Resection and Exploration surgical imaging system
- FOV
Field of view
- ICG
Indocyanine green
- LC
Laparoscopic cholecystectomy
- LED
Light emitting diode
- MB
Methylene blue
- m-FLARE™
Minimally invasive FLARE™ imaging system
- MR
Magnetic resonance
- NIR
Near-infrared
- OC
Open cholecystectomy
- QY
Quantum yield
- RHA
Right hepatic artery
- ZW800-1
Zwitterionic heptamethine indocyanine fluorophores
References
- 1.Livingston EH, Rege RV. A nationwide study of conversion from laparoscopic to open cholecystectomy. Am J Surg. 2004;188:205–211. doi: 10.1016/j.amjsurg.2004.06.013. [DOI] [PubMed] [Google Scholar]
- 2.Kologlu M, Tutuncu T, Yuksek YN, Gozalan U, Daglar G, Kama NA. Using a risk score for conversion from laparoscopic to open cholecystectomy in resident training. Surgery. 2004;135:282–287. doi: 10.1016/s0039-6060(03)00395-7. [DOI] [PubMed] [Google Scholar]
- 3.Simopoulos C, Botaitis S, Polychronidis A, Tripsianis G, Karayiannakis AJ. Risk factors for conversion of laparoscopic cholecystectomy to open cholecystectomy. Surg Endosc. 2005;19:905–909. doi: 10.1007/s00464-004-2197-0. [DOI] [PubMed] [Google Scholar]
- 4.Ishizaki Y, Miwa K, Yoshimoto J, Sugo H, Kawasaki S. Conversion of elective laparoscopic to open cholecystectomy between 1993 and 2004. Br J Surg. 2006;93:987–991. doi: 10.1002/bjs.5406. [DOI] [PubMed] [Google Scholar]
- 5.Zhang WJ, Li JM, Wu GZ, Luo KL, Dong ZT. Risk factors affecting conversion in patients undergoing laparoscopic cholecystectomy. ANZ J Surg. 2008;78:973–976. doi: 10.1111/j.1445-2197.2008.04714.x. [DOI] [PubMed] [Google Scholar]
- 6.Avgerinos C, Kelgiorgi D, Touloumis Z, Baltatzi L, Dervenis C. One thousand laparoscopic cholecystectomies in a single surgical unit using the “critical view of safety” technique. J Gastrointest Surg. 2009;13:498–503. doi: 10.1007/s11605-008-0748-8. [DOI] [PubMed] [Google Scholar]
- 7.Ballal M, David G, Willmott S, Corless DJ, Deakin M, Slavin JP. Conversion after laparoscopic cholecystectomy in England. Surg Endosc. 2009;23:2338–2344. doi: 10.1007/s00464-009-0338-1. [DOI] [PubMed] [Google Scholar]
- 8.Matsui A, Tanaka E, Choi HS, Winer JH, Kianzad V, Gioux S, Laurence RG, Frangioni JV. Real-time intra-operative near-infrared fluorescence identification of the extrahepatic bile ducts using clinically available contrast agents. Surgery. 2010;148:87–95. doi: 10.1016/j.surg.2009.12.004. [DOI] [PMC free article] [PubMed] [Google Scholar]
- 9.Tanaka E, Choi HS, Humblet V, Ohnishi S, Laurence RG, Frangioni JV. Real-time intraoperative assessment of the extrahepatic bile ducts in rats and pigs using invisible near-infrared fluorescent light. Surgery. 2008;144:39–48. doi: 10.1016/j.surg.2008.03.017. [DOI] [PMC free article] [PubMed] [Google Scholar]
- 10.Marakis GN, Pavlidis TE, Ballas K, Aimoniotou E, Psarras K, Karvounaris D, Rafailidis S, Demertzidis H, Sakantamis AK. Major complications during laparoscopic cholecystectomy. Int Surg. 2007;92:142–146. [PubMed] [Google Scholar]
- 11.Fathy O, Zeid MA, Abdallah T, Fouad A, Eleinien AA, el-Hak NG, Eleibiedy G, el-Wahab MA, Sultan A, Anwar N, Ezzat F. Laparoscopic cholecystectomy: a report on 2000 cases. Hepatogastroenterology. 2003;50:967–971. [PubMed] [Google Scholar]
- 12.Balija M, Huis M, Nikolic V, Stulhofer M. Laparoscopic visualization of the cystic artery anatomy. World J Surg. 1999;23:703–707. doi: 10.1007/pl00012372. discussion 707. [DOI] [PubMed] [Google Scholar]
- 13.Stewart L, Robinson TN, Lee CM, Liu K, Whang K, Way LW. Right hepatic artery injury associated with laparoscopic bile duct injury: incidence, mechanism, and consequences. J Gastrointest Surg. 2004;8:523–530. doi: 10.1016/j.gassur.2004.02.010. discussion 530–521. [DOI] [PubMed] [Google Scholar]
- 14.Keus F, de Jong JA, Gooszen HG, van Laarhoven CJ. Laparoscopic versus open cholecystectomy for patients with symptomatic cholecystolithiasis. Cochrane Database Syst Rev. 2006:CD006231. doi: 10.1002/14651858.CD006229. [DOI] [PMC free article] [PubMed] [Google Scholar]
- 15.Gupta N, Solomon H, Fairchild R, Kaminski DL. Management and outcome of patients with combined bile duct and hepatic artery injuries. Arch Surg. 1998;133:176–181. doi: 10.1001/archsurg.133.2.176. [DOI] [PubMed] [Google Scholar]
- 16.Koffron A, Ferrario M, Parsons W, Nemcek A, Saker M, Abecassis M. Failed primary management of iatrogenic biliary injury: incidence and significance of concomitant hepatic arterial disruption. Surgery. 2001;130:722–728. doi: 10.1067/msy.2001.116682. discussion 728–731. [DOI] [PubMed] [Google Scholar]
- 17.Sahani D, Mehta A, Blake M, Prasad S, Harris G, Saini S. Preoperative hepatic vascular evaluation with CT and MR angiography: implications for surgery. Radiographics. 2004;24 :1367–1380. doi: 10.1148/rg.245035224. [DOI] [PubMed] [Google Scholar]
- 18.Catalano OA, Singh AH, Uppot RN, Hahn PF, Ferrone CR, Sahani DV. Vascular and biliary variants in the liver: implications for liver surgery. Radiographics. 2008;28:359–378. doi: 10.1148/rg.282075099. [DOI] [PubMed] [Google Scholar]
- 19.Sens R, Drexhage KH. Fluorescence quantum yield of oxazine and carbazine laser dyes. J Luminesc. 1981;24:709–712. [Google Scholar]
- 20.Benson C, Kues HA. Absorption and fluorescence properties of cyanine dyes. J Chem Eng Data. 1977;22:379–383. [Google Scholar]
- 21.Gioux S, Kianzad V, Ciocan R, Gupta S, Oketokoun R, Frangioni JV. High-power, computer-controlled, light-emitting diode-based light sources for fluorescence imaging and image-guided surgery. Mol Imaging. 2009;8:156–165. [PMC free article] [PubMed] [Google Scholar]
- 22.Troyan SL, Kianzad V, Gibbs-Strauss SL, Gioux S, Matsui A, Oketokoun R, Ngo L, Khamene A, Azar F, Frangioni JV. The FLARE intraoperative near-infrared fluorescence imaging system: a first-in-human clinical trial in breast cancer sentinel lymph node mapping. Ann Surg Oncol. 2009;16:2943–2952. doi: 10.1245/s10434-009-0594-2. [DOI] [PMC free article] [PubMed] [Google Scholar]
- 23.Matsui A, Tanaka E, Choi HS, Kianzad V, Gioux S, Lomnes SJ, Frangioni JV. Real-time, near-infrared, fluorescence-guided identification of the ureters using methylene blue. Surgery. 2010;148:78–86. doi: 10.1016/j.surg.2009.12.003. [DOI] [PMC free article] [PubMed] [Google Scholar]
- 24.Court FG, Wemyss-Holden SA, Morrison CP, Teague BD, Laws PE, Kew J, Dennison AR, Maddern GJ. Segmental nature of the porcine liver and its potential as a model for experimental partial hepatectomy. Br J Surg. 2003;90:440–444. doi: 10.1002/bjs.4053. [DOI] [PubMed] [Google Scholar]
- 25.Ryu JM, Kim DH, Lee MY, Lee SH, Park JH, Yun SP, Jang MW, Kim SH, Rho GJ, Han HJ. Imaging evaluation of the liver using multi-detector row computed tomography in micropigs as potential living liver donors. J Vet Sci. 2009;10:93–98. doi: 10.4142/jvs.2009.10.2.93. [DOI] [PMC free article] [PubMed] [Google Scholar]
- 26.Tanaka E, Chen FY, Flaumenhaft R, Graham GJ, Laurence RG, Frangioni JV. Real-time assessment of cardiac perfusion, coronary angiography, and acute intravascular thrombi using dual-channel near-infrared fluorescence imaging. J Thorac Cardiovasc Surg. 2009;138:133–140. doi: 10.1016/j.jtcvs.2008.09.082. [DOI] [PMC free article] [PubMed] [Google Scholar]


