Abstract
This study was designed to establish and analyze color Doppler and magnetic resonance fusion images of the heart, an approach for simultaneous testing of cardiac pathological alterations, performance, and hemodynamics. Ten volunteers were tested in this study. The echocardiographic images were produced by Philips IE33 system and the magnetic resonance images were generated from Philips 3.0-T system. The fusion application was implemented on MATLAB platform utilizing image processing technology. The fusion image was generated from the following steps: (1) color Doppler blood flow segmentation, (2) image registration of color Doppler and magnetic resonance imaging, and (3) image fusion of different image types. The fusion images of color Doppler blood flow and magnetic resonance images were implemented by MATLAB programming in our laboratory. Images and videos were displayed and saved as AVI and JPG. The present study shows that the method we have developed can be used to fuse color flow Doppler and magnetic resonance images of the heart. We believe that the method has the potential to: fill in information missing from the ultrasound or MRI alone, show structures outside the field of view of the ultrasound through MR imaging, and obtain complementary information through the fusion of the two imaging methods (structure from MRI and function from ultrasound).
Electronic supplementary material
The online version of this article (doi:10.1007/s10278-011-9393-y) contains supplementary material, which is available to authorized users.
Keywords: Biomedical image analysis, Image fusion, Digital image processing, Digital imaging and communications in medicine (DICOM), Cardiac imaging, MR imaging
Introduction
Echocardiography is one of the most commonly used modalities for testing structural and functional alterations in the heart in all of the diagnostic tools in the field of cardiology [1, 2]. Color Doppler blood flow imaging is the primary method for the detection of hemodynamic changes within the heart in clinical practice [3]. However, compared with magnetic resonance imaging (MRI), echocardiography has its limitation for testing structure because of the poor resolution of ultrasound and disadvantage of the field of view (FOV) [4]. Conversely, magnetic resonance imaging is still limited in measuring real-time hemodynamic activities and alterations. The fusion image of color Doppler and magnetic resonance images provides a means to overcome these limitations by displaying both anatomic and hemodynamic information in the moving heart simultaneously. With the aid of computer-based technologies, it becomes possible to fuse images from various methods, including ultrasound and magnetic resonance imaging [5]. Porter et al. [6] reported a method for fusing three-dimensional ultrasound with magnetic resonance image in the liver. Rajpoot et al. [7] presented an automatic two-stage registration and fusion method to integrate multiple single views of real-time three-dimensional echocardiographic images. Rasche et al. [8] demonstrated the feasibility of fusing volumetric ultrasound images with three-dimensional X-ray imaging data for visualization of cardiac morphology, function, and coronary venous drainage. However, little attention has been paid to the fusion of dynamic Doppler information and magnetic resonance images of the heart because of difficulties in image registration for both technologies. The present article would introduce a method for fusing color Doppler images of echocardiography with magnetic resonance images using a MATLAB-based imaging program.
In this report, we will demonstrate that the proposed method permits the fusion of color Doppler blood flow in ultrasound and magnetic resonance images.
Methods
Ten volunteers with stable heart rate were involved in this study. Before the experiment, written informed consent was obtained; this study was performed with the approval of the ethical committee of Shanghai East Hospital. All magnetic resonance images were acquired using a Philips MRI 3.0-T system. Two-dimensional images of the heart were selected in the standard apical view. Magnetic resonance images were recorded in DICOM files with image matrix (256 × 256) and pixel spacing (1.25 × 1.25 mm).
Echocardiographic recordings of the same case were recorded after magnetic resonance scanning. All echocardiographic data were collected from a Philips IE33 ultrasound system equipped with S5-1 (1.0–3.0 MHz) transducer. Two-dimensional images of color Doppler blood flow in the heart were obtained in the standard apical view. The color Doppler recordings were obtained at a frame rate of 8 Hz. The DICOM files of echocardiography were exported from IE33 instrument (image matrix, 800 × 600; pixel spacing, 0.3 × 0.3 mm).
Fusion Algorithms
The process of image fusion was conducted based on a MATLAB program. After importing the DICOM files and setting internal fiducial markers and related parameters, the application fused the Doppler and magnetic resonance images semi-automatically.
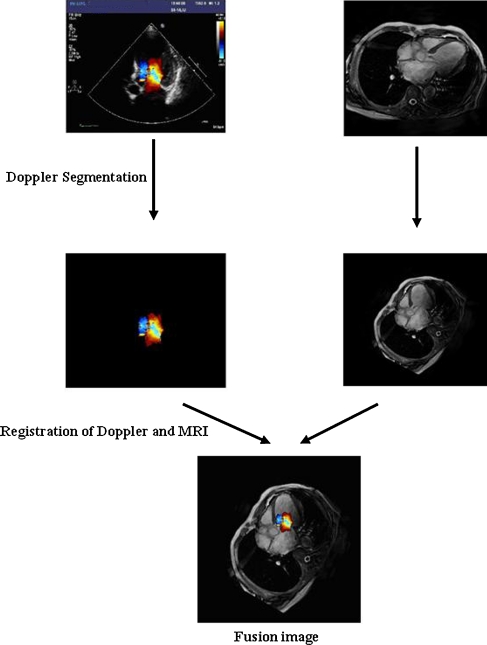
The fusion application process was carried out by the following steps: (1) color Doppler blood flow segmentation, (2) registration of Doppler and magnetic resonance images, and (3) fusion of different image types (Fig. 1).
Fig. 1.
Fusion application process
Doppler Segmentation
The method of color Doppler segmentation was established based on pixel characterization because of the frameless color Doppler blood flow. The segmentation method operates on the basis of the RGB color format. For segmenting the Doppler color range in an RGB image, it is necessary to establish a set of color samples from the standard Doppler color scale which is representative of a range of colors of interest. The mean color of the Doppler image was estimated from color samples. The goal of segmentation was to identify RGB pixels with colors that fall in the specified range. In order to perform this comparison, the Euclidean distance was chosen as measurement for segmentation [9]. The average color was denoted by the RGB column vector “m”. “z” indicates an arbitrary point in a RGB space. “z” is similar to “m” if the distance between them was less than a specified threshold “T”. The Euclidean distance between “z” and “m” was given below:
| 1 |
where the subscripts R, G, and B denote the RGB components of vectors “m” and “z.” The locus of points such that “D < T” is a solid sphere of radius “T.” By definition, points contained within, or on the surface of, the sphere satisfy the specified color criterion, whereas points outside the sphere do not. By coding these two sets of points in the image using black and white colors, a binary and segmented image was produced.
The Doppler color region was divided into two parts: red region and blue region. The green region was excluded because it is unavailable in the Philips IE33 system. We calculated the mean of the each region as the center of color segmentation, setting a threshold and filtering the pixels of echocardiographic images. However, regions of blood flow with velocities beyond the defined range were not segmented because the intensity of high-velocity color pixels exceeded the radius “T.” For the segmentation of high-velocity blood flow regions, we established a pixel module to scan the segmented image. The high-velocity flow pixels were recovered through the pixel module scanning, utilizing the feature that the blood overflow was always inside the blood flow.
Registration of Echocardiography and Magnetic Resonance Images
The registration of echocardiography and magnetic resonance heart image is different from the registration for other types of images. Because of motion during the cardiac cycle, three-dimensional registration is required for image fusion. It is necessary to consider space registration and time registration.
For space registration, two-dimensional magnetic resonance images were selected in the standard apical view. Echocardiographic recordings of the same case were recorded with reference to the two-dimensional magnetic resonance image.
Geometric transformation was used to merge echocardiography and magnetic resonance images for visualization and quantitative comparison. The affine transform was selected as image registration, which was one of the most commonly used forms of spatial transformations. The affine transform can be written in matrix form as below [9]:
| 2 |
This transformation can scale, rotate, or translate a set of points, depending on the values chosen for the elements of “T.”
The matrix and pixel spacing of echocardiography and magnetic resonance images were different (echocardiography: matrix 600 × 800, pixel spacing 0.3 × 0.3 mm; magnetic resonance image: matrix 256 × 256, pixel spacing 1.25 × 1.25 mm). So the first step of space registration was size adjustment. The affine matrix can be written as:
| 3 |
“S x” and “S y” were defined according to the ratio of Doppler and magnetic resonance image, which were both 4.17 in this study.
The second step of space registration is the rotation of a magnetic resonance image in order to match the direction of a selected Doppler blood flow image. The following affine matrix was used for this purpose:
| 4 |
“θ” was defined manually with a MATLAB program using an image processing function. The application reorganizes the pixel matrix according to the angle “θ.”
The last step was image transfer with reference to the fiducial markers based on cardiac and vascular structures. We set the root of mitral valve and the root of aortic valve as internal fiducial markers to align the two types of images. The application was able to transfer the two images automatically according to the distance calculated from the fiducial markers.
For time registration, electrocardiogram was utilized to calculate the frequency of different images. The peak of the R wave was set as the origin of time registration (note that magnetic resonance heart images were also recorded at the peak of the R wave). For the purpose of controlling time accuracy, the frequency of echocardiography and magnetic resonance image was utilized to ensure the presentation of different images synchronously.
Image Registration Accuracy
Time registration accuracy between echocardiography and magnetic resonance heart image has certain intrinsic limitation because Doppler sample volume range is associated with image frequency. When enlarging the Doppler sample volume range, the image frequency would be reduced, and vice versa. The time registration error (TRE) was defined as below:
| 5 |
where HR is the heart rate recorded in DICOM files, N echo and N MR were total frames in their DICOM files, and F echo and F MR were frame numbers selected for registration.
On space registration with fiducial markers, the accuracy was defined as the root mean square error (RMSE) between a set of corresponding point landmarks. In order to determine the quality of a fusion set, we set six corresponding point landmarks between echocardiography and magnetic resonance heart image, which were the anterior part of interventricular septum (IVS), the bulge part of IVS, the end of IVS, the end of aortic valve ring, the root of the anterior mitral valve, and the root of the posterior mitral valve. The points were identified by five clinical experts. The RMSE was computed when the distance of six different landmarks were obtained. The RMSE was defined as below:
| 6 |
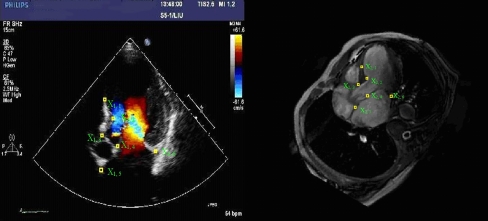
where X 1,i and X 2,i were the coordinates of different landmarks which were displayed in Fig. 2.
Fig. 2.
Coordinates of different landmarks
Fusion of Different Image Types
A color Doppler blood flow image can be represented with a three-dimensional matrix based on the features of RGB images, while a magnetic resonance image can be represented with a two-dimensional matrix based on the features of gray level images. To combine a RGB image with a gray level image, the two-dimensional matrix should be extended to the three-dimensional matrix. We extended the gray image into a three-dimensional matrix and adjusted the type of pixel following the RGB matrix format and the RGB pixel character, and replace the MRI pixels with Doppler pixels. Every fused image can be saved in the Audio Video Interleaved (AVI) format. Dynamic fused video could provide a more intuitive method for the observation of heart anatomy and monitoring cardiac function.
Results
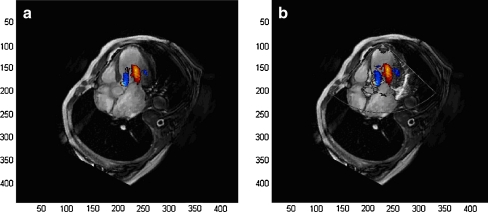
In this investigation, we fused color Doppler blood flow images of the left ventricle into magnetic resonance heart images using the mitral annular root and the root of aortic valve as the internal fiducial markers. Figure 3 and Table 1 displayed the example of one volunteer. Figure 4 displayed the registration error of a total of ten volunteers. Figure 3a showed an image derived by fusing a color Doppler image into a magnetic resonance image. The image fusion approach extended the FOV of echocardiography, improved the image quality compared with that of echocardiography alone, and provided a more hemodynamic information in comparison with that of magnetic resonance image.
Fig. 3.
a Fusion image with blood flow patterns by color Doppler and cardiac structure by magnetic resonance image. b Fusion image of cardiac structure produced by echocardiography and magnetic resonance image
Table 1.
TRE and corresponding distance of six point landmarks over eight frames of one volunteer
| Fusion set | TRE (ms) | Anterior part of IVS (mm) | Bulge part of IVS (mm) | End of IVS (mm) | End of aortic valve ring (mm) | Root of anterior mitral valve (mm) | Root of posterior mitral valve (mm) | Mean of different landmarks (mm) |
|---|---|---|---|---|---|---|---|---|
| Frame 1 | 9.43 | 1.8974 | 2.8284 | 3.1247 | 2.6532 | 1.7856 | 3.4126 | |
| Frame 2 | 18.82 | 2.9204 | 3.5120 | 3.2426 | 3.5231 | 2.8284 | 3.6238 | |
| Frame 3 | 9.5 | 2.2361 | 2.1623 | 2.2361 | 2.2314 | 1.9987 | 2.6874 | |
| Frame 4 | 0.09 | 1.1862 | 2.1424 | 2.5345 | 2.1569 | 1.2142 | 1.6345 | |
| Frame 5 | 9.32 | 1.585 | 3.3611 | 3.1623 | 3.0329 | 3.1321 | 2.9643 | |
| Frame 6 | 18.73 | 2.7360 | 2.1145 | 3.5896 | 2.9574 | 3.2256 | 3.3974 | |
| Frame 7 | 9.59 | 1.6835 | 2.3350 | 3.2584 | 3.1623 | 2.7145 | 2.5587 | |
| Frame 8 | 0.18 | 0.8251 | 1.4142 | 2.0125 | 2.2458 | 2.2419 | 1.4265 | |
| MEAN | 9.46 | 1.8929 | 2.4837 | 2.8951 | 2.7454 | 2.3926 | 2.7132 | 2.5205 |
| SD | 7.05 | 0.7194 | 0.7039 | 0.5609 | 0.5035 | 0.7040 | 0.8188 | 0.6684 |
| RMSE | 2.0089 | 2.5695 | 2.9423 | 2.7855 | 2.4816 | 2.8192 | 2.6012 ± 0.3358 |
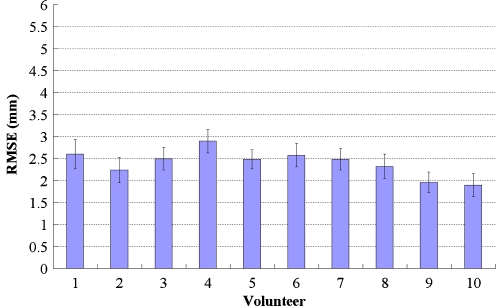
Fig. 4.
Plot showed the mean registration error for each dataset. Error bars showed one standard deviation calculated over different observers and anatomical landmarks. Subjects 1–10 were volunteers
Figure 3b showed the fusion image of cardiac structure produced by echocardiography and magnetic resonance heart image. The cardiac structure by echocardiography could help ensure the accuracy of image registration and the position of Doppler blood flow images.
Table 1 showed the TRE and the mean value over eight frames of one volunteer. The average TRE was 9.46 ± 7.05 ms in this case. This is because a large Doppler sample volume range limited the image frequency. However, in other investigations, the average TRE was below 2.16 ms when the image frame was controlled above 30 frames in one cardiac cycle, in which MRI was regularly recorded at 30 frames within one cardiac cycle.
In space registration, the corresponding distance and RMSE of the identified landmarks between echocardiography and magnetic resonance image data as registration accuracy were shown at Table 1. The average error over eight frames was 2.60 ± 0.34 mm.
Our average error among ten volunteers was 2.40 ± 0.26 mm. The means and standard deviations of these values were shown in Fig. 4. In our analysis, this error did not significantly influence the quality of fusion images.
Discussion
The fusion of color Doppler and magnetic resonance images in the present study is a novel method for cardiac diagnosis which displays the cardiac structure with high resolution and shows blood flow patterns in the heart simultaneously. In comparison with echocardiography, a fusion image extended the field of view with high image quality and filled in missing information. A fusion image provides cardiac hemodynamic information by color Doppler and more detail of the cardiac structure as the magnetic resonance images. The advantage of the image fusion is that it provides cardiac images with the complementary information that might not be available by echocardiography or magnetic resonance images alone.
The limitation of our study was that we assumed the echocardiography was acquired in the same plane as the magnetic resonance image. For the purpose of minimum registration error, magnetic resonance image was scanned first and the image was shown as a template when echocardiography was examined. Now, image fusion has become one of the most frequently applied technologies in the fields of surgery navigation [10–12], radiation therapy [13–15], and liver tumor ablation [16–18]. We plan to purchase a GE released GPS-like technology, which was claimed to track and mark a patient’s anatomy during an ultrasound exam, for further research.
Conclusion
This investigation was aimed at the development of a model to fuse Doppler blood flow and magnetic resonance images with complementary information on cardiac structure and hemodynamics. We hope that the fusion of Doppler and magnetic resonance images would get more attention for the purpose of more possible application.
Electronic Supplementary Materials
AVI Files:
AVI files showing fusion of Doppler are included as supplemental data online. These files were created using MATLAB. If they will not play, we recommend downloading the Storm Codec to play them. The free version of Storm Codec should be sufficient.
(AVI 102 kb)
(AVI 122 kb)
Acknowledgments
The study was financially supported by the innovative technology projects of Pudong New Area technology development foundation grant no. PKJ2010-Y16.
Open Access
This article is distributed under the terms of the Creative Commons Attribution Noncommercial License which permits any noncommercial use, distribution, and reproduction in any medium, provided the original author(s) and source are credited.
References
- 1.Burri H, Lerch R. Utility of echocardiography for tailoring cardiac resynchronisation therapy. Kardiovaskuläre Medizin. 2006;9:188–196. [Google Scholar]
- 2.Cerqueira MD, Weissman NJ, Dilsizian V, et al. Standardized myocardial segmentation and nomenclature for tomographic imaging of the heart. Circulation. 2002;105:539–542. doi: 10.1161/hc0402.102975. [DOI] [PubMed] [Google Scholar]
- 3.Hunt AC, Chow Sl, Escaned J, et al. Evaluation of a theoretical Doppler index to noninvasively estimate peak dP/dt using continuous wave Doppler ultrasound of ascending aortic flow in man. Cathet Cardiovasc Diagn. 1991;23:219–222. doi: 10.1002/ccd.1810230317. [DOI] [PubMed] [Google Scholar]
- 4.Okada M, Imai Y, Kim T, et al. Comparison of enhancement patterns of histologically confirmed hepatocellular carcinoma between gadoxetate- and ferucarbotran-enhanced magnetic resonance imaging. J Magn Reson Imaging. 2010;32:903–913. doi: 10.1002/jmri.22333. [DOI] [PubMed] [Google Scholar]
- 5.Cimmino MA, Grassi W. What is new in ultrasound and magnetic resonance imaging for musculoskeletal disorders? Clin Rheumatol. 2008;22:1141–1148. doi: 10.1016/j.berh.2008.09.012. [DOI] [PubMed] [Google Scholar]
- 6.Porter BC, Rubens DJ, Strang JG, et al. Three-dimensional registration and fusion of ultrasound and MRI using major vessels as fiducial markers. IEEE Trans Med Imag. 2001;20:354–359. doi: 10.1109/42.921484. [DOI] [PubMed] [Google Scholar]
- 7.Rajpoot K, Noble JA, Grau V, et al. Multiview RT3D echocardiography image fusion. Functional imaging and modeling of the heart. Lect Note Comput Sci. 2009;5528:134–143. doi: 10.1007/978-3-642-01932-6_15. [DOI] [Google Scholar]
- 8.Rasche V, Mansour M, Reddy V, et al. Fusion of three-dimensional X-ray angiography and three-dimensional echocardiography. Int J Comput Assist Radiol Surg. 2008;2:293–303. doi: 10.1007/s11548-007-0142-0. [DOI] [Google Scholar]
- 9.Gonzalez RC. Digital image processing using MATLAB. London: Prentice Hall; 2003. pp. 134–178. [Google Scholar]
- 10.Amin D, Kanade T, DiGioia A, et al. Ultrasound registration of the bone surface for surgical navigation. Comput Aided Surg. 2003;8:1–16. doi: 10.3109/10929080309146097. [DOI] [PubMed] [Google Scholar]
- 11.Hata N, Dohi T, Iseki H, et al. Development of a frameless and armless stereotactic neuronavigation system with ultrasonographic registration. Neurosurgery. 1997;41:608–614. doi: 10.1097/00006123-199709000-00020. [DOI] [PubMed] [Google Scholar]
- 12.Lindseth F, Kaspersen JH, Ommedal S, et al. Multimodal image fusion in ultrasound-based neuronavigation: improving overview and interpretation by integrating preoperative MRI with intraoperative 3D ultrasound. Comput Aided Surg. 2003;8:49–69. doi: 10.3109/10929080309146040. [DOI] [PubMed] [Google Scholar]
- 13.Wein W, Roper B, Navab N. Automatic registration and fusion of ultrasound with CT for radiotherapy. Med Image Comput Comput Assist Interv. 2005;8:303–311. doi: 10.1007/11566489_38. [DOI] [PubMed] [Google Scholar]
- 14.Fuller DB, Jin H, Koziol JA, et al. CT-ultrasound fusion prostate brachytherapy: a dynamic dosimetry feedback and improvement method. A report of 54 consecutive cases. Brachytherapy. 2005;4:207–216. doi: 10.1016/j.brachy.2005.07.005. [DOI] [PubMed] [Google Scholar]
- 15.Julow J. Image fusion guided brachytherapy of brain tumors. Ideggyogy Sz. 2010;63:164–169. [PubMed] [Google Scholar]
- 16.Huo YM, Chen YZ. Research on HIFU technology. Acoust Technol. 2000;19:39–45. [Google Scholar]
- 17.Penney G, Blackall J, Hamady M, et al. Registration of freehand 3D ultrasound and magnetic resonance liver images. Med Image Anal. 2004;8:81–91. doi: 10.1016/j.media.2003.07.003. [DOI] [PubMed] [Google Scholar]
- 18.Jung EM, Schreyer AG, Schacherer D, et al. New real-time image fusion technique for characterization of tumor vascularisation and tumor perfusion of liver tumors with contrast-enhanced ultrasound, spiral CT or MRI: first results. Clin Hemorheol Microcirc. 2009;43:57–69. doi: 10.3233/CH-2009-1221. [DOI] [PubMed] [Google Scholar]
Associated Data
This section collects any data citations, data availability statements, or supplementary materials included in this article.
Supplementary Materials
(AVI 102 kb)
(AVI 122 kb)


