

Abstract
Protein assembly at the air-water interface (AWI) occurs naturally in many biological processes, and provides a method for creating biomaterials. However, the factors that control protein self-assembly at the AWI, and the dynamic processes that occur during adsorption are still under-explored. Using fluorescence microscopy, we investigated assembly at the AWI of a model protein, human serum albumin minimally labeled with Texas Red fluorophore. Static and dynamic information was obtained under low subphase concentrations. By varying solution protein concentration, ionic strength, and redox state, the microstructure of protein assembly at the AWI was changed accordingly. Addition of pluronic surfactant caused phase segregation to occur at the AWI, with fluid surfactant domains and more rigid protein domains revealed by fluorescence recovery after photobleaching experiments. Protein domains were observed to coalesce during this competitive adsorption process.
1. INTRODUCTION
Protein behavior at the air-water interface (AWI) is well known to be important in food science for enhancing foam stability and in protein crystallization for guiding ordered assembly.1,2 It is also relevant in many biotechnology applications, for example, how protein solutions behave on flat surfaces and in fluidic devices, where protein adsorption can be significant at both the solid-water and air-water interfaces.3 In medicine, the competitive adsorption between lung surfactant and serum protein on the aqueous alveolar lining layer has been investigated extensively for its role in acute respiratory distress syndrome.4,5 It is also significant in gas embolism that within blood, gas bubbles can recruit proteins to their surface, and result in reduced blood flow and oxygen delivery to the affected area (i.e., embolism), as well as clotting.6 Intervention or manipulation of such processes requires a greater understanding of the assemblies that proteins can form at the AWI.
From another perspective, the AWI is a unique tool to guide proteins as small building units into larger, self-assembled structures. Proteins are naturally occurring biopolymers with unsymmetrical distribution of buried and solvent-exposed active sites, electrostatic charges and hydrophobic/hydrophilic residues. These features, combined with geometric constraints, dictate the structures of folded proteins and their larger assemblies. A strategy in assembling complex biological or synthetic systems is to promote interactions in just one or two dimensions. Liquid interfaces are particularly useful in this regard, based on the anisotropic forces residing therein and two-dimensional spatial confinement.7-9 Besides the special characteristics of liquid interfaces, factors that commonly control self-assembly are the chemical and structural complementarity of the building blocks.10 For macromolecules such as proteins, the active site, geometric structure, electrostatic and hydrophobic interactions are greatly affected by the surrounding solvent molecules and other solutes.11,12 Thus, solution conditions provide a convenient handle for controlling protein assembly at the AWI.
Previous tensiometry, reflectometry and ellipsometry studies explored the change in surface excess and structural conformation of proteins at the AWI in relation to solution conditions such as subphase concentration, pH and ionic strength.13-16 These techniques provide ensemble-averaged properties of adsorbed proteins over a macroscopic scale. To study assembled structures at the AWI on the nanometer-to-micron scale, imaging techniques such as atomic force microscopy (AFM), Brewster angle microscopy (BAM) and fluorescence microscopy have been applied.17-19 AFM affords nanometer spatial resolution, but involves transferring interfacial films onto a solid surface, which leads to loss of structural fidelity and temporal resolution.17 BAM coupled with Langmuir trough is a widely used in situ method, but offers lower spatial resolution (2 μm) than many diffraction-limited optical imaging techniques, and offers little kinetic information.18,20 Earlier studies by Gluck et al. on polysaccharide adsorption at the AWI showed the potential of fluorescence microscopy to serve as a facile in situ imaging tool for studying macromolecular self-assembly at the AWI.21 By this technique, Powers et al. discovered medium-dependent micron-size phase domains of an amphiphilic peptide self-assembled at the AWI.22 The observations made in this landmark study have not yet been generalized to protein systems. Here, we demonstrate for the first time the ability to control the microstructure of protein self-assembly at the AWI through systematic variation of solution conditions.
In the present study, human serum albumin labeled with Texas Red (HSA-TR) was used as a model protein, and the microstructure of its self-assembly was studied by in situ fluorescence microscopy under various solution conditions. Human serum albumin (HSA) provides a useful model protein system as its biophysical properties have been very well studied, in solution and at the AWI.16,23 Its relevance comes from the fact that HSA is the most abundant protein (3.5-5.0 g/dL) in human blood plasma, where it serves to maintain plasma oncotic pressure and transport ligands. When gas emboli are introduced into blood vessels, plasma proteins such as HSA adsorb and aggregate at the gas-blood interface.24 These interfacial protein layers are suspected to affect the bubble adhesion to the endothelial surface and initiate blood clotting through interaction with macromolecules on the endothelium or platelet surfaces.25
HSA is composed of a single polypeptide chain with 585 amino acids, which include 35 cysteines and 59 lysines. Thirty-four cysteines form 17 intramolecular disulfide bridges while the single reactive Cys34 is extremely sensitive to redox state.23,26 X-ray crystallography confirmed that HSA has alpha-helical secondary structure, and identified a heart-shaped or equilateral triangular tertiary structure under physiological conditions with 80 Å on a side and 30 Å in thickness.23 Reflectometry studies also found the thickness of a serum albumin layer at the interface to be 30–40 Å, but the proteins were approximated as an ellipsoid with long axis of 140 Å parallel to the interface, and a perpendicular short axis of 40 Å.16 Spectroscopic and rheological methods have previously identified a single-layer HSA viscoelastic film at the AWI, with the protein retaining its secondary structure.16,27,28
The current study applied in situ fluorescence microscopy to study protein assembly at the AWI in a small imaging chamber with ~10 μL solution, while limiting competitive protein adsorption at the liquid-solid interface. A stable interface was formed, with negligible evaporation, which allowed both static and dynamic information of protein behavior at the AWI to be obtained with sub-micron spatial resolution and on time scales of milliseconds to hours. Our results revealed micro-scale protein assemblies formed at the AWI and highlighted the role of solution conditions in controlling the assembled structures. Kinetic transitions of phase separation at the AWI were also observed.
2. EXPERIMENTAL SECTION
General Reagents
For all steps, deionized water (DI water, Mar Cor Premium Grade Mixed Bed Service Deionization, 18.2 megohm-cm resistivity at 25 °C) was used. The phosphate-buffered saline (PBS) solution used for fluorescence microscopy was made by dissolving appropriate amount of NaH2PO4 and NaN3 in DI water and then adjusting to pH 7.2 with 1 M HCl, the final concentration is 10 mM of phosphate and 30 mM of NaN3 throughout the study. The ionic strength of PBS was adjusted by addition of NaCl. Pluronic F-127 (Invitrogen, MW~12500) was diluted with PBS to 0.010 mg/mL as stock solution. Dithiothreitol (DTT) was purchased from Fisher Scientific.
Imaging Protein Assembly at the AWI by Fluorescence Microscopy
As shown in Figure 1A, HSA-TR was imaged in a specially designed, sealed chamber where the protein aqueous phase (10 μL in volume, 100-200 μm in thickness) coexisted with a layer of air, also 100-200 μm thick. The chamber was assembled from polydimethylsiloxane and cover glass modified with polyethylene glycol, MW 5000, in order to reduce the competitive adsorption of proteins to the solid-liquid interfaces (see Sample Chamber and Surface Modification and Figure S1 in Supporting Information). The AWI formed in this chamber was parallel to the XY plane formed by the microscope stage. This facilitated imaging of the interface, as compared to previous attempts to image rounded droplets.22,29 Images were collected by focusing either at the interface (called “XY plane images”) or scanning perpendicular to the interface with a step size of 0.1 μm/step (called “XZ plane images”). Confocal images were captured using an Olympus IX81 inverted microscope. Epi-fluorescence images were captured by a hyperspectral CCD (CRi Nuance FX) camera coupled to the Olympus IX81 system. The objective lens (40X, water immersion, 1.15 NA) imaged the sample solution from below by exciting the dyes with a 543 nm laser or by a mercury lamp with excitation filter of 530-550 nm bandpass. Emission was collected in the 575-655 nm range. Fluorescence recovery after photobleaching (FRAP) experiments were carried out on the same confocal microscope with an Olympus SIM scanner unit. A 351 nm laser at 100% power was used to photobleach small regions of the protein layer at the AWI for 20 sec. The confocal images of the regions were captured before, during and after photobleaching using a 543 nm laser with dwell time of 2 μs/pixel. Images were analyzed using ImageJ software.30
Figure 1.

(A) Sample chamber and inverted microscope setup. (B-G) Confocal images of HSA-TR in PBS at pH = 7.2, ionic strength = 193 mM, at the AWI. (B, C) XY-plane images of HSA-TR (0.050 mg/mL) or (D, E) HSA-TR (0.025 mg/mL). Images (C) and (E) use 4X optical zoom. XZ-plane image across the AWI of (F) HSA-TR (0.050 mg/mL) or (G) HSA-TR (0.025 mg/mL). Scale bar: 20 μm.
Protein Labeling
Commercially available HSA (Sigma-Aldrich) was labeled with amine-reactive fluorophore Texas Red-X succinimidyl ester (Invitrogen). Texas Red-X was first dissolved in dimethylformamide (10 mg/mL), then a small volume of this concentrated dye solution was slowly added while stirring into the aqueous protein solution (2 mg/mL HSA in in 0.1 M NaHCO3 buffer, pH 8.3). The molar ratio of dye to protein was 10 to 1 upon mixing. The reaction solution was covered with aluminum foil and stirred continuously for 1 h at room temperature. Then the unreacted dyes were removed by running the reaction solution through a 10-DG column (Bio-Rad). The labeled proteins were eluted with PBS, and further concentrated and purified by 3 kDa cutoff molecular weight centrifugal filter units (Millipore) at 9 krpm for 30 min at 4 °C and dialyzed by 10 kDa dialysis cassettes (Thermo Scientific) against 1 L of 10 mM phosphate buffer for 1 week. The final concentration of labeled protein was determined by Lowry assay (Thermo Scientific) using bovine serum albumin (BSA, Thermo Scientific) as the standard. UV-Vis spectroscopy and MALDI-TOF mass spectrometry showed that labeled dye-to-protein ratio was 1.3 and 1.5, respectively (see Dye-to-Protein Ratio Measurements and Figure S2 in Supporting Information). The product solution was aliquoted and stored under −20 °C for further use.
Comparison of dye-labeled and unlabeled proteins
HSA and HSA-TR were compared by circular dichroism (CD) spectroscopy and surface pressure measurement. The protein layers formed by the labeled or unlabeled proteins at the AWI were transferred to mica surface and the height was measured using tapping mode AFM (Digital Instruments) and processed by Nanoscope IIIa software (v. 5.12; Digital Instruments). CD measurements were carried out on a Chirascan CD spectrometer with a Peltier temperature controller. HSA and HSA-TR were diluted to 0.10 mg/mL with 10 mM NaCl in 10 mM phosphate buffer (pH = 7.2) then transferred to a 0.1 cm pathlength cuvette. Far-UV CD spectra of HSA and HSA-TR were collected at 25 °C over the wavelength range of 190-260 nm at scan rate of 0.5 nm/s with a slit bandwidth of 1.0 nm. Thermal denaturation curves were recorded between 25-95 °C with a 2 °C increase and 120 s equilibration time for each step. Surface pressure was measured using a MicroTroughX Langmuir trough with a wire probe microbalance (Kibron, Inc.). HSA or HSA-TR (0.10 mg/mL) in 10 mM PBS was pipetted into the microtrough. Surface pressure was recorded over 1 h after immediate AWI formation. Then the layer at the AWI was transferred onto a freshly cleaved mica surface using the Langmuir-Schaefer technique via a Kibron Microtrough S controller.31 A rinsing step was performed with DI water to wash away excess salt on the sample surface. The sample was left drying in air before being studied by AFM under tapping mode in air using Ultrasharp cantilevers (NSC16, MikroMasch). AFM images were analyzed using WSxM software (Nanotec) to determine film thickness.32
3. RESULTS AND DISCUSSION
Comparison of HSA-TR and wild-type HSA by CD spectroscopy (see Circular Dichroism Spectroscopy and Figure S3 in Supporting Information) and surface pressure measurement (Figure S4) indicated that dye labeling only slightly perturbed the secondary structure and hydrophobicity of HSA. By Langmuir-Schaefer technique and AFM, we demonstrated that the protein film formed at the AWI is transferable to a mica surface, and is similarly one protein layer thick (~3 nm) for both HSA-TR and HSA (Figure S5). This is in good agreement with a previous neutron reflectivity study, suggesting a monolayer.16 Thus, minimally labeled, near-native HSA provides a useful model protein sample for studying assembly at the AWI by fluorescence microscopy.
In Figure 1, HSA-TR was dissolved in PBS (ionic strength = 193 mM), and imaged in the small chamber setup as described earlier (Figure 1A). When the concentration of HSA-TR ([HSA-TR]) was greater than or equal to 0.050 mg/mL, a uniform fluorescent layer was observed by confocal microscopy as shown in Figure 1B. At optical resolution of ~0.2 μm, the 4X zoom image (Figure 1C) showed no particular structure at the interfacial layer. However, when [HSA-TR] was less than or equal to 0.025 mg/mL, highly heterogeneous structure at the interface was observed as shown in Figure 1D. The zoomed-in image (Figure 1E) showed HSA-TR assembled into fractal structures of micrometer size. XZ-plane images further confirmed the different structures, where a fluorescent layer with uniform thickness was observed in Figure 1F, while a discontinuous fluorescent layer was observed in Figure 1G. Our results implied a surface-saturating bulk-solution concentration (CBsat) which fell between 0.025 mg/mL and 0.050 mg/mL under the condition of ionic strength at 193 mM in PBS. Below CBsat, the adsorbed proteins could not cover the AWI entirely, thus allowing the formation of protein domains at the interface. Previous reports using tensiometry and ellipsometry found that the critical concentration of BSA for covering the AWI is between 10−2 and 10−1 mg/mL,13 which matches well with our results.
Although researchers in the field of protein adsorption generally accept the concept of CBsat,13,33 very few studies have revealed the microstructure of assembled proteins at concentrations below CBsat. Powers et al. first reported observation of phase domains formed by an amphiphilic peptide at the AWI.22 A recent study by Lee et al.34 using microrheology suggested that mechanical heterogeneity was present in a β-lactoglobulin layer at the AWI at a comparably low concentration. In our previous study, a discontinuous fluorescent layer was also observed at the AWI of human fibrinogen labeled with Oregon Green, where the protein was dissolved in similar buffer conditions at 0.01 mg/mL.29 It was predicted by early two-dimensional lattice-based simulations that fractal networks could be formed by diffusion-limited aggregation at low concentration.35 The XY-plane images at the AWI (Figure 1E), confirm the existence of fractal assembly at the AWI and a heterogeneous protein layer at the AWI at low subphase concentration.
We then varied the ionic strength and redox state of the solution and monitored the protein assemblies formed at the AWI. After pipetting solutions into the chamber, interfaces were left to age for 1 h before being imaged. A sample of 0.010 mg/mL HSA-TR in PBS (ionic strength = 53 mM) exhibited both fractal assembly (Figure 2A) and interconnected “Swiss cheese” structures (Figure 2B) at different locations at the interface. A Z-stack of XY plane images showed a high-resolution three-dimensional (3D) image of the interfacial protein layer (Figure 2C) under the same conditions. The 3D image is an overlay of multiple XY plane images of size 45.0 μm × 45.0 μm, which were collected along the Z axis above and below the AWI, 10 μm in each direction (200 × 0.1 μm steps). This confirmed the “Swiss cheese” structure at the interface and showed almost no fluorescent signal from the subphase. Although the optical resolution along the Z-axis is ~2 μm for the confocal image, which is much larger than the estimated protein layer thickness (30-40 Å), the Z-stack image clearly indicated that protein domains only form at the AWI and assembly in the Z-direction was constrained compared to the hundreds-of-micron size domains formed in the XY plane.
Figure 2.
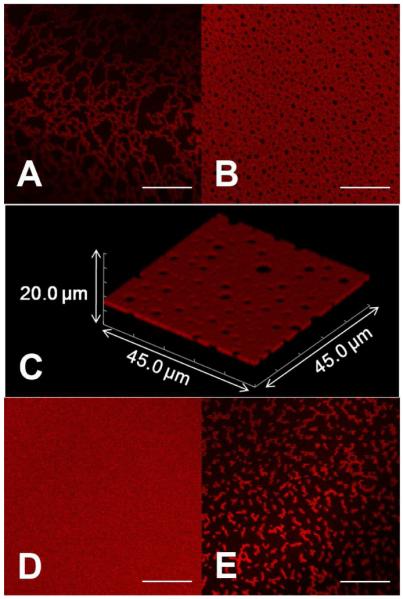
Morphology of protein assembly varied with ionic strength and addition of reducing agent. Self-assembly of HSA-TR (0.01 mg/mL) at the AWI in (A, B) PBS, pH = 7.2, ionic strength = 53 mM, (C) Rendered Z-stack of confocal images corresponds to (B) in the scanned volume of 45.0 μm × 45.0 μm × 20.0 μm. (D) PBS, pH = 7.2, ionic strength = 530 mM, (E) PBS with 30 mM DTT, pH =7.2, ionic strength = 53 mM. Scale bar: 20 μm.
Keeping the protein concentration constant, we increased the ionic strength of buffer to 530 mM. After 1 h aging time, we observed a homogeneous fluorescent layer (Figure 2D), indicating an increased surface excess and shorter equilibration time. And in samples that had 30 mM DTT (Figure 2E) in the buffer, small fractal structures were observed (Figure 2E), indicating a weaker interaction between adsorbed proteins. We also studied the kinetics of interfacial layer formation when HSA-TR was dissolved in PBS, at high ionic strength (530 mM). A clear transition from crowded fractals (Figure 3A) to “Swiss cheese” structure (Figure 3B), and finally to a homogeneous fluorescent layer (Figure 3C) was observed. In about 30 min, the AWI achieved equilibrium to form a homogeneous fluorescent layer. A recent study by Dhar et al. found a dramatic increase of surface viscosity over time in a BSA layer, and deduced a change in the organized structure.36 Our study directly showed the morphological transition from fractals to a homogeneous, organized layer, which could serve to explain the observed increase in resistance to shear.
Figure 3.
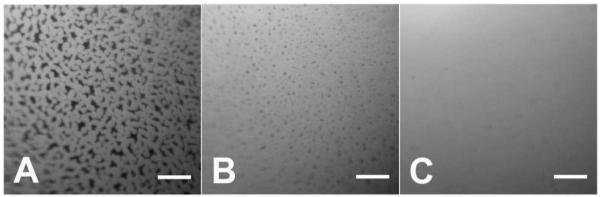
Epi-fluorescence images showing transition of heterogeneous domains into homogeneous layer. C(HSA-TR) = 0.01 mg/mL, in PBS, pH = 7.2, ionic strength = 530 mM. (A) 3 min, (B) 8 min, (C) 36 min after protein solution introduced into chamber. Scale bar: 50 μm.
Our results indicated that solution conditions can modulate the structure of protein self-assembly. The isoelectric point of HSA is around 4.7.23 Thus, at pH 7.2, HSA-TR is negatively charged. Electrostatic repulsion strongly affects the aggregation of HSA-TR at the AWI, leading to a low packing efficiency as shown in Figures 2A and 2B. The co-existence of fractal and “Swiss cheese” structures indicates a non-equilibrium state, which is due to slow adsorption of proteins from the subphase hindered by the repulsive force from charged proteins already present at the interface. At higher ionic strength, where electrostatic repulsion between charged protein molecules is more effectively shielded, HSA-TR adsorbs faster to the interface and is able to pack more closely, thus forming a more uniform layer. As shown in Figures 2D and 3C, full coverage of the AWI was achieved below CBsat. The value of CBsat between 0.025 mg/mL and 0.050 mg/mL was determined at a lower ionic strength (193 mM) after 1 h of adsorption time. At higher ionic strength (530 mM), the adsorption of bulk solution protein to the AWI was faster due to less repulsion between adsorbed proteins and proteins from the bulk. In addition, the packing of protein molecules at the interface was more efficient, thus higher protein coverage was achieved.
It has been reported that proteins adsorbed at the AWI can form intermolecular disulfide bonds, which stabilize the protein network and enhance the elasticity of the adsorbed layer.37 HSA has one reactive cysteine, Cys34, which could readily form a disulfide bond with adjacent proteins at the AWI. And post adsorption conformation change could result in the breaking of intramolecular disulfide bonds, providing more reactive sites for the formation of intermolecular disulfide bonds. Reducing agents such as DTT inhibit the formation of intermolecular disulfide bonds, thus only small aggregates remain, which are presumably held together by hydrophobic interactions. Vogler et al. have applied interfacial rheology to study HSA at the AWI, and found that adsorbed layers exhibit both viscous and elastic properties.27 Disulfide bond formation supports the hypothesis that elasticity arises from a network of intermolecular interactions. Interestingly, microrheology studies with BSA identified a primarily viscous protein film, without strong intermolecular-bond formation.36 Thus, the role of protein disulfide bonds at the AWI is likely to vary greatly across different protein systems.
Finally, the FDA-approved surfactant F-127 was added to the HSA-TR solution to change the hydrophobic interactions between adsorbed species at the AWI. Hydrophobic interaction causes the assembly or aggregation of hydrophobic units in proteins, which reduces the solvation energy.38 In protein assembly, the hydrophobic patches of multiple protein molecules tend to cluster together to exclude water from their surface, thus increasing the entropy of the system.39 When a more hydrophobic surfactant is added, it competes with the protein-protein hydrophobic interaction. Surfactants are known to interact with proteins at the AWI to reduce significantly the surface tension and change the rheological behavior of the surface layer.40 It is proposed that surfactants displace proteins heterogeneously from the AWI, as described by an “orogenic” model from previous AFM studies by Morris et al.19 However, direct proof from in situ measurements has only been provided by BAM studies,18 and aspects of dynamic transitions remain under-explored.
By our in situ fluorescence microscopy methods, we found regions with stronger and weaker fluorescence intensity at the AWI of the HSA-TR/F-127 mixture, suggesting that phase segregation had occurred. Proteins form viscoelastic networks at the AWI, causing the protein to have molecular mobility two orders of magnitude smaller than that of protein-surfactant mixtures.40 Thus, we expect that the fluorescence recovery rate of protein-rich regions should be much slower than for surfactant-rich regions. To test this hypothesis, we conducted a FRAP experiment to assess the mobility of the interfacial layer with an HSA-TR/F-127 solution of HSA-TR at 0.10 mg/mL and F-127 at 0.0050 mg/mL. Two circular regions in strongly fluorescent and weakly fluorescent regions were bleached simultaneously with near-UV laser beam for 20 s. Images were taken both before and after bleaching using an attenuated 543 nm laser as excitation source. Ninety seconds after irradiation, the bleached region on the upper-left side became smaller, and after 25 min, the intensity almost fully recovered, while the bleached region on the lower-right side did not change shape or intensity over time (Figure 4). We thus conclude that the large difference in the intensity recovery rate indicates segregation of “protein-rich” and “surfactant-rich” regions at the interface. The regions with stronger fluorescence intensity are mostly composed of HSA-TR, while the regions with weaker fluorescence intensity are composed of HSA-TR mixed with F-127. Proteins in the surfactant-rich region are separated by surfactant molecules and more free to diffuse, making the lateral mobility of HSA-TR much higher than in the protein-rich region. However, mass transport in the surfactant-rich domain is not homogeneous, indicated by the change of shape of the bleached region during fluorescence recovery. Combined with appropriate analysis methods of multiple diffusion processes, the FRAP experiments have the potential to determine the distribution of diffusion coefficients of protein molecules at the AWI.
Figure 4.
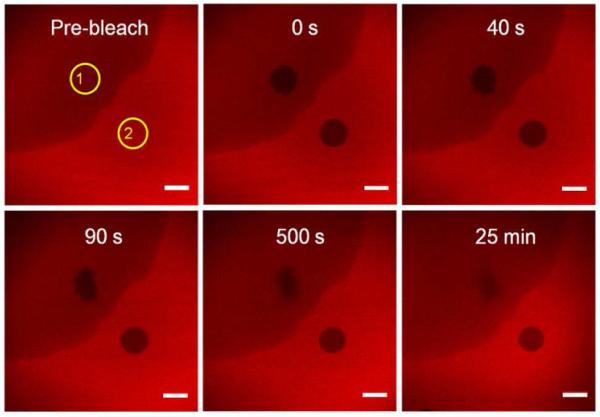
Fluorescence recovery after photobleaching of the interfacial layer. ROIs (yellow circles) are the selected photobleached areas. ROI-1 is in surfactant-rich domain, ROI-2 is in HSA-TR-rich domain. The initial subphase concentration was [HSA-TR] = 0.10 mg/mL, [F-127] = 0.0050 mg/mL. Scale bar: 20 μm.
We found that in the HSA-TR/F-127 mixtures, the protein-rich regions exhibited time-dependent morphological changes, which motivated us to study this dynamic phenomenon in greater detail. The results shown in Figure 5 are images taken by focusing at the AWI with HSA-TR (0.50 mg/mL) mixed with F-127 (0.015 mg/mL). Figure 5A shows three images focused at the same region from 35 min to 60 min after pipetting solution into the chamber. Protein islands in small circular shapes with areas of 10-100 μm2 were seen. The region of interest (ROI, indicated by yellow boxes in Figure 5) highlight some interesting observations: In ROI-1, small protein islands coalesced with surrounding protein islands to form a larger island at 50 min compared to the image at 35 min. In ROI-2 small black holes could be seen starting from 50 min, indicating F-127 replaced HSA-TR at these spots and formed cavities inside the protein-rich regions. In ROI-3, movement of the frontier of surfactant-rich region could be observed. It is evident that as time elapsed, the surfactant-rich regions continuously expanded. And in ROI-4, small protein islands merged into mesh-like networks.
Figure 5.
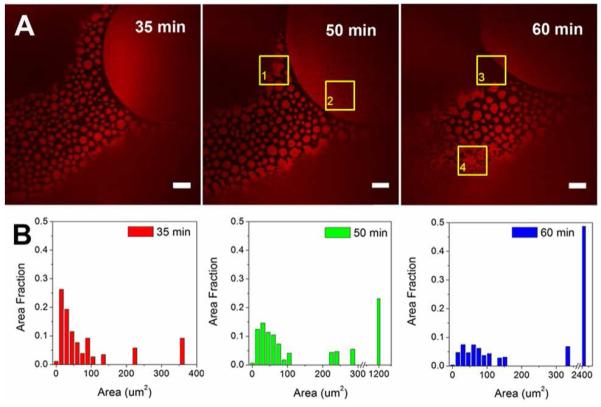
Coalescence of protein islands over time. (A) Confocal fluorescence images taken at 35, 50 and 60 min after introduction. Scale bar: 20 μm. (B) Histograms of protein island size distribution. The initial subphase concentration was [HSA-TR] = 0.50 mg/mL, [F-127] = 0.015 mg/mL. ROI-1 indicates region (yellow box) where small protein islands coalesced with surrounding protein islands to form a larger island; ROI-2 demonstrates that small black holes formed in the region; ROI-3 indicates movement at the frontier of a surfactant-rich region; ROI-4 shows where small protein islands merged into mesh-like networks.
We analyzed the size distribution of protein islands using ImageJ (Figure 5B).30 Area fraction was defined as the sum of surface area of protein islands of the same size, divided by the total area of protein islands. A clear increasing trend in the island size distribution is shown in Figure 5B. The average area of protein islands grew from 24 μm2 (35 min) to 57 μm2 (60 min). The movement of protein islands was also observed by using a faster scan rate of 30 frames/s (Movie S1 in Supporting Information, images are displayed 10 times slower in movie than in real time) and the protein islands were observed to exhibit movement similar to Brownian motion of lipid domains in monolayers.41 Importantly, neighboring islands were observed to coalesce upon contact. The existence of protein-rich domains suggests that protein and surfactant co-adsorb to the interface in a kinetic process. The strong interaction between protein molecules promotes formation of domains and domain coalescence thus resists the displacement of surfactant. However, interface occupancy by F-127 is thermodynamically favored, as the equilibrium surface tension of F-127 at 0.015 mg/mL is around 40 mN/m 42 while that of HSA at 0.50 mg/mL is 52~60 mN/m.33 Thus, over time the protein domains are gradually displaced by surfactant from the bulk to reduce the surface energy.
The observation of surfactant perforating the protein domains and expansion of the surfactant-rich region is in accordance with the “orogenic” model. This model states that surfactants displace proteins from the interface by first perforating the protein layer, forming defects or holes. Then as the surfactants continue to accumulate in these regions, the surfactant regions expand and the protein layer is forced to buckle and extend into the subphase until the protein layer eventually collapses.1,19 A different displacement mechanism has been shown in lung surfactant/polyethylene glycol/albumin mixtures, which suggests that the competitive adsorption process may be system dependent.43 Theoretical models have been developed to explain the adsorption kinetics and equilibrium states of mixed protein/surfactant solution in surface tension and surface rheology studies.40 Complementing these studies, our work provides more detailed information about the location of protein and surfactant at the interface and the structure of the assembly. The coalescence phenomenon observed in our study shows that neighboring protein domains have a tendency to reform a connected network while other protein is being displaced by surfactant, thus highlighting two competing processes of protein domain coalescence and protein displacement by surfactant in HSA-TR/F-127 mixtures.
4. CONCLUSIONS
In conclusion, we have applied fluorescence microscopy as an in situ method to study protein behavior at the AWI, on timescales of milliseconds to hours. We found that below surface-saturating bulk-solution concentration, self-assembly of a model protein HSA-TR shows varied morphologies at the AWI in response to changes of solution condition including protein concentration, ionic strength, redox state and surfactant concentration. The static and dynamic behavior of HSA-TR at the AWI is detected by our method. With the interfacial-layer-transferring technique such as Langmuir-Schaefer deposition,31 the assembled protein can be transferred to other surfaces for material applications. Our method should be easily accessible and applicable to study of other macromolecular self-assembly at the AWI. By the same approach, it is possible to study also the glass-water interface (Figure S1), and this could potentially be used to monitor competitive adsorption of surface-active species at both gas-liquid and solid-liquid interfaces. Our study shows the potential of controlling protein assembly at the AWI for biomaterials applications, and we have begun work on multi-component systems.
Supplementary Material
ACKNOWLEDGMENT
The authors gratefully acknowledge the support of this work through NIH Grants R01 HL67986 (D.M.E.), R01 HL60230 (D.M.E.), 1S10RR021113 (I.J.D.), Camille and Henry Dreyfus Foundation (I.J.D.), and NSF CAREER CHE-0548188 (I.J.D.). The authors thank Dr. Paul Janmey for sharing AFM and Microtrough instruments, Yu-Hsiu Wang for help in AFM and surface pressure measurements, Dr. Chunlai Chen for help with surface modification and Dr. Kim Sharp for helpful discussions.
Footnotes
Supporting Information Available. Sample chamber and surface modification, dye-to-protein ratio measurements, circular dichroism spectroscopy and additional figures and movie could be found free of charge at http://pubs.acs.org.
References
- (1).Morris VJ, Gunning AP. Soft Matter. 2008;4:943. doi: 10.1039/b718904d. [DOI] [PubMed] [Google Scholar]
- (2).Jia YW, Liu XY. J. Phys. Chem. B. 2006;110:6949. doi: 10.1021/jp0536089. [DOI] [PubMed] [Google Scholar]
- (3).Deng Y, Zhu XY, Kienlen T, Guo A. J. Am. Chem. Soc. 2006;128:2768. doi: 10.1021/ja057669w. [DOI] [PubMed] [Google Scholar]
- (4).Zuo YY, Veldhuizen RAW, Neumann AW, Petersen NO, Possmayer F. Biochim. Biophys. Acta, Biomembr. 2008;1778:1947. doi: 10.1016/j.bbamem.2008.03.021. [DOI] [PubMed] [Google Scholar]
- (5).Zasadzinski JA, Stenger PC, Shieh I, Dhar P. Biochim. Biophys. Acta, Biomembr. 2010;1798:801. doi: 10.1016/j.bbamem.2009.12.010. [DOI] [PMC free article] [PubMed] [Google Scholar]
- (6).Mukundakrishnan K, Ayyaswamy PS, Eckmann DM. J. Biomech. Eng. 2009;131:074516. doi: 10.1115/1.3153310. [DOI] [PubMed] [Google Scholar]
- (7).Campbell DJ, Freidinger ER, Hastings JM, Querns MK. J. Chem. Educ. 2002;79:201. [Google Scholar]
- (8).Bowden N, Terfort A, Carbeck J, Whitesides GM. Science. 1997;276:233. doi: 10.1126/science.276.5310.233. [DOI] [PubMed] [Google Scholar]
- (9).Huang SJ, Tsutsui G, Sakaue H, Shingubara S, Takahagi T. J. Vac. Sci. Technol. B. 2001;19:2045. [Google Scholar]
- (10).Zhang SG. Nat. Biotechnol. 2003;21:1171. doi: 10.1038/nbt874. [DOI] [PubMed] [Google Scholar]
- (11).Murr MM, Morse DE. Proc. Natl. Acad. Sci. U. S. A. 2005;102:11657. doi: 10.1073/pnas.0503968102. [DOI] [PMC free article] [PubMed] [Google Scholar]
- (12).Vlasova IM, Mikrin VE, Saletsky AM. Laser Phys. Lett. 2005;2:204. [Google Scholar]
- (13).McClellan SJ, Franses EI. Colloid. Surface. B. 2003;28:63. [Google Scholar]
- (14).Defeijter JA, Benjamins J, Veer FA. Biopolymers. 1978;17:1759. [Google Scholar]
- (15).Grigoriev DO, Fainerman VB, Makievski AV, Kragel J, Wustneck R, Miller R. J. Colloid Interface Sci. 2002;253:257. doi: 10.1006/jcis.2002.8562. [DOI] [PubMed] [Google Scholar]
- (16).Lu JR, Su TJ, Penfold J. Langmuir. 1999;15:6975. [Google Scholar]
- (17).Gunning AP, Wilde PJ, Clark DC, Morris VJ, Parker ML, Gunning PA. J. Colloid Interface Sci. 1996;183:600. doi: 10.1006/jcis.1996.0584. [DOI] [PubMed] [Google Scholar]
- (18).Mackie AR, Gunning AP, Ridout MJ, Wilde PJ, Patino JR. Biomacromolecules. 2001;2:1001. doi: 10.1021/bm015540i. [DOI] [PubMed] [Google Scholar]
- (19).Mackie AR, Gunning AP, Ridout MJ, Wilde PJ, Morris VJ. Langmuir. 2001;17:6593. [Google Scholar]
- (20).Murray BS, Xu R, Dickinson E. Food Hydrocolloids. 2009;23:1190. [Google Scholar]
- (21).Gluck G, Ringsdorf H, Okumura Y, Sunamoto J. Chem. Lett. 1996:209. [Google Scholar]
- (22).Powers ET, Kelly JW. J. Am. Chem. Soc. 2001;123:775. doi: 10.1021/ja005528i. [DOI] [PubMed] [Google Scholar]
- (23).Theodore P., Jr. All About Albumin. Academic Press, Inc.; San Diego: 1995. [Google Scholar]
- (24).Krishnan A, Wilson A, Sturgeon J, Siedlecki CA, Vogler EA. Biomaterials. 2005;26:3445. doi: 10.1016/j.biomaterials.2004.09.016. [DOI] [PubMed] [Google Scholar]
- (25).Eckmann DM, Zhang J, Lampe J, Ayyaswamy PS. Ann N Y Acad Sci. 2006;1077:256. doi: 10.1196/annals.1362.039. [DOI] [PubMed] [Google Scholar]
- (26).Narazaki R, Maruyama T, Otagiri M. Biochim. Biophys. Acta, Protein Struct. Mol. Enzymol. 1997;1338:275. doi: 10.1016/s0167-4838(96)00221-x. [DOI] [PubMed] [Google Scholar]
- (27).Ariola FS, Krishnan A, Vogler EA. Biomaterials. 2006;27:3404. doi: 10.1016/j.biomaterials.2006.02.005. [DOI] [PubMed] [Google Scholar]
- (28).Lad MD, Birembaut F, Matthew JM, Frazier RA, Green RJ. Phys. Chem. Chem. Phys. 2006;8:2179. doi: 10.1039/b515934b. [DOI] [PubMed] [Google Scholar]
- (29).Lampe JW, Liao Z, Dmochowski IJ, Ayyaswamy PS, Eckmann DM. Langmuir. 2010;26:2452. doi: 10.1021/la903703u. [DOI] [PMC free article] [PubMed] [Google Scholar]
- (30).Rasband WS, Image J. U. S. National Institutes of Health; Bethesda, Maryland, USA: 1997-2011. http://imagej.nih.gov/ij/ [Google Scholar]
- (31).Bantchev GB, Schwartz DK. Langmuir. 2004;20:11692. doi: 10.1021/la048380f. [DOI] [PubMed] [Google Scholar]
- (32).Horcas I, Fernandez R, Gomez-Rodriguez JM, Colchero J, Gomez-Herrero J, Baro AM. Rev. Sci. Instrum. 2007;78 doi: 10.1063/1.2432410. [DOI] [PubMed] [Google Scholar]
- (33).Krishnan A, Siedlecki CA, Vogler EA. Langmuir. 2003;19:10342. [Google Scholar]
- (34).Lee MH, Reich DH, Stebe KJ, Leheny RL. Langmuir. 2010;26:2650. doi: 10.1021/la902881f. [DOI] [PubMed] [Google Scholar]
- (35).Meakin P. Phys. Rev. Lett. 1983;51:1119. [Google Scholar]
- (36).Dhar P, Cao YY, Fischer TM, Zasadzinski JA. Phys. Rev. Lett. 2010;104 doi: 10.1103/PhysRevLett.104.016001. [DOI] [PMC free article] [PubMed] [Google Scholar]
- (37).Magdassi S. Surface activity of proteins: chemical and physicochemical modifications. Marcel Dekker, Inc.; New York: 1996. [Google Scholar]
- (38).Chandler D. Nature. 2005;437:640. doi: 10.1038/nature04162. [DOI] [PubMed] [Google Scholar]
- (39).Rao CS, Damodaran S. Langmuir. 2000;16:9468. [Google Scholar]
- (40).Kotsmar C, Pradines V, Alahverdjieva VS, Aksenenko EV, Fainerman VB, Kovalchuk VI, Krägel J, Leser ME, Noskov BA, Miller R. Adv. Colloid Interface Sci. 2009;150:41. doi: 10.1016/j.cis.2009.05.002. [DOI] [PubMed] [Google Scholar]
- (41).McConnell HM, Rice PA, Benvegnu DJ. J. Phys. Chem. 1990;94:8965. [Google Scholar]
- (42).Elisseeva OV, Besseling NAM, Koopal LK, Stuart MAC. Langmuir. 2005;21:4954. doi: 10.1021/la046933g. [DOI] [PubMed] [Google Scholar]
- (43).Stenger PC, Zasadzinski JA. Biophys. J. 2007;92:3. doi: 10.1529/biophysj.106.091157. [DOI] [PMC free article] [PubMed] [Google Scholar]
Associated Data
This section collects any data citations, data availability statements, or supplementary materials included in this article.