Abstract
Neuroblastoma is a childhood malignancy of the sympathetic nervous system. The tumor exhibits two different phenotypes: favorable and unfavorable. MYCN amplification is associated with rapid tumor progression and the worst neuroblastoma disease outcome. We have previously reported that inhibitors of histone deacetylase (HDAC) and proteasome enhance favorable neuroblastoma gene expression in neuroblastoma cell lines and inhibit growth of these cells. In this study, we investigated the effect of Trichostatin A or TSA (an HDAC inhibitor), and Epoxomycin (a proteasome inhibitor) on MYCN and p53 expression in MYCN-amplified neuroblastoma cells. It was found that TSA down-regulated MYCN expression, but Epoxomycin and the TSA/Epoxomycin combination led to MYCN hyper-expression in MYCN-amplified neuroblastoma cell lines. Despite their contrasting effects on MYCN expression, TSA and Epoxomycin caused growth suppression and cell death of the MYCN-amplified cell lines examined. Consistent with these data, forced hyper-expression of MYCN in MYCN-amplified IMR5 cells via transfection resulted in growth suppression and the increased expression of several genes known to suppress growth or induce cell death. Furthermore, Epoxomycin as a single agent and its combination with TSA enhance p53 expression in the MYCN-amplified neuroblastoma cell lines. Unexpectedly, co-transfection of TP53 and MYCN in IMR5 cells resulted in high p53 expression but a reduction of MYCN expression. Together our data suggest that either down regulation or hyper-expression of MYCN results in growth inhibition and/or apoptosis of MYCN-amplified neuroblastoma cells. In addition, elevated p53 expression has a suppressive effect on MYCN expression in these cells.
Keywords: neuroblastoma, MYCN, p53
Introduction
Neuroblastoma is the most common extracranial solid tumor of childhood and is the cause of ~15% of deaths in children with cancer. Neuroblastoma is an enigmatic tumor because of its potential to undergo spontaneous regression or maturation (favorable neuroblastoma), or to exhibit unrestrained growth (unfavorable neuroblastoma). About half of unfavorable neuroblastoma cases have MYCN amplification, which is associated with advanced stage disease, older age, rapid tumor progression and the worst outcome (1–3). The inexorable progression of MYCN-amplified neuroblastoma has presented a major challenge in developing effective therapeutic strategies against these aggressive tumors. An earlier study revealed that retinoic acid down-regulates MYCN expression and concomitantly induces neuroblastoma differentiation in MYCN-amplified neuroblastoma cells (4). More recently, it has been shown that targeted silencing of MYCN by siRNA or ‘anti-gene’ causes growth suppression and cell death in MYCN-amplified neuroblastoma cell lines (5,6). These observations suggest that down-regulation of MYCN expression is one of the essential steps in controlling the malignant MYCN-amplified neuroblastomas.
Inhibitors of histone deacetylase (HDAC) and proteasome have a significant growth suppressive effect on neuroblastoma cells (7). These inhibitors can also enhance the expression of favorable neuroblastoma genes whose expressions are associated with a favorable outcome of neuroblastoma (7). In this study, we investigated the effect of an HDAC inhibitor, TSA, and a proteasome inhibitor, Epoxomycin, as single agents or in combination on MYCN and p53 protein expression and growth of MYCN-amplified neuroblastoma in vitro. It was found that Epoxomycin and the TSA/Epoxomycin combination led to MYCN hyper-expression (defined as markedly increased expression beyond that observed in the untreated cell lines) and massive cell death in MYCN-amplified neuroblastoma cell lines. These data suggest that hyper-expression of MYCN is deleterious to growth and/or survival of MYCN-amplified neuroblastoma cells. Consistent with this idea, forced hyper-expression of MYCN in MYCN-amplified neuroblastoma cells via transfection caused a significant reduction in growth and the enhanced expression of several genes associated with growth suppression and cell death. Epoxomycin as a single agent or in combination with TSA was found to increase p53 expression in addition to MYCN up-regulation in the neuroblastoma cell lines examined. However, co-transfection of TP53 and MYCN in IMR5 cells resulted in high p53 expression and reduced MYCN expression, suggesting that elevated p53 expression leads to down-regulation of MYCN in neuroblastoma cells.
Materials and methods
Neuroblastoma cell lines
The neuroblastoma cell lines (IMR5, CHP134 and NLF) were grown in RPMI-1640 supplemented with 5% fetal bovine serum and OPI (1 mM Oxaloacetate, 0.45 mM Pyruvate, 0.2 U/ml Insulin, final concentration). These cell lines tested negative for mycoplasma, and their identity was validated by the original source or by micro-satellite analysis (P.S. White, Children's Hospital of Philadelphia, unpublished data). IMR5 (a clone of IMR32) and CHP134 were received from Dr Roger H. Kennett (Wheaton College, Wheaton, IL). NLF was from Dr Garrett M. Brodeur (The Children's Hospital of Philadelphia).
Transient transfection of neuroblastoma cells with MYCN and/or TP53
Full-length cDNA of MYCN was cloned into an eukaryotic expression vector, pCI-neo. The SN3 construct containing a wild-type TP53 cDNA (obtained from Drs Bert Vogelstein and Kenneth Kinzler) was originally cloned into the BCMGNeo vector (8). IMR5 cells were transfected with the control vectors, the pCI-neo/MYCN, and/or the SN3 construct by electroporation using an XCell electroporator (Bio-Rad) (120V square wave for 20 msec). For the MTS assay, the resulting transfectants were selected by neomycin (500 µg/ml) for 5 days. To determine MYCN and p53 protein expression (see below), the cells were harvested at 24 h after transfection. For the experiment described in Fig. 8A, the episomal expression vector pEAK12 carrying a full-length MYCN cDNA was used to retain high-level MYCN expression in the transfected cells during the experimental period. Two days after transfection, the cells were harvested and subjected to TaqMan real-time gene expression studies.
Figure 8.
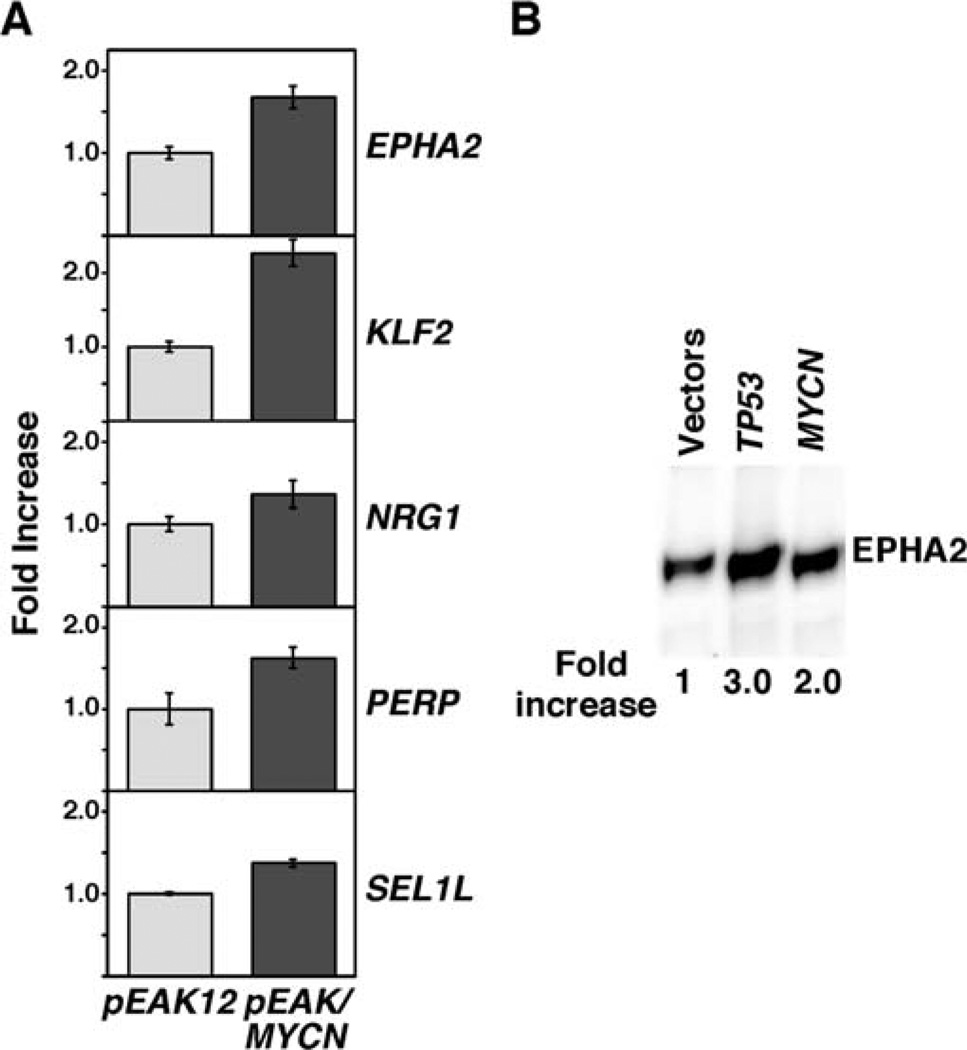
(A) Enhanced expression of genes involved in growth and tumor suppression by MYCN hyper-expression induced by transfection of MYCN in MYCN-amplified IMR5 cells. IMR5 cells were transfected with pEAK12 vector control or pEAK12/MYCN. The cells were harvested two days after transfection. Transfections were performed in duplicate for vector control and triplicate for pEAK12/MYCN. RNAs were prepared from the transfected cells, and pools of RNA from each transfection condition were used in reverse transcription. Expression of genes of interest was examined using TaqMan real-time PCR. Expression levels of EPHA2, KLF2, NRG1, PERP, SEL1L were presented as fold increase in the MYCN transfected IMR5 cells over the vector control. (B) Ectopic expression of either MYCN or p53 induces EPHA2 expression in IMR5 cells. EPHA2 is a known downstream effector of p53 (20). We therefore included TP53-transfected IMR5 cells as a comparative control in this experiment. pCI/MYCN and the TP53 construct, SN3, were transfected to IMR5 by electroporation. Twenty-four h later, the cells were harvested and subjected to Western blot analysis using the mouse monoclonal antibody anti-EPHA2 clone D7 (Millipore). Twenty micrograms of total protein were loaded per lane.
MTS assay and Western blot analysis
A 3-(4,5-Dimethylthiazol-2-yl)-5-(3-carboxymethoxyphenyl)-2-(4-sulfophenyl)-2H-tetrazolium, inner salt assay or MTS assay (a water soluble form of the MTT assay) was performed as described in our previous study (9). Western blotting was performed according to the method previously described (10) except SuperSignal West Dura Extended Duration Substrate (Pierce) was used. Light emission signals were captured by an LAS-3000 (Fujifilm) digital image analyzer. Cell extracts were made in the 2D gel sample buffer (9M urea, 2% Nonidet-P40, 2% 2-mercaptoethanol, and 0.32% pH 3.0–10.0 2D Pharmalyte) and the protein content of the samples was determined by the Bio-Rad protein assay kit using bovine serum albumin as a standard and the sample buffer as the blank. MYCN protein was detected with the mouse monoclonal antibody, NCM II 100 (11), whereas p53 was detected by a mouse monoclonal antibody, DO-1 (Calbiochem). Antibodies used to detect other proteins of interest are described in the figure legends.
Affymetrix microarray analysis
IMR5 cells were transfected with either the pCI/MYCN construct or the vector control pCI-neo. The cells were harvested at 24 h of transfection and elevation of MYCN expression was confirmed by Western blot analysis. Total RNAs were isolated from the transfected cells using an RNeasy kit (Qiagen). cRNA targets were prepared from 1 µg of total RNA using the MessageAmp Premier III kit from Ambion. Fragmented target (15 µg) was hybridized to U133 plus V2 chips at 45°C at 60 rpm for 16 h, and the chips were washed according to the manufacturer's instructions. Chips were scanned and the data were collected using the Affymetrix GeneChip Operating System (GCOS) software. The microarray hybridizations were performed in triplicate both for the vector control and the MYCN transfectant. CEL files generated by GCOS were used for subsequent data extraction and analysis using Probe Profiler software (12). Probe Profiler uses a training set of data from microarrays to create a statistical model of performance for every probe pair and probe set within the array. Model-based weights are assigned to probe pairs as a function of their consistency of performance across chips. By modeling the behavior of each probe set, noise can be addressed in a gene-specific manner. There are also a number of built-in quality control functions that permit monitoring of many factors affecting data quality and masking of unreliable probe cells. The primary hybridization data collected were further subjected to a statistical filtration using the method of Conservative Log Ratio, which combines elements of p-value and magnitude of fold-change to rank data (12). In our analysis, p<0.05 was used for the primary filtration.
Reverse transcription and TaqMan real-time PCR
RNAs were isolated from neuroblastoma cell lines using the Qiagen RNeasy kit. Two micrograms of total RNA were used to synthesize cDNA. The experimental procedures for the reverse transcription were performed as previously described (13). The quantitative real-time PCR was done using an iQ5 real-time PCR machine (Bio-Rad). TaqMan probes were purchased from Applied Biosystems, Inc., and the multiplex qPCR mix (QuantiTect Multiplex PCR kit) was purchased from Qiagen. Relative quantification of expression levels of genes of interest was done by the ΔΔCt method using the expression of 18S ribosomal RNA as an internal control. The experimental procedures were performed according to the instructions provided by Qiagen and Bio-Rad.
Results
TSA and Epoxomycin have contrasting effects on MYCN expression in MYCN-amplified neuroblastoma cell lines
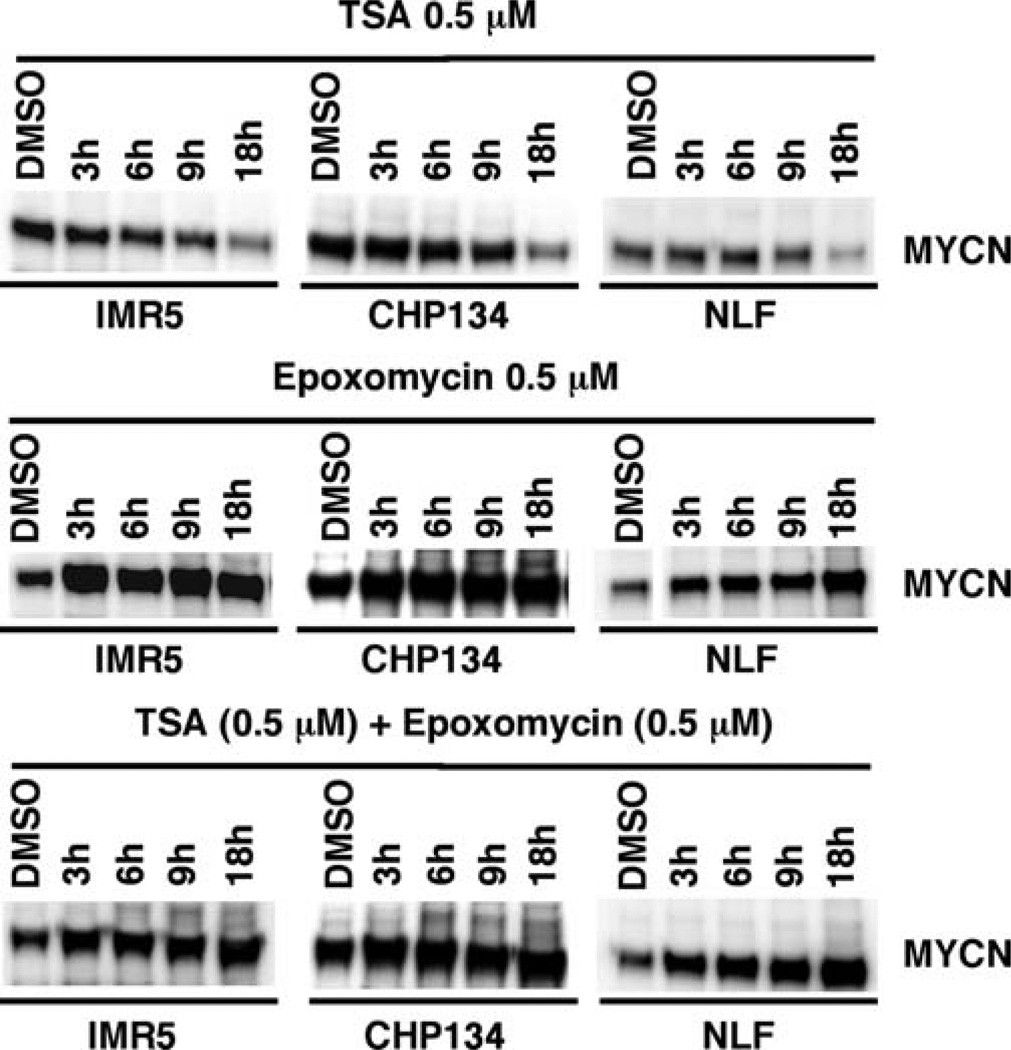
To explore how inhibitors of HDAC and proteasome influence the biology of MYCN-amplified neuroblastoma cells, we examined the effect of TSA (a potent HDAC inhibitor) and Epoxomycin (a potent proteasome inhibitor) as single agents or in combination on MYCN expression in MYCN-amplified neuroblastoma cell lines (IMR5, CHP134 and NLF). Among the three cell lines examined, NLF is a retinoid-resistant line. As shown in Fig. 1, TSA at the concentrations of 0.5 µM and 1 µM down-regulated the expression of MYCN in the three cell lines examined at 18 h of treatment. In contrast, Epoxomycin as a single agent (0.5 and 1 µM) and in combination with TSA resulted in MYCN hyper-expression in MYCN-amplified neuroblastoma cells. Time course experiments further showed that the effect of TSA on MYCN expression was seen at 18 h after drug treatment and that little effect was detected at earlier time points (Fig. 2). Epoxomycin as a single agent and in combination with TSA resulted in an increase in MYCN expression as early as 3 h of treatment in these cell lines (Fig. 2).
Figure 1.
TSA and Epoxomycin have contrasting effects on MYCN expression in MYCN-amplified neuroblastoma cell lines (IMR5, CHP134 and NLF). IMR5, CHP134, and NLF were treated with TSA (0.5 or 1 µM), Epoxomycin (0.5 or 1 µM) and the combination TSA (0.5 µM) plus Epoxomycin (0.5 µM) for 18 h. The cells were harvested and subjected to Western blot analysis. Total protein (5 µg) was loaded per lane. The MYCN-specific monoclonal antibody, NCM II 100, was used to detect expression of MYCN (11). The experiments were repeated at least three times to demonstrate the reproducibility of these results.
Figure 2.
Time course studies on the effect of TSA, Epoxomycin, and their combination on MYCN expression in MYCN-amplified neuroblastoma cell lines (IMR5, CHP134 and NLF). IMR5, CHP134, and NLF were treated with TSA (0.5 µM), Epoxomycin (0.5 µM) and the combination of TSA (0.5 µM) plus Epoxomycin (0.5 µM) for 3, 6, 9 and 18 h. The cells were harvested and subjected to Western blot analysis. The experiments were done as described in Fig. 1.
Both TSA and Epoxomycin as single agents and in combination significantly suppress growth of MYCN-amplified neuroblastoma cell lines
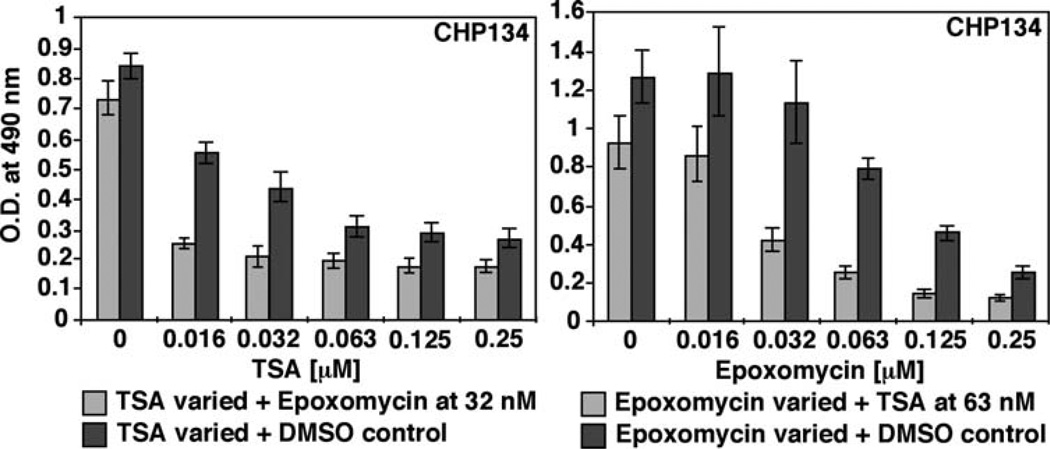
In contrast to TSA, Epoxomycin greatly enhanced MYCN expression in the MYCN-amplified neuroblastoma cell lines examined. We therefore investigated the effect of these two compounds on the growth of neuroblastoma cells. Fig. 3 shows the results for CHP134. Similar observations were made for IMR5 and NLF (data not shown). As shown in Fig. 3, TSA and Epoxomycin as single agents (shown as dark gray bars) significantly suppressed growth of CHP134. Combination treatments were tested in the following ways: (a) constant dose of Epoxomycin (32 nM) against various concentrations of TSA (0.016–0.25 µM), and (b) constant dose of TSA (63 nM) against various concentrations of Epoxomycin (0.016–0.25 µM). Doses of the tested drugs used in the combination therapies were based on the IC50 doses. Both of the combination therapies (shown as light gray bars in Fig. 3) significantly suppressed growth of the neuroblastoma cell lines examined. In addition, the TSA/Epoxomycin combination had an additive effect on growth suppression compared to the single drug treatments.
Figure 3.
TSA and Epoxomycin as single agents or in combination significantly suppress growth of CHP134. CHP134 cells were treated with TSA and Epoxomycin as single agents (dark gray) or in combination (light gray) at the concentrations indicated. After 24 h of the treatments, an MTS assay was done to determine the effect of the experimental drugs on growth of the neuroblastoma cell lines examined. IMR5 and NLF showed similar results (data not shown).
Induction of neuroblastoma cell death by TSA and Epoxomycin is in part mediated by Caspase-3 in MYCN-amplified neuroblastoma cells
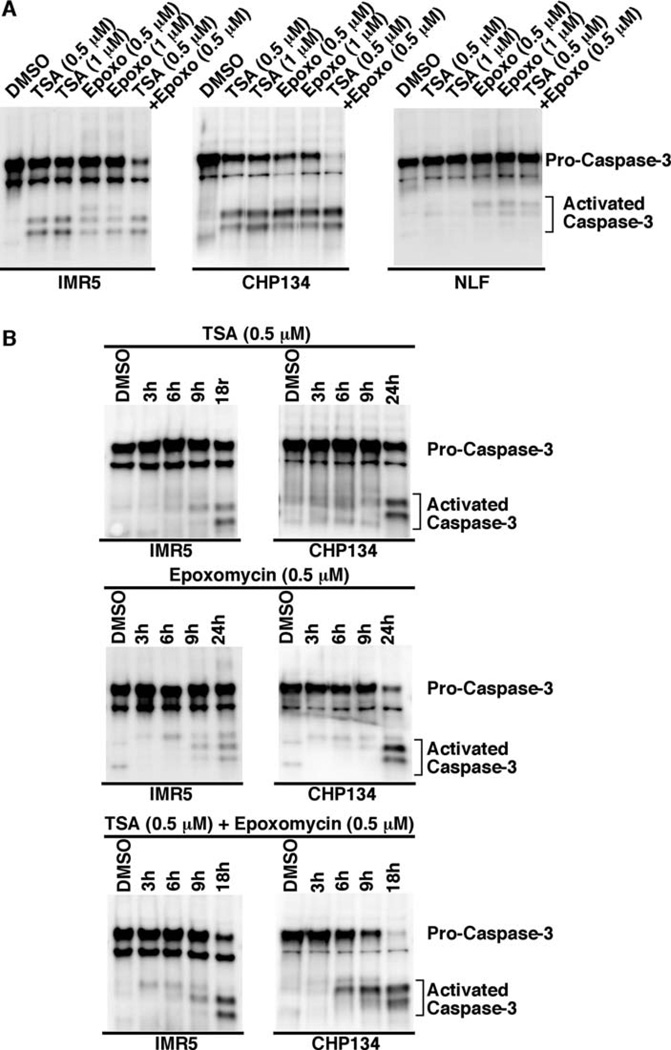
Upon treatment of IMR5, CHP134, and NLF with TSA and Epoxomycin as single agents or in combination, we observed the induction of cell death by microscopic observation. Since Caspase-3 is the most downstream effector caspase in the pathway, we next investigated the expression of activated Caspase-3 in the treated cells. As shown in Fig. 4A, TSA and/or Epoxomycin activated Caspase-3 in IMR5 and CHP134 (retinoid-sensitive lines), whereas Epoxomycin and the combination weakly activated Caspase-3 in NLF (retinoid-resistant line). A time course experiment was also performed and confirmed that Caspase-3 was activated at 18–24 h of treatment, but not earlier (3, 6 or 9 h) in IMR5 and CHP134 (Fig. 4B).
Figure 4.
(A) TSA and Epoxomycin as single agents or in combination activate Caspase-3 in IMR5 and CHP134 (retinoid-sensitive lines), whereas Epoxomycin and the combination weakly activate Caspase-3 in NLF. The neuroblastoma cell lines were treated with TSA, Epoxomycin, and the combination for 18 h at the concentrations indicated. Caspase-3 activation was investigated in the drug-treated cells by Western blot analysis using antibodies that could detect both pro and active forms of Caspase-3 (Stressgen, AAP-113). Total protein (10 µg) was loaded per lane. (B) The effect of TSA and/or Epoxomycin on Caspase-3 activation in time course studies. Neuroblastoma cell lines indicated were treated at various time points with TSA, Epoxomycin, and the combination as shown. Caspase-3 activation was investigated in the drug-treated cells as described in (A).
Epoxomycin as a single agent and its combination with TSA enhance p53 expression in MYCN-amplified neuroblastoma cell lines
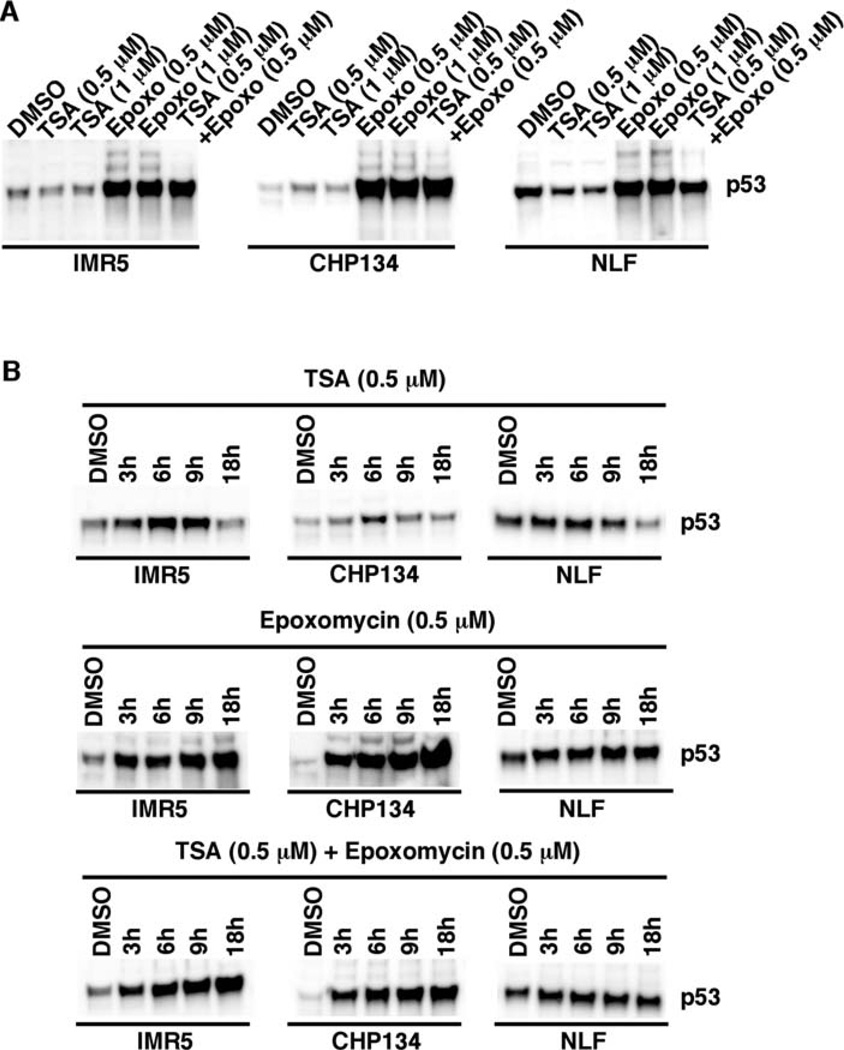
Caspase-3 is a downstream effector of the p53 pathway (14,15). In addition, MYC family proteins are known to induce apoptosis through the ARF, MDM2 and p53-dependent pathways (16). We therefore examined the expression of p53 in IMR5, CHP134, and NLF treated with TSA and Epoxomycin as single agents or in combination. As shown in Fig. 5A, TSA had little or no effect on p53 expression in IMR5 and CHP134 at the 18 h-treatment and decreased its expression in NLF (see below). In contrast, p53 expression was increased in the neuroblastoma cell lines treated with either Epoxomycin or TSA in combination with Epoxomycin. It should be noted that neuroblastoma cells express detectable levels of p53 in general (17), and TP53 mutations have been shown to further elevate p53 expression in neuroblastoma cells (18). Since there was relatively high expression of p53 in NLF cells (Fig. 5A), it remains to be determined whether NLF carries a mutated TP53.
Figure 5.
(A) The effect of TSA and Epoxomycin on p53 expression in MYCN-amplified neuroblastoma cell lines (IMR5, CHP134 and NLF). IMR5, CHP134, and NLF were treated with TSA (0.5 or 1 µM), Epoxomycin (0.5 or 1 µM) and the combination of TSA (0.5 µM) plus Epoxomycin (0.5 µM) for 18 h. (B) Time course studies on the effect of the tested drugs on p53 expression. IMR5, CHP134, and NLF were treated with TSA (0.5 µM), Epoxomycin (0.5 µM) and the combination of TSA (0.5 µM) plus Epoxomycin (0.5 µM) for 3, 6, 9 and 18 or 24 h as shown. The cells were harvested and subjected to Western blot analysis. Total protein (10 µg) was loaded per lane. A p53-specific monoclonal antibody, DO-1 (Calbiochem), was used to detect expression of p53. The experiments were repeated at least three times to demonstrate the reproducibility of these results.
Time course experiments were also performed and confirmed that the effect of Epoxomycin and the combination treatment was seen as early as 3 h of treatment (Fig. 5B). On the other hand, TSA initially increased p53 expression, peaking at 6 h of the treatment, but steadily decreased its expression thereafter in IMR5, CHP134 and NLF. As a result, there was no significant change in p53 expression between the control DMSO-treated and TSA-treated IMR5 and CHP134 at 18 h of treatment. However, there was a reduction of p53 expression at 18 h in NLF (Fig. 5B).
Expression of p21waf1 in IMR5, CHP134, and NLF treated with TSA and Epoxomycin as single agents and in combination
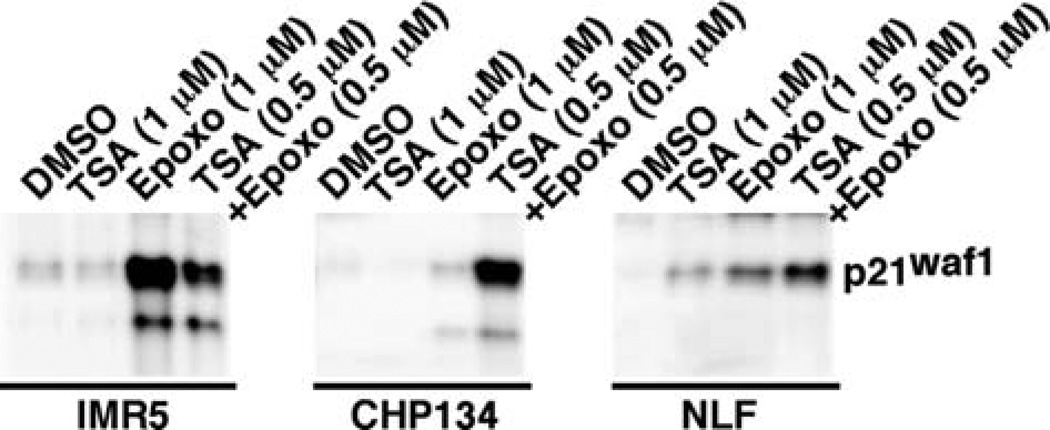
We next investigated the expression of p21waf1, a known direct target of p53, in the neuroblastoma cell lines treated with TSA and/or Epoxomycin. As shown in Fig. 6, TSA had little or no effect on p21waf1 expression. Epoxomycin alone and in combination with TSA increased p21waf1 expression in all cell lines examined. The combination treatment produced the highest p21waf1 expression in CHP134 and NLF. However, the epoxomycin treatment resulted in the highest expression of p21waf1 in IMR5. It should be mentioned that Western blot analysis showed little or no effect of the drug treatments on the expression of Bax (another direct target of p53) and Bcl-2 (data not shown).
Figure 6.
The effect of TSA and Epoxomycin on p21waf1 expression in MYCN-amplified neuroblastoma cell lines (IMR5, CHP134 and NLF). IMR5, CHP134, and NLF were treated with TSA (1 µM), Epoxomycin (1 µM) and the combination of TSA (0.5 µM) plus Epoxomycin (0.5 µM) for 18 h. The cells were harvested and subjected to Western blot analysis using an anti-p21waf1 antibody (OP64, Calbiochem). Total protein (20 µg) was loaded per lane. The experiments were repeated at least three times.
Implications of hyper-expression of MYCN induced by chemotherapeutics or transfection in the MYCN-amplified IMR5 cell line
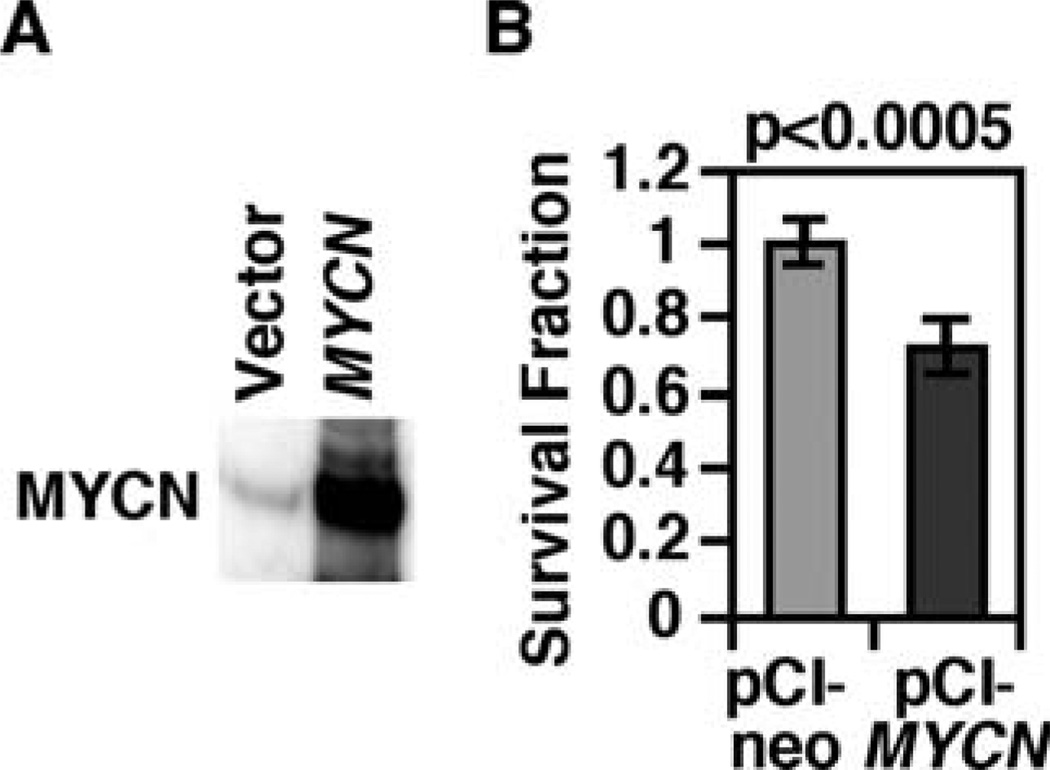
Our data collectively indicated that inhibition of HDAC and proteasome has a global effect on the expression of several proteins to influence the growth and death of MYCN-amplified neuroblastoma cells, including MYCN, p53, p21waf1, and Caspase-3. In particular, treatment of CHP134, IMR5, and NLF with Epoxomycin as a single agent or in combination with TSA resulted in a markedly elevated MYCN expression (Fig. 1) as well as growth suppression and cell death (Fig. 3). These observations prompted us to investigate the effect of MYCN hyper-expression via MYCN transfection on growth and gene/protein expression patterns in MYCN-amplified neuroblastoma cells. As shown in Fig. 7, the hyper-expression of MYCN in the MYCN-transfected IMR5 cells resulted in significant growth suppression. It should be noted that MYCN expression in the transfectant was as high as those detected in IMR5 cells treated with either Epoxomycin or the combination of TSA and Epoxomycin (Fig. 7A, see also Fig. 1).
Figure 7.
(A and B) Forced MYCN expression suppresses growth of IMR5 cells. (A) A full-length cDNA of MYCN was cloned into a eukaryotic expression vector, pCI-neo. IMR5 cells were transfected with either the vector control or the pCI/MYCN cDNA construct by electroporation. Twenty-four h after transfection, the cells were harvested and subjected to Western blot analysis. Five micrograms of total protein were loaded per lane. The MYCN-specific monoclonal antibody, NCM II 100, was used to detect the expression of MYCN. It should be noted that the expression of MYCN in the transfected cells was as high as that shown in the combination TSA plus Epoxomycin treatment (see Fig. 1). (B) To examine the effect of ectopic expression of MYCN in IMR5, the resulting transfectants were selected by neomycin (500 µg/ml) for 5 days, and an MTS assay (a soluble form of MTT assay) was done.
To further address mechanism(s) by which the MYCN hyper-expression confers the growth suppressive effect shown in Fig. 7, we performed genome-wide gene expression profiling analysis of MYCN-transfected IMR5 cells against IMR5 cell transfected with the parental vector. After statistical filtering of the primary microarray data, we obtained a list of 68 genes whose expressions were significantly up-regulated in the MYCN-transfected IMR5 cells. Among these, we identified several genes that could account for the growth suppressive effect of MYCN hyper-expression in the transfected IMR5 cells. Representative genes of the list include EPHA2, KLF2, NRG1, PERP, and SEL1L (see Discussion). TaqMan real-time qPCR (Fig. 8A) and Western blot analysis (Fig. 8B) confirmed that these genes were expressed at higher levels in MYCN-transfected IMR5 cells than those transfected with the vector only (Fig. 8). It should be noted that EPHA2 is a growth suppressive gene in neuroblastoma, as its ectopic expression significantly suppresses the growth of neuroblastoma cells (19). In addition, EPHA2 is a known downstream effector of p53 (20). As shown in Fig. 8B, both MYCN and p53 enhanced EPHA2 protein expression.
Implication of elevated p53 expression in neuroblastoma
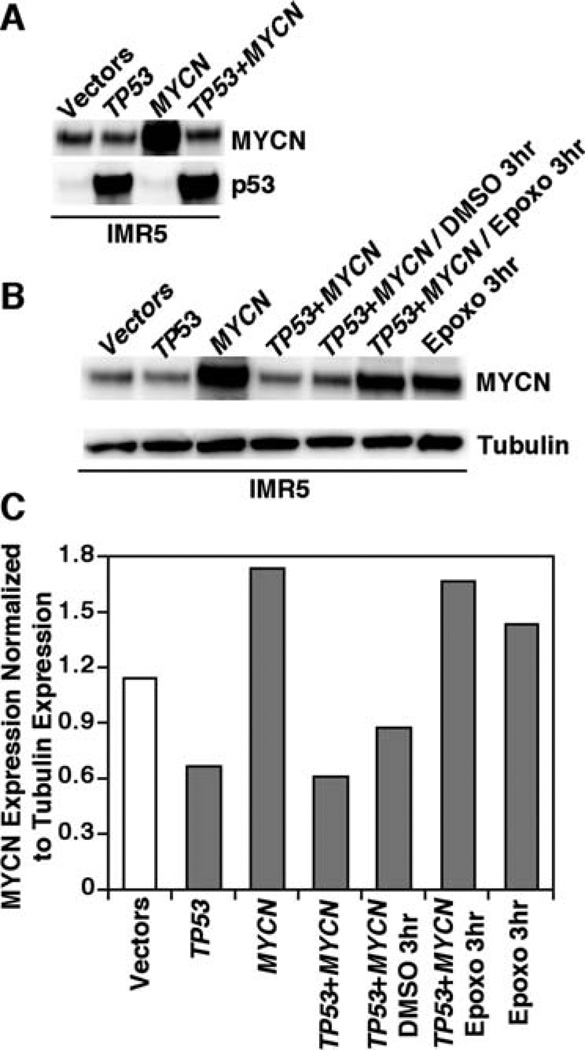
As mentioned above, Epoxomycin and the TSA/Epoxomycin combination treatment resulted in a markedly increased expression of both MYCN and p53 proteins in MYCN-amplified neuroblastoma cells. We therefore asked what are the biological consequences of simultaneous hyper-expression of MYCN and p53 in IMR5 cells. To address this question, IMR5 cells were transfected with MYCN, TP53, their combination, or the empty vectors as controls, and the expression of MYCN and p53 was determined. Transfection of IMR5 cells with either TP53 or MYCN enhanced the expression of the corresponding proteins (Fig. 9A and B, Lane 2 and Lane 3). Unexpectedly, there was a marked suppression of MYCN expression in the TP53/MYCN double transfectant as compared to that of the cells transfected with MYCN alone (Fig. 9A and B, Lane 3 and Lane 4). Because treatment of IMR5 cells with Epoxomycin as a single agent or in combination with TSA resulted in high-level expression of both MYCN and p53 (Figs. 1 and 5), our data suggest that elevated p53 expression affects MYCN stability and that such an effect is at least in part dependent on the proteasome. This idea was further tested and confirmed by subsequent experiments. As shown in Fig. 9B and C (Lanes 5–6), high-level MYCN expression was restored in the TP53/MYCN double transfectant that was treated with Epoxomycin.
Figure 9.
Elevated p53 expression suppresses MYCN expression in a proteasome-dependent fashion. (A) IMR5 cells were transfected with control vectors, the wild-type TP53 construct, the MYCN construct or the combination of TP53 and MYCN. After 24 h of transfection, MYCN and p53 expression was determined by Western blot assay. Total protein (5 µg) was loaded per lane. (B) Lane 1–4: IMR5 cells were treated as described in (A). Lanes 5–6: The double TP53/MYCN transfectants were also treated with either the solvent control DMSO or Epoxomycin (1 µM) for the last 3 h. Lane 7 (the last lane): IMR5 cells treated with only Epoxomycin (1 µM) for 3 h were included as a control. (C) Normalized expression levels of MYCN against tubulin in the conditions shown in (B).
Discussion
In this study, we showed that TSA down-regulated the expression of MYCN protein, whereas Epoxomycin enhanced MYCN expression in MYCN-amplified neuroblastoma cells. Despite their contrasting effects on MYCN expression, both TSA and Epoxomycin as single agents suppressed growth of the neuroblastoma cell lines tested. The effects of TSA as an HDAC inhibitor on MYCN expression (MYCN down-regulation) and on growth of neuroblastoma cells are consistent with data of a previous study (21). These observations reemphasize the growth-promoting activity of MYCN for MYCN-amplified neuroblastoma cells and that its down-regulation is linked to growth suppression.
A rather striking observation made by this study was that the markedly increased MYCN expression induced by either Epoxomycin or its combination with TSA was found to be associated with severe growth suppression and massive cell death of neuroblastoma (Figs. 1 and 3). These data suggest that while the endogenous high-level MYCN expression in MYCN-amplified neuroblastoma cells is required to sustain growth of these cells, external stimuli (e.g., chemotherapeutic agents) that highly enhance MYCN expression result in growth inhibition and/or apoptosis of these malignant neuroblastoma cells.
As a proteasome inhibitor, Epoxomycin can prevent MYCN degradation, resulting in an accumulation of MYCN protein in neuroblastoma cells. This resembles the hyper-expression of MYCN via transfection of the MYCN gene into MYCN-amplified neuroblastoma cells. In fact, our gene expression studies revealed that the hyper-expression of MYCN in the MYCN-transfected IMR5 cells resulted in an increased expression of genes involved in growth suppression and apoptosis such as EPHA2, KLF2, NRG1, PERP, and SEL1L. As mentioned, EPHA2 is a growth suppressive gene of neuroblastoma (19). KLF2 is a MYCN target gene (22), and over-expression of KLF2 has been shown to suppress growth and enhance DNA damage-induced apoptosis of ovarian cancer cells (23). It has been shown that NRG1 is frequently silenced in breast cancer cells, and its ectopic expression causes apoptosis (24). PERP is a p53 target gene and has been shown to induce apoptosis in a p53-dependent fashion (25). SEL1L is also a p53 target gene and exhibits growth suppressive activity in colon carcinoma (26). Consistent with the gene expression profiling results, we have also found that the MYCN-transfected IMR5 cells express elevated levels of EPHA2 protein (Fig. 8B). It remains to be determined, however, whether EPHA2, PERP, and SEL1L are direct MYCN target genes. Together these data could explain in part why the highly elevated MYCN expression in the MYCN-amplified neuroblastoma cells treated with Epoxomycin or its combination with TSA is associated with growth suppression and cell death.
As described earlier, Epoxomycin and its combination with TSA enhance p53 expression in the MYCN-amplified cell lines examined. Furthermore, our data (Fig. 9) suggest that elevated p53 expression leads to destabilization of MYCN in MYCN-amplified neuroblastoma cells and that such effect is proteasome-dependent. These observations suggest that the MYCN hyper-expression induced by transfection or chemotherapeutics such as Epoxomycin is in fact detrimental to the MYCN-amplified neuroblastoma cells. This is consistent with the fact that the half-life of MYCN is rather short in neuroblastoma (11). In addition, our data suggest that MYCN expression in neuroblastoma, or perhaps even in normal cells during development, is highly regulated and that p53 may play an important role in this regulation. In an independent study, we have identified chemotherapeutic agents that enhance p53 expression and decrease MYCN and MYC expression concomitantly in neuroblastoma cells. We are currently investigating mechanism underlying this phenomenon.
Acknowledgements
We would like to thank Dr B. Vogelstein and Dr K. Kinzler for providing us with the p53 construct used in this study, and Autumn Fox for her critical reading of the manuscript. This study was supported by NIH grants CA97255 (X.X.T), CA127571 and CA85519 (N.I.).
Abbreviations
- HDAC
histone deacetylase
References
- 1.Moreau LA, McGrady P, London WB, Shimada H, Cohn SL, Maris JM, Diller L, Look AT, George RE. Does MYCN amplification manifested as homogeneously staining regions at diagnosis predict a worse outcome in children with neuroblastoma? A Children's Oncology Group study. Clin Cancer Res. 2006;12:5693–5697. doi: 10.1158/1078-0432.CCR-06-1500. [DOI] [PubMed] [Google Scholar]
- 2.Seeger RC, Brodeur GM, Sather H, Dalton A, Siegel SE, Wong KY, Hammond D. Association of multiple copies of the N-myc oncogene with rapid progression of neuroblastomas. New Engl J Med. 1985;313:1111–1116. doi: 10.1056/NEJM198510313131802. [DOI] [PubMed] [Google Scholar]
- 3.Brodeur GM, Seeger RC, Schwab M, Varmus HE, Bishop JM. Amplification of N-myc in untreated human neuroblastomas correlates with advanced disease stage. Science. 1984;224:1121–1124. doi: 10.1126/science.6719137. [DOI] [PubMed] [Google Scholar]
- 4.Thiele CJ, Reynolds CP, Israel MA. Decreased expression of N-myc precedes retinoic acid-induced morphological differentiation of human neuroblastoma. Nature. 1985;313:404–406. doi: 10.1038/313404a0. [DOI] [PubMed] [Google Scholar]
- 5.Kang JH, Rychahou PG, Ishola TA, Qiao J, Evers BM, Chung DH. MYCN silencing induces differentiation and apoptosis in human neuroblastoma cells. Biochem Biophys Res Commun. 2006;351:192–197. doi: 10.1016/j.bbrc.2006.10.020. [DOI] [PMC free article] [PubMed] [Google Scholar]
- 6.Tonelli R, Purgato S, Camerin C, Fronza R, Bologna F, Alboresi S, Franzoni M, Corradini R, Sforza S, Faccini A, Shohet JM, Marchelli R, Pession A. Anti-gene peptide nucleic acid specifically inhibits MYCN expression in human neuroblastoma cells leading to cell growth inhibition and apoptosis. Mol Cancer Ther. 2005;4:779–786. doi: 10.1158/1535-7163.MCT-04-0213. [DOI] [PubMed] [Google Scholar]
- 7.Tang XX, Robinson ME, Riceberg JS, Kim DY, Kung B, Titus TB, Hayashi S, Flake AW, Carpentieri D, Ikegaki N. Favorable neuroblastoma genes and molecular therapeutics of neuroblastoma. Clin Cancer Res. 2004;10:5837–5844. doi: 10.1158/1078-0432.CCR-04-0395. [DOI] [PubMed] [Google Scholar]
- 8.Diller L, Kassel J, Nelson CE, Gryka MA, Litwak G, Gebhardt M, Bressac B, Ozturk M, Baker SJ, Vogelstein B. p53 functions as a cell cycle control protein in osteosarcomas. Mol Cell Biol. 1990;10:5772–5781. doi: 10.1128/mcb.10.11.5772. [DOI] [PMC free article] [PubMed] [Google Scholar]
- 9.Tang XX, Zhao H, Robinson ME, Cohen B, Cnaan A, London W, Cohn SL, Cheung NK, Brodeur GM, Evans AE, Ikegaki N. Implications of EPHB6, EFNB2, and EFNB3 expressions in human neuroblastoma. Proc Natl Acad Sci USA. 2000;97:10936–10941. doi: 10.1073/pnas.190123297. [DOI] [PMC free article] [PubMed] [Google Scholar]
- 10.Ikegaki N, Kennett RH. Glutaraldehyde fixation of the primary antibody-antigen complex on nitrocellulose paper increases the overall sensitivity of immunoblot assay. J Immunol Methods. 1989;124:205–210. doi: 10.1016/0022-1759(89)90354-2. [DOI] [PubMed] [Google Scholar]
- 11.Ikegaki N, Bukovsky J, Kennett RH. Identification and characterization of the NMYC gene product in human neuroblastoma cells by monoclonal antibodies with defined specificities. Proc Natl Acad Sci USA. 1986;83:5929–5933. doi: 10.1073/pnas.83.16.5929. [DOI] [PMC free article] [PubMed] [Google Scholar]
- 12.James AC, Veitch JG, Zareh AR, Triche T. Sensitivity and specificity of five abundance estimators for high-density oligo-nucleotide microarrays. Bioinformatics. 2004;20:1060–1065. doi: 10.1093/bioinformatics/bth038. [DOI] [PubMed] [Google Scholar]
- 13.Tang XX, Evans AE, Zhao H, Cnaan A, London W, Cohn SL, Brodeur GM, Ikegaki N. High-level expression of EPHB6, EFNB2, and EFNB3 is associated with low tumor stage and high TrkA expression in human neuroblastomas. Clin Cancer Res. 1999;5:1491–1496. [PubMed] [Google Scholar]
- 14.Soengas MS, Alarcon RM, Yoshida H, Giaccia AJ, Hakem R, Mak TW, Lowe SW. Apaf-1 and caspase-9 in p53-dependent apoptosis and tumor inhibition. Science. 1999;284:156–159. doi: 10.1126/science.284.5411.156. [DOI] [PubMed] [Google Scholar]
- 15.Schuler M, Bossy-Wetzel E, Goldstein JC, Fitzgerald P, Green DR. p53 induces apoptosis by caspase activation through mitochondrial cytochrome c release. J Biol Chem. 2000;275:7337–7342. doi: 10.1074/jbc.275.10.7337. [DOI] [PubMed] [Google Scholar]
- 16.Zindy F, Eischen CM, Randle DH, Kamijo T, Cleveland JL, Sherr CJ, Roussel MF. Myc signaling via the ARF tumor suppressor regulates p53-dependent apoptosis and immortalization. Genes Dev. 1998;12:2424–2433. doi: 10.1101/gad.12.15.2424. [DOI] [PMC free article] [PubMed] [Google Scholar]
- 17.Moll UM, LaQuaglia M, Benard J, Riou G. Wild-type p53 protein undergoes cytoplasmic sequestration in undifferentiated neuroblastomas but not in differentiated tumors. Proc Natl Acad Sci USA. 1995;92:4407–4411. doi: 10.1073/pnas.92.10.4407. [DOI] [PMC free article] [PubMed] [Google Scholar]
- 18.Tweddle DA, Malcolm AJ, Bown N, Pearson AD, Lunec J. Evidence for the development of p53 mutations after cytotoxic therapy in a neuroblastoma cell line. Cancer Res. 2001;61:8–13. [PubMed] [Google Scholar]
- 19.Kung B, Zhao H, Hicks SL, Tang XX, Ikegaki N. Biological significance of EPHA2 expression in neuroblastoma. Int J Oncol. 2009;35:845–850. doi: 10.3892/ijo_00000398. [DOI] [PMC free article] [PubMed] [Google Scholar]
- 20.Dohn M, Jiang J, Chen X. Receptor tyrosine kinase EphA2 is regulated by p53-family proteins and induces apoptosis. Oncogene. 2001;20:6503–6515. doi: 10.1038/sj.onc.1204816. [DOI] [PubMed] [Google Scholar]
- 21.Jaboin J, Wild J, Hamidi H, Khanna C, Kim CJ, Robey R, Bates SE, Thiele CJ. MS-27-275, an inhibitor of histone deacetylase, has marked in vitro and in vivo antitumor activity against pediatric solid tumors. Cancer Res. 2002;62:6108–6115. [PubMed] [Google Scholar]
- 22.Cotterman R, Knoepfler PS. N-Myc regulates expression of pluripotency genes in neuroblastoma including lif, klf2, klf4, and lin28b. PLoS One. 2009;4:e5799. doi: 10.1371/journal.pone.0005799. [DOI] [PMC free article] [PubMed] [Google Scholar]
- 23.Wang F, Zhu Y, Huang Y, McAvoy S, Johnson WB, Cheung TH, Chung TK, Lo KW, Yim SF, Yu MM, Ngan HY, Wong YF, Smith DI. Transcriptional repression of WEE1 by Kruppel-like factor 2 is involved in DNA damage-induced apoptosis. Oncogene. 2005;24:3875–3885. doi: 10.1038/sj.onc.1208546. [DOI] [PubMed] [Google Scholar]
- 24.Chua YL, Ito Y, Pole JC, Newman S, Chin SF, Stein RC, Ellis IO, Caldas C, O'Hare MJ, Murrell A, Edwards PA. The NRG1 gene is frequently silenced by methylation in breast cancers and is a strong candidate for the 8p tumour suppressor gene. Oncogene. 2009;28:4041–4052. doi: 10.1038/onc.2009.259. [DOI] [PMC free article] [PubMed] [Google Scholar]
- 25.Attardi LD, Reczek EE, Cosmas C, Demicco EG, McCurrach ME, Lowe SW, Jacks T. PERP, an apoptosis-associated target of p53, is a novel member of the PMP-22/gas3 family. Genes Dev. 2000;14:704–718. [PMC free article] [PubMed] [Google Scholar]
- 26.Liu T, Laurell C, Selivanova G, Lundeberg J, Nilsson P, Wiman KG. Hypoxia induces p53-dependent transactivation and Fas/CD95-dependent apoptosis. Cell Death Differ. 2007;14:411–421. doi: 10.1038/sj.cdd.4402022. [DOI] [PubMed] [Google Scholar]


