Abstract
A polydimethylsiloxane (PDMS) microtunnel device with two wells is aligned and attached on top of a multi-electrode-array (MEA). Neurons are grown first in one well and allowed to propagate axons through the tunnels into a second well. After ten days cells are plated in the second well, with much lower likelihood of extending axons back to the first well, with the intent of creating unidirectional connectivity between populations of neurons in the two wells. Here we report electrophysiological evidence that supports the hypothesis that the dominant information flow is in the desired direction. This was done by measuring the propagation speed and direction of individual action potentials, with the result that 84% of the spikes propagated in the desired direction. Further, we recorded globally synchronized burst activity on each of the electrodes, identified the timing of the first spike on each electrode, recorded locally synchronized burst activity which is found only in the second well and does not propagate back to the first well, and concluded that this measure of burst propagation supports the hypothesis of a unidirectionally connected network. Two hypotheses are discussed for mechanism underlying the activity pattern of the particular neural networks.
1. Introduction
Neural cell cultures are used widely for purposes of understanding fundamental properties of how the brain computes. Intriguing is the possibility of controlling the connectivity of the network as a means to explore how geometric connectivity influences computational function. Considerable progress has been made, utilizing biophysically directed using laser, photoresist, microstamping and microfluidic techniques for patterning the chemical nature of a substrate, attempting to isolate very small numbers of neurons on highly restrictive paths (For a review: Wheeler and Brewer, 2010).
The recent development of microtunnel technology permits the design of structured networks at a very different spatial level wherein small populations of cells, each in its own well, communicate with other populations in other wells via the axons that occupy the tunnels. These are microlithographically defined successors to the chambers originated by Campenot, wherein axons grew along a scratched surface and underneath plastic septa that defined wells on a cover glass substrate (Campenot, 1977). Typical tunnels that are 3 μm by 10 μm in cross-section are too small for cell bodies but promote axonal extension, as demonstrated by Taylor et al., 2005, and repeated by a number of laboratories including our own. (Taylor et al., 2005; Dworak and Wheeler, 2009; Park et al., 2009; Berdichevsky et al., 2010; Shi et al., 2010). Commercial devices are now available. They are being applied to studies of axonal injury and regeneration (Taylor et al., 2005; Taylor et al., 2009), neuron-glia interaction (Park et al., 2009; Yang et al., 2009), axon myelination (Park et al., 2009), viral transport in axons (Liu et al., 2008), slice-to-slice communication (Berdichevsky et al., 2010) and axon guidance (Shi et al., 2010). Forerunners of the Taylor et al. technique include physical or chemical confinement, such as agarose micro-chambers and tunnels (Moriguchi et al., 2004) and parylene neurocages and tunnels (Tooker et al., 2005).
Microtunnel devices also can be used to investigate electrophysiological activity from neuronal networks or slices in intro. The devices can be integrated with not only conventional recording technologies such as patch clamp (Berdichevsky et al., 2010), but also new recording technologies such as multi-electrode arrays (MEAs) (Dworak and Wheeler, 2009; Claverol-Tinturé et al., 2005, 2007; Ravula et al., 2006, 2007a, 2007b). The MEA provides an ideal means of recording simultaneously from multiple neurons. In the open well area one records almost exclusively from the larger cell bodies; however within the exceptionally small tunnels, with their very large end-to-end resistance, it is common to record large potentials (50 to 100 μV) from small diameter axons (Dworak and Wheeler, 2009). The propagation of action potentials along axons within microtunnels can be recorded, with the result that the propagation speeds have been estimated to be 0.18–1.14 m/s (Dworak and Wheeler, 2009).
The activity recorded from neurons in microtunnel structures is a mixture of synchronous bursting and unsynchronized individual spikes. As our characterization of the recordable activity relies in part on burst analysis, we provide a brief review, highlighting some of the considerable progress that has been made in understanding synchronized bursting (Jimbo et al., 2000; Marom and Shahaf, 2002; Wagenaar et al., 2005). Two commonly recorded features are the location of the initiation of a burst and the pathway of its propagation. Feinerman et al. 2007 also show that burst initiation is correlated with higher neuronal density and fewer inhibitory neurons. For a given neuronal network, the sites of bursting often are correlated with pathway-specific activity (Maeda et al., 1995; Jimbo et al., 1999; Streit et al., 2001; Pan et al., 2009a, 2009b), implying that initiation location is a major factor that determines how and where a burst propagates. Furthermore, in randomly cultured networks, even if the initiation locations are the same, different bursts may propagate in a varied manner, involving different regions of the cultures. When one creates physically structured networks, the hope is that the signal propagation lies principally along predetermined pathways from network to network.
Unidirectional propagation has been shown in a microlithographically defined hippocampal culture network (Feinerman et al., 2008), where the unidirectionality results from preferential extension of axons along pattern edges and through a narrowing neck to a broad surface, rather than the reverse. In contrast, most microtunnel work to date has used tunnels that are narrow but symmetric for the two neural populations, thus not inducing unidirectionality.
In this report, unidirectionality is achieved by sequential plating, which generates a structured culture in which most of the axons extend from the first to the second well and not the reverse. Coupled neural networks are grown on MEAs integrated with microtunnel devices. The result is a structured network with two wells, each with a population of cells, connected via the axons traversing the tunnels, plus the ability to record from both wells and the tunnels. The new contribution is that we quantify the degree to which the network is unidirectional by detecting action potentials at two points with tunnels, enabling us to determine speed and direction of propagation, and the degree to which bursting behavior also propagates from one well to the other.
This report starts with our modified microfabrication technology using polydimethylsiloxane (PDMS) microtunnel devices to create the two-well, fifty-one tunnel device, which is specifically designed for compatibility with MEAs from a popular vendor (Multi Channel Systems, Inc.; MCS). The mold fabrication procedure includes novel features that reduce process complexity and increase yield, as compared to our previous work (Dworak and Wheeler, 2009). The report continues with cell culture preparation and analysis methods for determining spike and burst propagation direction and speed. The results include a statistical summary from which one can conclude that the structured networks are indeed highly unidirectional in spike propagation.
2. Materials and Methods
2.1. Microtunnel device fabrication
The devices were designed for the use with MCS MEAs which have 200 μm inter-electrode spacing. The mold fabrication process comprises the formation of two layers of SU-8 film: a first thin structure the height of the microtunnels and a second thicker structure for forming the culture wells, very similar to our earlier report (Dworak and Wheeler, 2009). We reordered the fabrication steps to permit alignment of the culture well mask to the microtunnel mold structures. Briefly, a standard 4-inch, single-side polished clean silicon wafer was treated on an HMDS hotplate for 1 min. Photoresist SU-8 2002 (Microchem, Inc.) was spun on at a nominal thickness of 3 μm, exposed with the first mask, post-exposure baked and developed. Then the alignment marks of the first SU-8 film on the wafer were covered by tape to prevent recoating during the next step. SU-8 2050 (Microchem, Inc.) was then spun on at a nominal thickness of 120 μm. Then the tape covering the alignment marks was removed and the wafer was soft-baked. The second mask was aligned with the alignment marks of the first SU-8 film and then the second SU-8 film was exposed, post-exposure baked and developed. This eliminates the commonly used but complex steps involved in the creation of intermediate metal alignment patterns (sputtering, photolithography and etching).
To prepare for casting followed by successful release of the PDMS tunnel devices, the wafer with the SU-8 mold was silanized in a vacuum chamber for 3 hours from an evaporated (tridecafluoro-1,1,2,2-tetrahydroocytl)-1-trichlorosilane solution. Mixed PDMS was poured on the wafer slowly and allowed to spread over the whole wafer, which was then put on a hotplate for curing (two hours at 70 °C). The cured PDMS layer was peeled off the wafer and stocked for later use.
A customized punch was used to punch two rectangular wells for culture and another smaller circular well was punched out to expose the reference electrode of a MEA. Finally, a 3 mm thick circular PDMS ring was placed around the entire device to form a chamber for holding cell culture media.
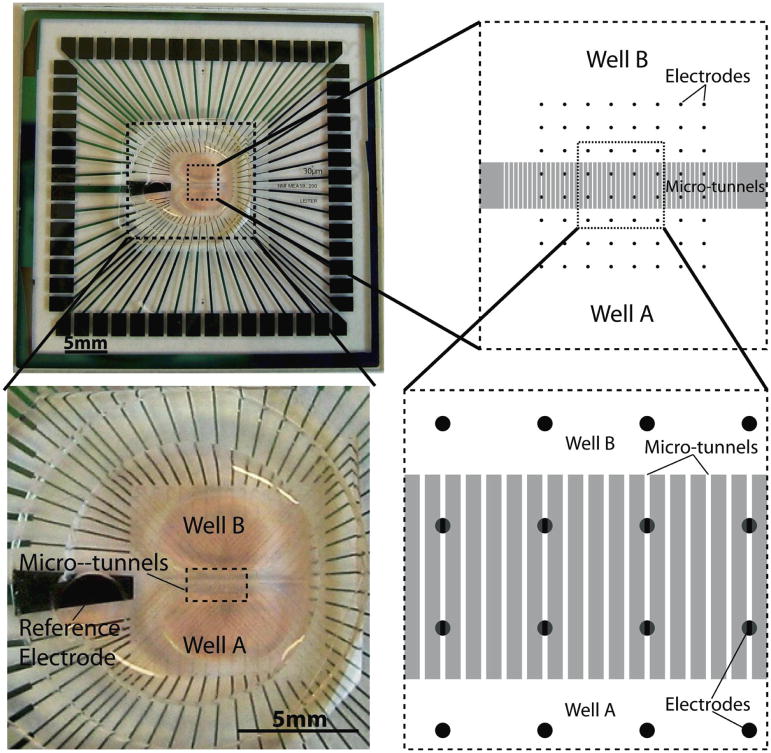
Before cell culture, the surfaces of MEAs and coverslips were coated overnight with poly-D-lysine (PDL) solution (100 μg/ml, diluted in borate buffer at pH of 8.5). Next day the surfaces were rinsed three times by sterilized DI water and then dried. Each device was aligned with an MEA by using a customized aligner (XYZ plus three angular rotations) in such a way that two rows of electrodes are underneath the microtunnels and each well has three rows of electrodes, as shown in the right panels of Figure 1. Pressure is applied to create a seal between the PDMS device and either a glass cover slip (whose less hydrophilic surface dictates using more pressure) or an MEA (which is more hydrophobic and requires less pressure). Failed seals lead to noticeable and quick media flow leaking between wells, while a successfully sealed device permits only slow fluid flow. For coverslips, no alignment is needed so the devices were simply attached with coverslips by hand.
Figure 1.
The left top panel shows a microtunnel PDMS device integrated with an MEA. The device is aligned to and seated on the MEA. The left bottom panel shows the enlarged view of the device. The right top and right bottom schematics show the internal configuration of the integration of a device and an MEA. After alignment, all the electrodes are divided into three groups, by location: Well A, microtunnel region and Well B.
Twenty μl of NeurobasalTM/B27/GlutaMAXTM (Invitrogen, Inc.) media was add in each culture well of a device. The MEAs and coverslips with devices were kept into an incubator at 5% CO2 and 37 °C for several hours before plating cells.
2.2. Cell culture
Embryonic E18 rat cortical tissue was purchased from BrainBits, Inc. (Springfield, Illinois, USA) and dissociated according to the vendor’s protocol. An MEA with microtunnel device was taken out of the incubator and the media was removed from the first well, which we name Well A. Immediately after, twenty μl of cell suspension (1,000,000 cells/ml in NeurobasalTM/B27/GlutaMAXTM media) was added to Well A yielding an area cell density of about 1,000 cells/mm2. Cells were plated on coverslips with devices in the same way. Next the MEAs and coverslips were placed in the incubator for 10 minutes, permitting the cells to attach to the surface. Then 300 μl media was added into the media chamber of each device, providing a reservoir large enough to withstand evaporation losses without significant pH change. Each MEA or coverslip and a 35 mm Petri dish filled with 3 mL of sterilized DI water were placed in a separate covered 100 mm Petri dish in order to minimize evaporation of the media. Then the MEAs and coverslips with devices were kept into an incubator at 5% CO2 and 37 °C. Half of the media was changed every three days. Ten days later, the media was removed everywhere except in Well A, and immediately after cells were plated in Well B with the same density as Well A. Ten minutes later 300 μl of media was added into each media chamber and all the devices were put back to the incubator. The ages of the cultures (days in vitro or DIV) in this report are all referred to the date of the initial plating in Well A. Recordings were made during DIV 5 to 30.
2.3. Recording
A commercial multichannel signal amplifier (MEA 1060, Multi Channel Systems, Inc.) with a gain of 1200× was used. Signals were sampled at a rate of 25 kHz by the software (MC_Rack v3.9.1, Multi Channel Systems, Inc.) with A/D conversion.
2.4. Analysis of the propagation of individual action potentials
Data for analysis were taken from six MEAs from which recordings were made during DIV 25 to DIV 30 after the initial plating of Well A. All spikes were detected using threshold crossing method using MC_Rack software from the raw data. Thresholds were set at 5 times the rms (standard deviation) noise level of the individual channels. The spikes in bursts with various waveforms from different units recorded by a single electrode temporally overlap so heavily that it is nearly impossible to identify units from the bursts. However, we identified many isolated individual spikes after manually removing the bursts from the recorded data sets. We applied the template matching method (Offline Sorter; Plexon, Dallas USA) to identify putative unique units, e.g. classes of similar spike waveforms distinctive from those of other classes, with the result that most electrodes sensed signals from several units. By analyzing the timings of the unit spikes from a pair of electrodes that lay in the same tunnel, we could determine the propagation speed and direction of each unit. A custom program was written in Matlab (The Mathworks Inc.) to do the analysis. As the electrodes are 200 μm apart and the propagation speeds should be in the range of 0.2–1 m/s (Dworak and Wheeler, 2009; Patolsky et al., 2006) the delay time between electrodes should be in the range +/− 1 ms. For each detected spike from a unit we conducted a search for a corresponding spike from on the other electrode within a window twice as wide, or +/− 2ms. This allowed us to identify spike-pairs, as well as paired units, of sufficient number (over the 7 electrode pairs per MEA) to run statistics. To test further whether or not a unit pair was from the same axon, we computed the cross-correlogram of all the spikes from the pair. The existence of a single sharp peak implied reproducible and stable time delays and hence that the unit pair was from the same axon.
2.5. Analysis of the propagation of bursts
Five of the MEAs had sufficient burst activity for burst analysis. The analysis of spontaneous bursts had as its main purpose the determination of where the bursts initiate and how they propagate across different regions of a whole integrated network. We first identified the time and electrode location of the first spike, which is presumed to initiate the burst. We then acquired statistics to determine how many bursts are initiated in Well A vs. Well B vs. the microtunnels, with the hypothesis that unidirectional propagation should lead to a preponderance of bursts being initiated in Well A.
A second analysis begins by identifying the first spike as above, plus the first spikes on the remaining electrodes. We then average the time delays from the overall first spike to the next five spikes in the Well A, to the next five spikes in Well B, and to the next five spikes in the microtunnels. These average delays are termed group delays in the results below. They help to identify the direction of propagation of bursts among the wells and tunnels and are intended to compensate for the incomplete sampling of activity from the many neurons in the culture.
3. Results
3.1. Microtunnel device integrated with an MEA
Devices were successfully fabricated and assembled on MEA’s as shown in figure 1. The two central rows of electrodes are underneath the microtunnels in order to record activities from the axons in the tunnels and the three rows of electrodes on each side are used to record signals of the neuronal network in each well.
3.2. Network culture
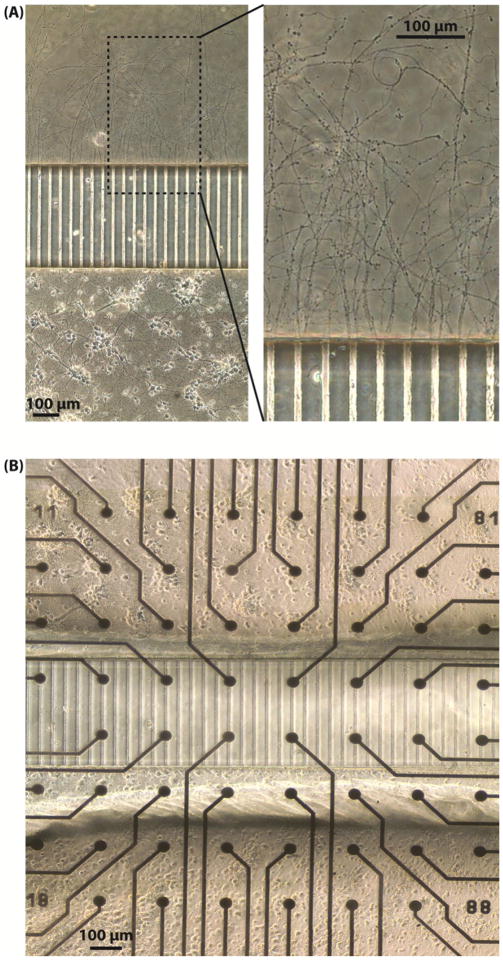
To confirm that the axons can grow through the microtunnels from Well A to Well B, cells were plated only in Well A of a device on a coverslip. The axons can be observed to reach Well B at approximately DIV 7 and to continue to extend as time passes. On DIV12, the segments of most axons are longer than 1mm, emerge from the microtunnels as bundles but disperse and extend and splay out from the openings into Well B, as shown in figure 2(A).
Figure 2.
(A) Unidirectional axons growing out of the microtunnels on a coverslip on DIV 12. Neurons were plated only in Well A and axons of the neurons grew through the microtunnels to reach Well B. Many axons were longer than 1 mm at this time point. The bundles of axons filled the openings of the microtunnels on the side of Well B, as shown in the enlarged view of the right panel. (B) Two neuronal networks connected with unidirectional axonal connections on an MEA. The network in Well B is connected with the network in Well A by axons throughout the microtunnels on the MEA. Cells were plated in Well A first and then in Well B ten days later. The cell bodies in both wells were separated by the microtunnels and connected by the unidirectional axons like those shown in A.
The confirmation of unidirectional growth of axons allows us to construct two networks with unidirectional axonal connections, as shown in figure 2(B). The two networks are separated by the PDMS barrier (under which the microtunnels run) and connected by the axons which sprout from the somata in Well A, grow through the microtunnels, extend and then form synapses with the neurons in Well B. It follows that action potentials, which propagate from neurons in Well A, along axons in microtunnels, then to neurons in Well B, can be detected by the electrodes underneath the axons.
3.3. Propagation direction and speed of spontaneous individual spikes
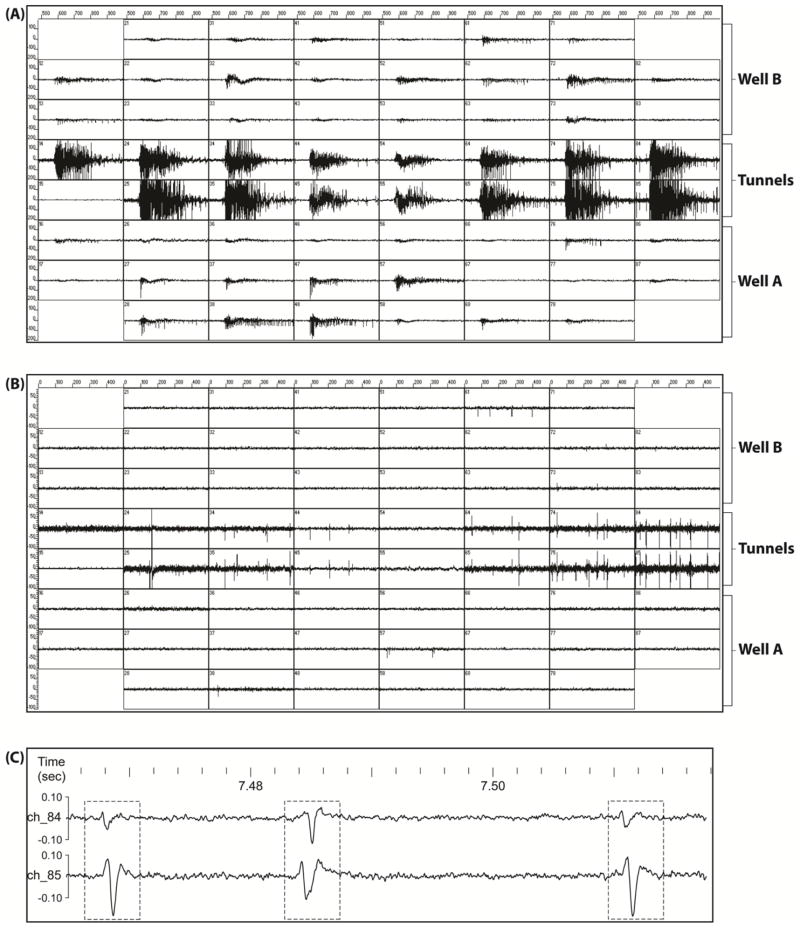
The individual spikes from neural somata in Well A and axons underneath microtunnels can be detected on DIV 7. After cells are plated in Well B, we detect individual spikes in Well B after another seven days (DIV17). The activities of both wells tend to be synchronized, implying that there is functional connectivity through the tunnels. Figure 3, taken on DIV 20, shows typical signals recorded from an MEA. Both synchronized bursting (figure 3(A)) and individual spikes (figure 3(B)) can be detected. High temporal resolution of the signals from tunnel electrodes shows propagation of the axonal spikes (figure 3(C)). During the inter burst intervals, individual spikes can be recorded from most of the electrodes underneath the microtunnels. High temporal resolution (figure 3(C)) shows that spikes on electrode pairs occur with very short time lag, indicating that they are likely due to propagation of spikes on axons. For some of the spikes, there are no corresponding spikes recorded by the other electrode, suggesting both that an axon may be isolated from an electrode in a tunnel and that there are some spikes that are missed by both electrodes. However, at an individual electrode we often recorded spikes with multiple amplitudes and waveform shapes suggesting that a single electrode can record from multiple axons. For example, figure 3(C) suggests that the first and third spike-pairs are from the same axon, while the middle spike pair is from a different axon with propagation in the opposite direction. Further, the amplitude and shape of the spike on one electrode varies substantially from its paired spike on the other electrode, suggesting considerable variation in position of the axon relative to the different electrodes, even within this highly confined space. Variation in axon geometry is also possible.
Figure 3.
Electrophysiological signals recorded from an MEA. The signals comprise two types of activities, individual spikes and synchronous bursts. (A) Spontaneous and synchronous bursts spreading throughout the whole network. (B) Individual spikes recorded during inter-burst intervals by electrodes in the region of microtunnels. Note the near simultaneity of spikes on each electrode-pair. (C) Enlarged view of the signals from an electrode-pair on channels 84 and 85. Three spike-pairs are indicated by the frames. The first and third spike-pairs are from the same unit-pair, and presumably the same axon. Each electrode signal box is +/− 200 μV and 500 msec, in A, +/− 100 μV and 500 msec in B, while the scales in C are +/−100 μV, with time in seconds.
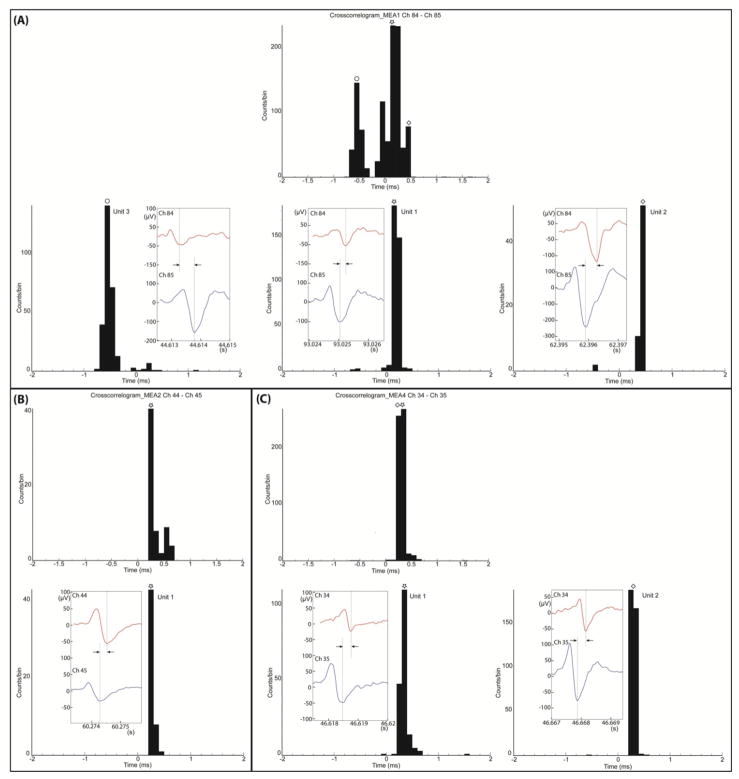
We investigated the number of individual units and their propagation speed and direction as recorded from six MEAs. Figure 4 shows examples of the analysis using signals from three electrode-pairs on different MEAs. First, a cross-correlogram for all spikes (not just the identifiable ones) on one electrode pair is shown (figure 4(A), top). After identifying units by spike sorting and by high temporal correlation, the waveforms for three identifiable spike-pairs are shown. The cross-correlogram for each of these spike-pairs shows a clear peak suggesting that the spike-pair comes from a single axon and that its delay time and hence conduction velocity can be measured. In the example of figure 4(A), the delays are 0.6 ms, 0.2 ms and 0.5 ms. Figure 4(B) shows an example where the original cross-correlogram has only one peak and only one identified unit can be extracted, with a time delay of 0.3 ms. In figure 4(C), there are two adjacent peaks on the raw data cross-correlogram and two identified units are extracted with time delays of 0.3 ms and 0.4 ms. Each inset shows an example of a waveform for each corresponding identified unit. Note the correspondences of the time delays between the cross-correlograms of mass data and the cross-correlograms of identified units or the insets in all cases. Also evident in this example is that one unit in figure 4(A) has a negative delay, indicating propagation in the direction opposite to the others and to the intended direction from Well A to Well B. The cross-correlograms for the identified units show very narrow peaks; approximately 90% of the time delays distribute within a 0.2 ms range, suggesting that time delay and hence propagation speed estimates are quite precise. Note that the sampling time is 40 μs, or one-fifth of the 0.2 ms range, providing for modest error; distortions in waveforms can cause other errors. More widely spread electrodes would improve the accuracy of the speed estimate.
Figure 4.
Analysis of propagation of individual spikes along axons. Results from three electrode-pairs that were on different MEAs. In each box (A, B, C), the upper panel is the cross-correlogram of all individual spikes detected on the two electrodes before spike sorting. The lower panels show cross-correlograms of different identified units extracted from the same electrode-pair after spike sorting. These cross-correlograms of identified units show the distribution of the time delays of spike-pairs. The insets present waveforms for the spike-pairs of the corresponding units. In the insets, the time delays are indicated by the distance between two lines and are consistent with the time values of the peaks of the cross-correlograms. (A) Top panel: cross-correlogram of individual spikes for electrode-pair 84 and 85. (MEA01) before spike sorting. Bottom panels: cross-correlograms and spike-pairs of three identified units. One unit, with negative delay, propagates from Well B to Well A, counter to the expected propagation direction shown by the other units. (B) Top panel: cross-correlogram of individual spikes for electrode-pair 44 and 45 (MEA02) before spike sorting. Bottom panel: a cross-correlogram and a spike-pair of the only identified units of the electrode-pair. For this unit, the propagation is from Well A to Well B as expected. (C) Top panel: cross-correlogram of individual isolated spikes for electrode-pair 34 and 35 (MEA04) before spike sorting. Bottom panels: cross-correlograms and spike-pairs of the two identified units of the electrode-pair. For both units, the propagation is from Well A to Well B as expected.
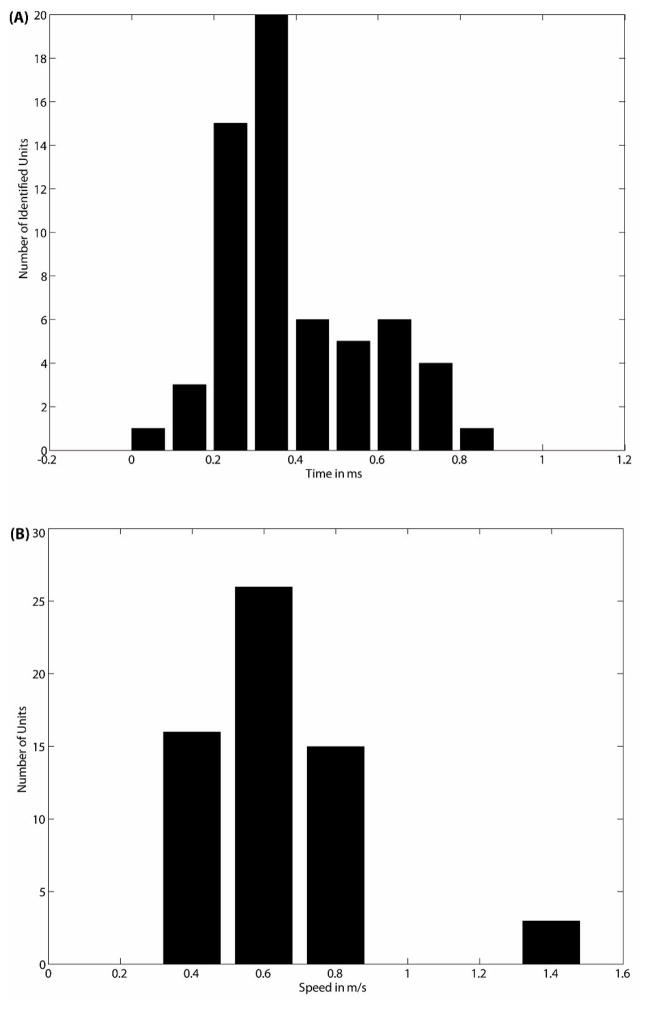
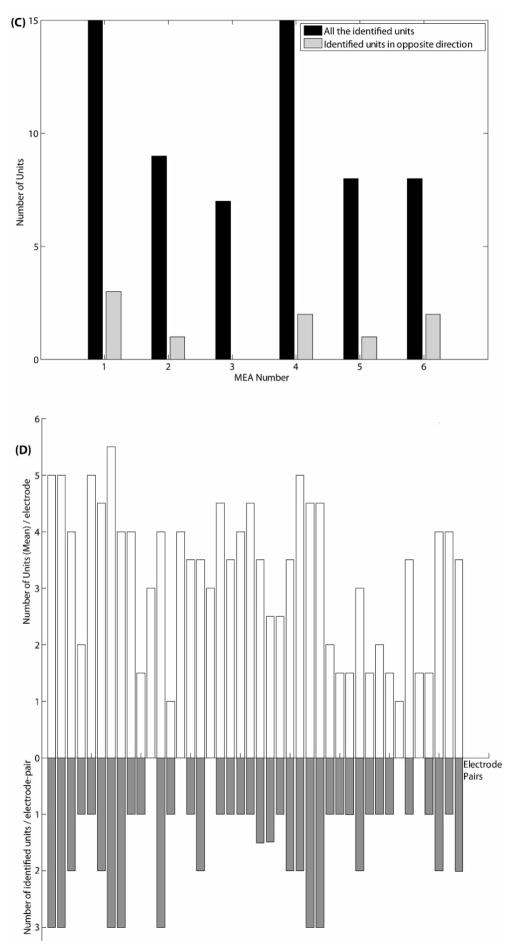
The histogram of time delays of all the identified units of six MEAs shows that the peak values of time delay from 57% axons are in the range of 0.3–0.4 ms, as shown in figure 5(A). After converting time delays to propagation speeds, the histogram presents a peak at the value of 0.6 m/sec, as shown in figure 5(B). As shown in figure 3(C) and figure 4(A), some identified units propagate in the opposite direction. Figure 5(C) reports the number of forward and reverse propagating signals for each array. Overall 84% propagate in the designed direction. Figure 5(D) gives a record of the number of recordable units per tunnel electrode (upward), which ranged from zero to six and one-half (13 units for the pair), and the number of recorded unit-pairs per tunnel (downward), for which the maximum was three. The latter is the number of axons from which recordings were made at both electrodes, permitting determination of speed and direction.
Figure 5.
(A) Histogram of time delays for all the identified units of six MEAs. (B) Histogram of propagation speeds for all the identified units of six MEAs. (C) For each MEA, the total number of identified units vs. the number of identified units with propagation in opposite direction. (D) For every electrode-pair, the number of the identified axon units (downward) and the average number of the sorted units (upward) recorded by single electrode.
3.4. Initiation and propagation of spontaneous bursts
Synchronous bursting in the tunnels and Well A can be detected as early as DIV 12. Synchronous bursting across both wells and tunnels can be detectable as early as DIV 22, twelve days after plating in Well B. It is assumed that bursts that initiate in Well A can propagate through the tunnel region and spread to Well B while the bursts initiating in Well B are much less likely to propagate back to Well A due to the mostly unidirectional axonal connections between the two wells. To test this hypothesis, we examined the synchronized bursts across the whole integrated network, anticipating that all the bursts would propagate from Well A to Well B. To test this, the locations of first spikes and the sequence of the subsequent first spikes on other electrodes are identified in order to quantify the likelihood of burst initiation by location (Well A, B or the tunnels) and the propagation direction.
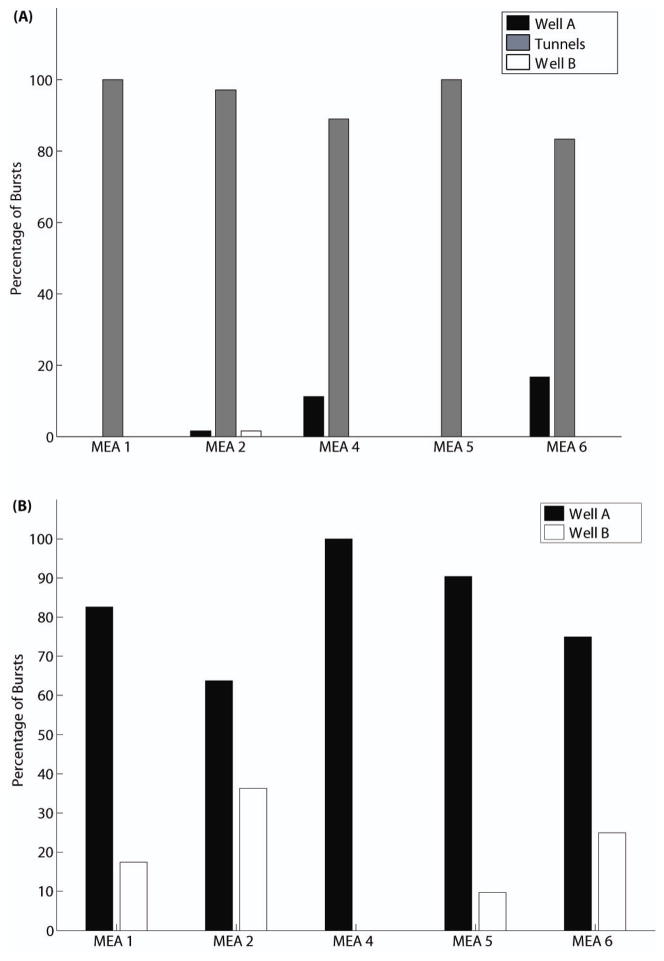
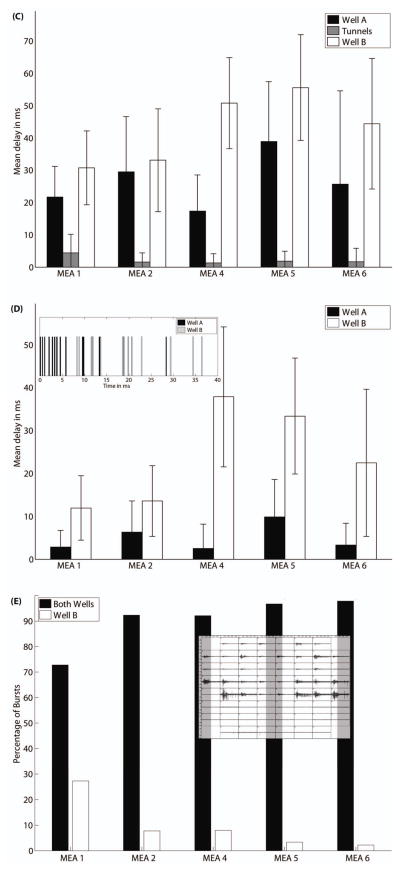
The results are not as intuitive as expected. Most commonly the first spike in a burst was recorded from a microtunnel and most likely from an axon, and not from the wells, for which somata provide most of the recordable spike signals (figure 6(A)). However, for most MEAs Well A’s first spike preceded Well B’s first spike (Figure 6(B)). Furthermore, the group delay (the average of the delay times to the first spikes on five electrodes) within the microtunnel region is shorter than for either well in all the five MEAs, as shown in figure 6(C). When the signals from the microtunnels are ignored, the group delay in Well A is shorter than to Well B in all the five MEAs, as shown in figure 6(D). The inset in figure 6(D) illustrates that the first spikes on Well A electrodes precede the first spikes on Well B electrodes. For this particular burst, eight electrodes in Well A were active before an electrode in Well B recorded a spike.
Figure 6.
(A) Percentage of bursts for which the first spike is found in each region for each MEA. (B) Same as A except the signals in the microtunnels are ignored, showing that Well A is the origin of more bursts than Well B. (C) For each region of each MEA, the average delay to the firing times of the next five spikes (group delay). (D) Same as C except the signals in the microtunnels are ignored, showing greater group delay for Well B. The inset is an example to show the temporal sequence of the first spikes of a burst in both wells. (E) The globally propagating bursts in both wells and local bursts only in Well B are compared in percentages for each MEA. The inset shows an example of a local burst from the same MEA from which the global burst in Figure 2(A) comes.
If we ignore the tunnel recordings (figures 6(B), (D)), we would conclude that bursts in Well A propagate to Well B. Surprising is that the tunnel data (figures 6(A), (C)) indicate that the earliest activity is recorded in the tunnels, presumably from axons, raising the question as to where do the bursts originate. This counterintuitive result is discussed below.
We recorded bursts that occurred in both wells and bursts that occurred in Well B only, but did not record bursts in Well A only. Some of the bursts in Well B propagate into the tunnels, but not into Well A, presumably as the reverse connection strength is too weak. Figure 6(E) documents the fraction of global (Wells A and B) vs. local (Well B only) bursts, and the inset shows an example of a local Well B burst. This result supports the conclusion that the networks are largely unidirectional.
4. Discussion
4.1 Spike amplitudes in tunnels are larger than in wells
We repeat here previous results (Dworak and Wheeler, 2009) that it is reasonable to expect very large signals from axons within tunnels. The tunnel dimensions (400μm x 10μm x 3μm (L x W x H)) and solution conductivity (approximately 72 Ω cm) yields theoretical resistances through a tunnel of 9.6 MΩ (end to end) and 1.8 MΩ from our electrodes (100 μm and 300 μm from the ends) to ground. Extrapolating from volume conductor theory of Clark and Plonsey (Clark and Plonsey, 1968), an axon could produce a 1.5 mV signal. Whereas we record signals up to 1 mV in the tunnels, but more commonly 150 μV. Our noise signals are also larger than in the wells. We note that our signals are larger on the edges of the array, which we correlate with our informal observation that our procedures lead to more tightly adhering tunnels in the periphery of the array, with very small fluid leakage – but perhaps significant electrical shunting – in the center. The signal to noise ratio remains similar in tunnels and wells, implying that the tunnel confinement increases the sensitivity to weak current sources, whether noise or signal.
4.2 Ephaptic effects?
We assume that there were an insignificant number of oligodendrocytes in the cultures since all the cells came from embryonic E18 rat cortical tissues, such cells are not obvious in the microscope and previous literature has not reported these cells; thus, we assume that the axons in the microtunnels were not myelinated. It is possible that the unmyelinated and juxtaposed axons could have an ephaptic effect on each other, as Clark and Plonsey’s modeling suggests an extracellular signal of at most 1.5 mV (Clark and Plonsey, 1968). However, we believe the effect is unlikely to be major or easily recorded, as MEA electrodes are effective for extracellular detection of action potentials but ineffective for subthreshold potentials, leading one to try to infer ephaptic effects from their possible influence on timing and waveshape.
4.3 Initial axonal growth inhibits subsequent reverse axon growth
We hypothesize that microtunnels become filled with axons that extend in an interwoven manner from target (Well A) to target (Well B). Previously we reported an increase in tunnel resistance with growth, supporting the hypothesis that the tunnel gradually fills with axons (Dworak and Wheeler 2009), which suggested to us that unidirectional axonal projection would be possible as the axons filled the tunnel, inhibiting reverse growth, which appears true. Our microscopy observations are that axons in microtunnels tend initially to grow along the edges of the tunnels, then fill the central area of the tunnel effectively interwoven so that an axon contacting one electrode may not contact the other and may be effectively insulated from it, explaining why the action potential shapes are different, why an electrode can sense signals from multiple axons, and why sometimes no signal is recorded. As the process is imperfect, we find 16% of axons conduct in the reverse direction, presumably because their somata are in Well B. Narrower tunnels may further restrict reverse axonal growth and signal propagation.
4.4 Burst delays
The results above suggest that bursts initiate in the microtunnel region and then spread towards both wells. We believe, from microscopic observation and the work of others, that it is very unlikely that there are somata in the axon dominated tunnels. Instead we believe that the bursts are dominantly initiated somewhere in Well A, as supported by figures 6B and 6D.
4.5 Undersampling of neural signals
We believe the apparent contradiction is explained by spatial undersampling of the spiking neurons within Well A. In part this hypothesis is that the conditions within the microtunnels make it comparatively quite likely for electrical activity to be recordable because the active axons are in very close proximity to electrodes in an environment where their extracellular signals to not attenuate rapidly with distance. For cells in the middle of open wells, the situation is quite different. Our previous estimates (Nam et al., 2004) are that no signal would be recorded from a soma unless is lay closer than 15 to 20 μm from an electrode, which is consistent with reports of 75 to 100 μm as the critical distance for recordings of pyramidal cells in vivo where resistivity is five times that of cell culture media (Henze et al., 2000). A simplistic calculation suggests that 30 μm diameter electrodes, with 15 μm wide annuli, occupy 7% of the area of the active area of an MEA, and thus that 7% is the likely upper limit on the fraction of recordable somata. That we almost always record bursts first in tunnels suggests that the efficiency of recording from axons in microtunnels is much higher.
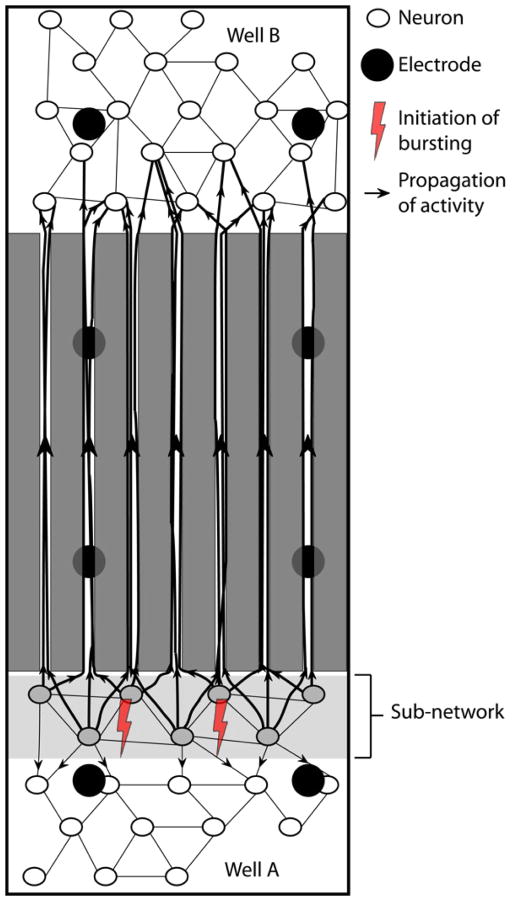
Figure 7 captures the idea of inadequate spatial sampling coupled with the idea that the bursts are actually initiated predominantly in a region (labeled subnetwork in figure 7) quite close to tunnels where no electrodes are positioned. Spikes propagate quite quickly from somata down the axons within the tunnels, constituting the recorded burst onset. With synaptic delays they propagate back into the rest of Well A as well as, sometime later, into Well B. The question arises as to why there might be an excitable subnetwork near the tunnels. In this study, an unintended component of the plating process of Well A resulted in greater density of neurons near the tunnels, enhancing the likelihood that the burst initiation zone is in the denser area (Feinerman et al. 2007) and thus closer to the tunnels. We speculate that the axons in the tunnels should originate predominantly from this subnetwork rather than from neurons further away, both by distance from the tunnels and by plating density. Thus we hypothesize the tunnel action potentials actually are reporting burst initiation preferentially from somata near the tunnels and that this subnetwork is the dominant source of burst initiation. However, it would be challenging to evaluate our assumptions as to density and likelihood of tunnel penetration with distance.
Figure 7.
Schematic of the network structure consistent with the burst onset timing in the two wells and the tunnels. The hypothesis is that bursts initiate in the denser sub-network then propagate back through well A and forward through the tunnels to well B. As noted in the text, our cultures were denser near the tunnels than in the rest of well A.
These observations also comprise a cautionary reminder that much, indeed most, of the activity in a neural culture is unrecordable with an MEA, much the same way that microprobe MEAs likely undersample from the brain in vivo. They underscore the potential impact of recording with very large numbers of electrodes, such as are newly coming available commercially (Imfeld et al., 2008).
5. Conclusion
We have achieved high degree of unidirectional electrophysiological connectivity supporting our previous report illustrating the technique microanatomically. This unidirectional connectivity is strongly supported by the results of the propagation direction of isolated spikes and somewhat less strongly by analysis of the propagation of bursting behavior. The anomalous recording of burst initiation seemingly from axons is explained by limited spatial sampling of electrical activity from somata in open wells versus from axons in the confined tunnels.
Acknowledgments
The authors would like to thank Bradley J. Dworak for his advice. This work was supported in part by National Institutes of Health research grant NS052233.
References
- Berdichevsky Y, Staley KJ, Yarmush ML. Building and manipulating neural pathways with microfluidics. Lab Chip. 2010;10:999–1004. doi: 10.1039/b922365g. [DOI] [PMC free article] [PubMed] [Google Scholar]
- Campenot RB. Local control of neurite development by nerve growth-factor. Proc Natl Acad Sci USA. 1977;4:4516–9. doi: 10.1073/pnas.74.10.4516. [DOI] [PMC free article] [PubMed] [Google Scholar]
- Clark J, Plonsey R. Exteacellular potential field of single active nerve fiber in a volume conductor. Biophysical J. 1968;8:842–64. doi: 10.1016/S0006-3495(68)86524-5. [DOI] [PMC free article] [PubMed] [Google Scholar]
- Claverol-Tinture E, Cabestany J, Rosell X. Multisite recording of extracellular potentials produced by microchannel-confined neurons in-vitro. IEEE Trans Biomed Eng. 2007;54:331–335. doi: 10.1109/TBME.2006.880903. [DOI] [PubMed] [Google Scholar]
- Claverol-Tinture E, Ghirardi M, Fiumara F, Rosell X, Cabestany J. Multielectrode arrays with elastomeric microstructured overlays for extracellular recordings from patterned neurons. J Neural Eng. 2005;2:L1–7. doi: 10.1088/1741-2560/2/2/L01. [DOI] [PubMed] [Google Scholar]
- Dworak BJ, Wheeler BC. Novel MEA platform with PDMS microtunnels enables the detection of action potential propagation from isolated axons in culture. Lab Chip. 2009;9:404–410. doi: 10.1039/b806689b. [DOI] [PMC free article] [PubMed] [Google Scholar]
- Eckmann JP, Moses E, Stetter O, Tlusty T, Zbinden C. Leaders of neuronal cultures in a quorum percolation model. Front Comp Neurosci. 2010;4:132. doi: 10.3389/fncom.2010.00132. [DOI] [PMC free article] [PubMed] [Google Scholar]
- Eytan D, Marom S. Dynamics and effective topology underlying synchronization in networks of cortical neurons. J Neurosci. 2006;26:8465–8476. doi: 10.1523/JNEUROSCI.1627-06.2006. [DOI] [PMC free article] [PubMed] [Google Scholar]
- Feinerman O, Segal M, Moses E. Identification and dynamics of spontaneous burst initiation zones in unidimensional neuronal cultures. J Neurophysiol. 2007;97:2937–2948. doi: 10.1152/jn.00958.2006. [DOI] [PubMed] [Google Scholar]
- Feinerman O, Rotem A, Moses E. Reliable neuronal logic devices from patterned hippocampal cultures. Nat Phys. 2008;4:967–973. [Google Scholar]
- Henze DA, Borhegyi Z, Csicsvari J, Mamiya A, Harris KD, Buzsaki G. Intracellular features predicted by extracellular recordings in the hippocampus in vivo. J Neurophysiol. 2000;84:390–400. doi: 10.1152/jn.2000.84.1.390. [DOI] [PubMed] [Google Scholar]
- Imfeld K, Neukom S, Maccione A, Bornat Y, Martinoia S, Farine PA, Koudelka-Hep M, Berdondini L. Large-scale, high-resolution data acquisition system for extracellular recording of electrophysiological activity. IEEE Trans Biomed Eng. 2008;55:2064–2073. doi: 10.1109/TBME.2008.919139. [DOI] [PubMed] [Google Scholar]
- Jimbo Y, Tateno T, Robinson HPC. Simultaneous induction of pathway-specific potentiation and depression in networks of cortical neurons. Biophysical J. 1999;76:670–8. doi: 10.1016/S0006-3495(99)77234-6. [DOI] [PMC free article] [PubMed] [Google Scholar]
- Jimbo Y, Kawana A, Parodi P, Torre V. The dynamics of a neuronal culture of dissociated cortical neurons of neonatal rats. Biol Cybern. 2000;83:1–20. doi: 10.1007/PL00007970. [DOI] [PubMed] [Google Scholar]
- Liu WW, Goodhouse J, Jeon NL, Enquist LW. A microfluidic chamber for analysis of neuron-to-cell spread and axonal transport of an Alpha-Herpesvirus. Plos One. 2008;3:e2382. doi: 10.1371/journal.pone.0002382. [DOI] [PMC free article] [PubMed] [Google Scholar]
- Maeda E, Robinson HPC, Kawana A. The mechnisms of generation and propagation of synchronized bursting in developing networks of cortical neufrons. J Neurosci. 1995;15:6834–45. doi: 10.1523/JNEUROSCI.15-10-06834.1995. [DOI] [PMC free article] [PubMed] [Google Scholar]
- Marom S, Shahaf G. Development, learning and memory in large random networks of cortical neurons: lessons beyond anatomy. Q Rev Biophys. 2002;35:63–87. doi: 10.1017/s0033583501003742. [DOI] [PubMed] [Google Scholar]
- Moriguchi H, Takahashi K, Sugio Y, Wakamoto Y, Inoue I, Jimbo Y, Yasuda K. On-chip neural cell cultivation using agarose-microchamber array constructed by a photothermal etching method. Electrical Engineering in Japan. 2004;146:37–42. [Google Scholar]
- Nam Y, Chang J, Khatami D, Brewer GJ, Wheeler BC. Patterning to enhance activity of cultured neuronal networks. IEE Proc Nanobiotechnol. 2004;151:109–115. doi: 10.1049/ip-nbt:20040706. [DOI] [PubMed] [Google Scholar]
- Pan L, Song X, Xiang G, Wong A, Xing W, Cheng J. First-spike rank order as a reliable indicator of burst initiation and its relation with early-to-fire neurons. IEEE Trans Biomed Eng. 2009a;56:1673–82. doi: 10.1109/TBME.2009.2015652. [DOI] [PubMed] [Google Scholar]
- Pan L, Song X, Xiang G, Zhu J, Cheng J. Effect of disinhibition on spatiotemporal pattern of neuronal first recruitment in neuronal networks. Progress in Natural Science. 2009b;19:615–21. [Google Scholar]
- Park J, Koito H, Li JR, Han A. Microfluidic compartmentalized co-culture platform for CNS axon myelination research. Biomed Microdevices. 2009;11:1145–53. doi: 10.1007/s10544-009-9331-7. [DOI] [PMC free article] [PubMed] [Google Scholar]
- Patolsky F, Timko BP, Yu GH, Fang Y, Greytak AB, Zheng GF, Lieber CM. Detection, stimulation, and inhibition of neuronal signals with high-density nanowire transistor arrays. Science. 2006;313:1100–4. doi: 10.1126/science.1128640. [DOI] [PubMed] [Google Scholar]
- Ravula SK, McClain MA, Wang MS, Glass JD, Frazier AB. A multielectrode microcompartment culture platform for studying signal transduction in the nervous system. Lab Chip. 2006;6:1530–6. doi: 10.1039/b612684g. [DOI] [PubMed] [Google Scholar]
- Ravula SK, Wang MS, Asress SA, Glass JD, Frazier AB. A compartmented neuronal culture system in microdevice format. J Neurosci Methods. 2007a;159:78–85. doi: 10.1016/j.jneumeth.2006.06.022. [DOI] [PubMed] [Google Scholar]
- Ravula SK, Wang MS, McClain MA, Asress SA, Frazier AB, Glass JD. Spatiotemporal localization of injury potentials in DRG neurons during vincristine-induced axonal degeneration. Neurosci Lett. 2007b;415:34–9. doi: 10.1016/j.neulet.2007.01.009. [DOI] [PMC free article] [PubMed] [Google Scholar]
- Shi P, Nedelec S, Wichterle H, Kam LC. Combined microfluidics/protein patterning platform for pharmacological interrogation of axon pathfinding. Lab Chip. 2010;10:1005–10. doi: 10.1039/b922143c. [DOI] [PMC free article] [PubMed] [Google Scholar]
- Streit J, Tscherter A, Heuschke MO, Renaud P. The generation of rhythmic activity in dissociated cultures of rat spinal cord. Eur J Neurosci. 2001;14:191–202. doi: 10.1046/j.0953-816x.2001.01636.x. [DOI] [PubMed] [Google Scholar]
- Taylor AM, Blurton-Jones M, Rhee SW, Cribbs DH, Cotman CW, Jeon NL. A microfluidic culture platform for CNS axonal injury, regeneration and transport. Nat Methods. 2005;2:599–605. doi: 10.1038/nmeth777. [DOI] [PMC free article] [PubMed] [Google Scholar]
- Taylor AM, Berchtold NC, Perreau VM, Tu CH, Jeon NL, Cotman CW. Axonal mRNA in uninjured and regenerating cortical mammalian axons. J Neurosci. 2009;29:4697–707. doi: 10.1523/JNEUROSCI.6130-08.2009. [DOI] [PMC free article] [PubMed] [Google Scholar]
- Tooker A, Meng E, Erickson J, Tai YC, Pine J. Biocompatible parylene neurocages. IEEE Eng Med Bio Mag. 2005;24:30–3. doi: 10.1109/memb.2005.1549727. [DOI] [PubMed] [Google Scholar]
- Wagenaar DA, Madhavan R, Pine J, Potter SM. Controlling bursting in cortical cultures with closed-loop multi-electrode stimulation. J Neurosci. 2005;25:680–8. doi: 10.1523/JNEUROSCI.4209-04.2005. [DOI] [PMC free article] [PubMed] [Google Scholar]
- Wheeler BC, Brewer GJ. Designing neural networks in culture. Proceddings of the IEEE. 2010;98:398–406. doi: 10.1109/JPROC.2009.2039029. [DOI] [PMC free article] [PubMed] [Google Scholar]
- Yang YJ, Gozen O, Watkins A, Lorenzini I, Lepore A, Gao YZ, Vidensky S, Brennan J, Poulsen D, Park JW, Jeon NL, Robinson MB, Rothstein JD. Presynaptic regulation of astroglial excitatory neurotransmitter transporter GLT1. Neuron. 2009;61:880–94. doi: 10.1016/j.neuron.2009.02.010. [DOI] [PMC free article] [PubMed] [Google Scholar]


