

Abstract
Objective
Acute kidney injury (AKI) affects 5–7% of all hospitalized patients with a much higher incidence in the critically ill. The Acute Kidney Injury Network proposed a definition in which serum creatinine rises (>0.3mg/dl) and/or oliguria (<0.5/ml/kg/h) for a period of 6 hours are used to detect AKI. Accurate urine output measurements as well as serum creatinine values from our database were used to detect patients with AKI and calculate their corresponding mortality risk and length of stay.
Design
Retrospective cohort study.
Setting
7 intensive care units at, a large, academic, tertiary medical center.
Patients
Adult patients without evidence of end stage renal disease, with more than 2 creatinine measurements and at least a 6 hours urine output recording, who were admitted to the ICU between 2001 and 2007.
Interventions
Medical records of all the patients were reviewed. Demographic information, lab results, charted data, discharge diagnoses, physiological data and patient outcomes were extracted from the MIMIC-II database using a SQL query.
Measurements and main results
From 19,677 adult patient records, 14,524 patients met the inclusion criteria. 57% developed AKI during their ICU stay. In-hospital mortality rates were: 13.9%, 16.4%, 33.8% for AKI 1, 2 and 3 respectively compared to only 6.2% in patients without AKI (p<0.0001). After adjusting for multiple covariates AKI was associated with increased hospital mortality (OR 1.4 and 1.3 for AKI1 and AKI2 and 2.5 for AKI3; p<0.0001). Using multivariate logistic regression, we found that in patients who developed AKI, urine output alone was a better mortality predictor than creatinine alone or the combination of both.
Conclusions
More than 50% of our critically ill patients developed some stage of AKI resulting in stage-wise increased mortality risk. However, the mortality risk associated with AKI stages 1 and 2 does not differ significantly. In light of these findings reevaluation of the AKIN staging criteria should be considered.
Keywords: Acute Kidney Injury, Epidemiology, Incidence, outcome, Urinary output, creatinine, critical care
Acute Kidney Injury (AKI) affects 5–7% of all hospitalized patients [1], with a much higher incidence in the critically ill. Although AKI carries considerable morbidity and mortality[1–2] more than 35 definitions of AKI have been used in the literature. This results in confusion as well as an ill defined association between acute renal dysfunction and morbidity and mortality [2–3]. Hence, in 2002 the Acute Dialysis Quality Initiative (ADQI) defined universal AKI criteria for the first time [4]. This definition was the first consensus classification to integrate both urine output and creatinine measurements. The ADQI definition resulted in extensive debate about its prediction of outcomes [5–8] and did not include a complete definition for Renal Replacement Therapy (RRT). Therefore, in 2005 it was revised by the Acute Kidney Injury Network (AKIN), using more updated serum creatinine and urine output criteria and including information regarding RRT. Furthermore, the definition of time to occurrence of kidney injury was narrowed from 7 days to 48 hours, emphasizing the acute nature of this disorder [9]. In recent years, two large multicenter studies have been performed to validate this relatively new classification: The SAPS3 Hospital Outcome Cohort having data from 303 intensive care units [10] and the Riyadh Intensive Care Program database with data from 22 intensive care units [11]. Both of these studies demonstrated an increased morbidity and mortality associated with the development of AKI. However, both used modified AKIN criteria and neither employed accurate urine output measurement for the detection of AKI.
Recently an American Thoracic Society statement aimed to prevent the development of AKI[12] by emphasizing the significance of the urine output measurement in the continuous evaluation of critically ill patients to facilitate early detection of AKI. The Multiparameter Intelligent Monitoring in Intensive Care II (MIMIC-II) database [13], unlike the 2 databases used in the above studies, has high resolution urine measurements and can therefore more accurately detect the development of the various stages of AKI.
We designed a study aimed to estimate the risk for morbidity and mortality of patients who developed AKI solely using the large cohort of critically ill patients from the MIMIC - II database. Our study was designed to test the hypothesis that occurrence of AKI would predict mortality in critically ill patients and that varying stages of AKI (detected by applying the AKIN criteria) would yield different levels of attributable mortality. Such data are critical to the validation of the AKI definition criteria; for example, if the inclusion of oliguria did not improve predictive value beyond creatinine rise, then one might argue to refine the definition based on creatinine alone.
Methods
The MIMIC-II database
The MIMIC-II project was approved by the Institutional Review Boards of the Massachusetts Institute of Technology (MIT) and Beth Israel Deaconess Medical Center (BIDMC) and granted a waiver of informed consent. The MIMIC-II database includes physiologic information from bedside monitors in seven adult ICUs of BIDMC a large, academic, tertiary medical center in Boston, Massachusetts. These data (heart rate, blood pressure, etc.) were validated by ICU nurses on an hourly basis. The database also contains records of all lab values, nursing progress notes, IV medications, fluid intake/output, and other clinical variables. Other clinical data were added to the database including pharmacy provider order entry (POE) records, admission and death records, discharge summaries, ICD-9 codes, imaging and ECG reports. The database also contains bedside monitor waveforms and their associated derived parameters which were not investigated in this research. The database includes patients admitted between 2001 and 2007 and is maintained by researchers at the Harvard-MIT Division of Health Sciences and Technology (details at http://physionet.org/mimic2).
Inclusion and Exclusion criteria
We included all adult patients, with ICU length of stay of more than 24 hours, who had at least 2 serum creatinine measurements and at least one 6 hours urine output observation period (see “Definition of Acute Kidney Injury”).
Patients who underwent RRT on the day of or prior to their hospital admission, or who had a first serum creatinine level of >4 mg/dL were categorized as having end-stage renal disease (ESRD), and therefore were excluded. Patients were also excluded if they had an ICD-9 code for ESRD. Since the MIMIC-II database did not have a specific coding system for RRT, patients were considered to have undergone RRT if they had the words “end stage renal disease” or “dialysis” (or equivalent i.e. CVVH, CVVHD, RRT etc.) in text notes on the day of admission. In order to validate this text search, sampling of 100 patients was performed. In 98% (95%CI 95.3 – 100) of the sampled cases the patients indeed underwent RRT on the day of admission.
Definition of Acute Kidney Injury
We classified our patients into 3 classes according to AKIN criteria [9](Table 1). The AKIN class was determined by using serum creatinine measurements from lab reports, and urine output (UO) measurements that were recorded, as a part of the nursing flow sheet. In general, urine output measurements are entered hourly and the AKI criteria require urine output over a six hour window. To account for absences from the ICU and mis-entered information, the total urine output over the window was determined in two steps. First take a six hour period following each urine output measurement having at least three additional measurements. Second, calculate the weight-normalized total urine output during this 6 hour period.
Table 1.
| Stage | Serum creatinine criteria | Urine output criteria |
|---|---|---|
| 1 | ↑serum creatinine ≥ 0.3mg/dl (≥26.4μmol/l) or ↑ 150–200% (1.5 to 2-fold) from baseline | <0.5 ml/kg/h for more than 6h |
| 2 | ↑ serum creatinine 200–300% (>2 to 3-fold) from baseline | <0.5 ml/kg/h for more than 12h |
| 3 | ↑ serum creatinine >300% (>3-fold) from baseline or serum creatinine ≥ 4 mg/ml (≥ 354μmol/l) with an acute increase of at least 0.5 mg/ml (44μmol/l) Or need for RRT. | <0.3 ml/kg/h for more than 24h or Anuria for 12h |
The patients AKI stage depends on the worst stage definition from the urine output criteria or serum creatinine criteria [e.g. an anuric patient (urine criteria stage 3) with an increase of 1.5 in creatinine (serum creatinine criteria stage 1) will have an overall AKI stage 3]
Since our database did not include the pre-admission serum creatinine level of the patients, we considered the lowest serum creatinine level of a patient to be equivalent to the patient’s pre-hospital baseline serum creatinine level. The worst serum creatinine increase or urine outputs were examined in 48 hour periods. The most severe acute kidney injury stage (from urine outputs or creatinine measurements which ever was more severe) was recorded for every patient. Patients who received some kind of renal replacement therapy were classified as AKI3 (AKIN criteria).
Data collection
All data were extracted from the MIMIC-II database (v2.5). The extracted data included demographic information (e.g. age, sex) as well as clinical information from lab results (e.g., serum creatinine and arterial blood gases), nursing-charted data (e.g. urine output) and discharge diagnoses (ICD-9 codes). Physiological data were collected only during the ICU stay, unlike lab results which were available throughout the whole hospitalization.
Physiological data including heart rate, blood pressure, respiratory rate, length of mechanical ventilation, neurological status (GCS) as well as non-renal-Sequential Organ Failure Assessment (SOFA) scores [14](calculated SOFA score excluding the renal component) were computed and reported.
Recorded outcomes such as mortality and length of stay were also extracted from the same database.
Statistical analysis
STATA 11.1 (StataCorp, Collage Station, TX) was used for all statistical analysis. All continuous variables were expressed either as mean ± standard error (SE) and 95% confidence interval (CI) or as median and inter-quartile (Q1–Q3).
For the univariate analysis, we used the Chi-square tests, t- tests, Kruskal-Wallis one-way analysis of variance and Mann-Whitney U-test to evaluate statistical significance. All tests were two-sided, and a p value of < 0.05 was considered significant.
For the multivariate analysis, we performed a logistic regression analysis with a dependent variable of in-hospital mortality and ICU mortality. The following covariates included in the models were considered to be related to mortality and morbidity in critically ill patients: age, gender, SOFA scores, AKI stage and co-morbidity groups taken from ICD-9cm codes using the Elixhauser’s co-morbidity index [15] (groups were: disease of the respiratory, gastrointestinal, and circulatory systems as well as infectious diseases, malignancy, diabetes mellitus, gastrointestinal bleeding, coronary artery disease (CAD), congestive heart failure (CHF), peripheral vascular disease (PVD), cirrhosis and gastrointestinal bleeding) After controlling for co-linearity, we applied a stepwise (forward and backward) selection of the covariates, the covariate that were used in our logistic regression analysis were: Age, SOFA score on admission, diseases of the respiratory and gastro-intestinal systems, sepsis, cirrhosis, gastrointestinal bleeding, malignancy, CHF, DM, CAD, PVD.
We analyzed hospital survival across groups using the Kaplan-Meier methods, and we tested differences between groups using the log-rank test.
Results
The MIMIC-II database contains the records of 26,510 patients of whom 19,677 were adults aged 15 or more at the time of admission. 630 patients were excluded because they were considered to have had ESRD prior to their ICU admission; of these patients, 327 were excluded by the text search of the medical notes and 303 due to the presence of an ICD-9 code for ESRD. 1,755 patients were excluded because they did not have sufficient creatinine measurements or their length of stay was 1 day or less and 2,768 because they did not have sufficient urine output recordings (Figure 1).
Figure 1.
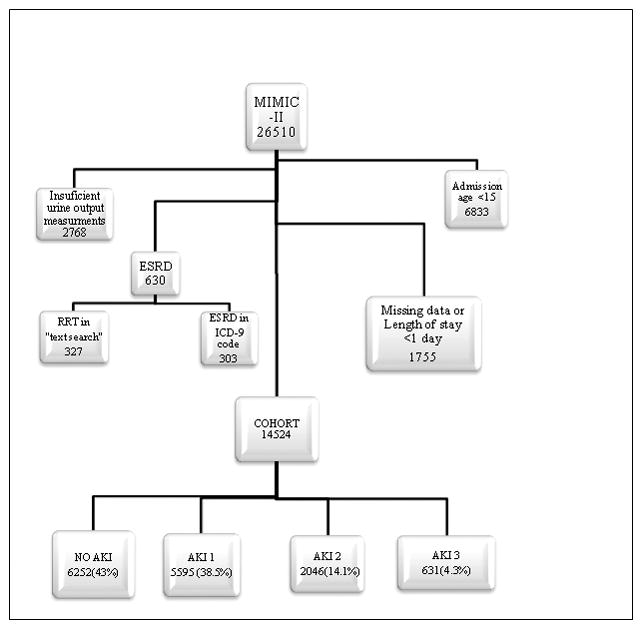
Patient distribution from the MIMIC-II database 14524 patients were classified using a combination of urine output and creatinine measurements.
The final analytic cohort, therefore, contained 14,524 patients, of which 6161 were females (42%). The median age on admission was 65.8 years (Q1–Q3 55.2–77.8). The median SOFA score (non-renal) on admission was 5 (Q1–Q3 2–8) (Table 2). 57% of the patients developed AKI during their ICU stay. AKI 1 was the most frequent (38.5%) followed by AKI 2 (14.1%) and AKI 3 (4.3%). The overall in-hospital and ICU mortality rates were 11.8% and 9% respectively. Hospital mortality rates were higher in patients with AKI (16% vs. 6.7%; p<0.0001) than in patients with no AKI. The same was found for ICU mortality rates (12.4% vs. 4.8%; p<0.0001). The univariate in-hospital mortality odds ratios were 2.41, 2.95, and 7.64 for AKI 1, AKI 2, and AKI 3 patients, respectively, compared to patients with no AKI (p<0.0001 for all). The multivariate logistic regression model included age, admission SOFA score (without renal component), diseases of the respiratory and gastrointestinal systems, sepsis, cirrhosis, gastrointestinal bleeding, malignancy, CHF, DM, CAD, and PVD (Table 3). Patients with AKI 1 and AKI 2, compared to patients without AKI, had a 30% increase in the odds of death (AKI 1: OR 1.38, 95% CI 1.2–1.59, p<0.0001; AKI 2: OR 1.26, 95% CI 1.06–1.5, p=0.01), patients with AKI 3 were 2.5 times more likely to die (95% CI 1.98–3.12, p<0.0001) (Table 3). The 28-day Kaplan-Meier survival plot (Figure 2) clearly shows a diversion of the survival rates among the 3 different AKI stages {Logrank (Mantel-Cox) test p<0.0001}, because the survival probability of AKI 1 patients is again similar to that of AKI 2 patients, one could question the existence of 2 separate groups.
Table 2.
Characteristics of patient cohort, grouped by degree of kidney injury
| Overall cohort | No AKI | AKI 1 | AKI 2 | AKI3 | |
|---|---|---|---|---|---|
| Total, n (%) | 14,524 | 6252(43) | 5595(38.5) * | 2046 (14.1)* | 631(4.3)* |
| Age, years: Median (Q1–Q3) | 65.8(55.2–77.8) | 61.7(48.6–75.7) | 68.8 (55.6–79.2)* | 68.8 (56.5–78.6)* | 65.2 (52–76.5)* |
| Sex, n: Female (%) | 6161(42.4) | 2546 (40.7) | 2321 (42.5)* | 1000 (48.9)* | 294 (46.6)* |
| SOFA(non–renal): Median (Q1–Q3) | 5(2–8) | 3(1–7) | 6(3–8)* | 7(4–9)* | 7(5–10)* |
p <0.001 for AKI 1/2/3 vs. No AKI
Table 3.
Impact of covariates on in-hospital AKI relates mortality (Multivariate logistic regression analysis)
| Covariate | Odds ratio | 95% confidence interval | P (Chi-Square) |
|---|---|---|---|
| Age, per year | 1.037 | 1.033–1.041 | <0.0001 |
| Sepsis | 1.997 | 1.698–2.349 | <0.0001 |
| CHF | 1.211 | 1.071–1.369 | 0.002 |
| CAD | 0.464 | 0.408–0.527 | <0.0001 |
| Respiratory | 2.124 | 1.878–2.402 | <0.0001 |
| Gastrointestinal | 0.686 | 0.598–0.787 | <0.0001 |
| Gastrointestinal bleeding | 1.930 | 1.512–2.464 | <0.0001 |
| cirrhosis | 3.073 | 2.448–3.858 | <0.0001 |
| Malignancy | 1.709 | 1.489–1.960 | <0.0001 |
| DM | 0.792 | 0.679–0.924 | 0.003 |
| Admission SOFA score (non renal) | 1.163 | 1.143–1.183 | <0.0001 |
| No AKI (reference group) | 1 | ||
| AKI1 | 1.380 | 1.201–1.586 | <0.0001 |
| AKI2 | 1.259 | 1.058–1.499 | 0.01 |
| AKI3 | 2.484 | 1.979–3.119 | <0.0001 |
Figure 2.
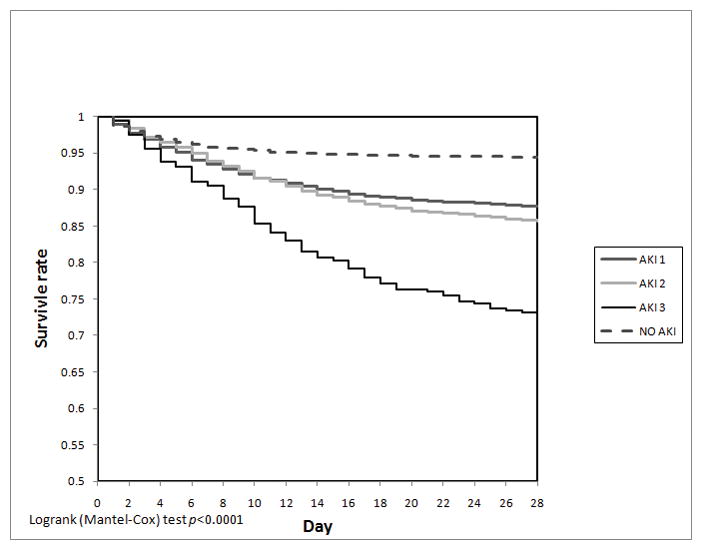
Kaplan-Meier survival plot for 28 day in-hospital mortality divided by AKI stages.
Analysis of ICU mortality rates was similar to in-hospital mortality rates. In univariate analysis, the odds ratios for ICU mortality were 2.35, 3.2 and 9.2 for AKI 1, 2 and 3, respectively, compared to patients with no AKI (p<0.0001). When we applied the same multivariate logistic regression model as for the in-hospital mortality, the odds ratios for ICU mortality were increased to 1.27 for AKI 1 and AKI 2, and 3.7 for AKI 3, compared to patients with no AKI (p<0.0001) (Table 4).
Table 4.
In-hospital and ICU Mortality
| In-hospital Mortality* | ICU Mortality | |||||
|---|---|---|---|---|---|---|
| rate (%) | Univariate odds ratio | Multivariate odds ratio* | rate (%) | Univariate odds ratio | Multivariate odds ratio | |
|
| ||||||
| NO AKI | 6.25 | 4.54 | ||||
|
| ||||||
| AKI 1 | 13.87 | 2.41 | 1.38 | 10.06 | 2.35 | 1.27 |
|
| ||||||
| AKI 2 | 16.42 | 2.95 | 1.26 | 13.15 | 3.18 | 1.26 |
|
| ||||||
| AKI 3 | 33.76 | 7.64 | 2.48 | 30.48 | 9.21 | 3.71 |
area under ROC curve for in-hospital mortality prediction based on the logistic regression models = 0.799
Patients with AKI had a significant decrease in median 28 ICU-free days [16], from 26 (23.1–26.9) for patients without AKI to 22 (0–25.7), 17(0–24.8), and 0 (0–19.8) days for patients with AKI 1, 2, and 3, respectively (p<0.0001) (Table 5). The length of ICU stay for patients who developed AKI was longer than for those who did not develop AKI and increased gradually with the severity of AKI from a mean ICU stay of 2.3 days for patients without AKI to 5.6, 8.2 and 12.6 days for AKI 1, 2, 3 respectively (p<0.0001) (Table 5).
Table 5.
Length of Stay (LOS) and 28 days ICU free days
| ICU LOS Median(Q1, Q3) | Hospital LOS Median(Q1, Q3) | ICU Free days Median(Q1, Q3) | |
|---|---|---|---|
| NO AKI | 1.5(1, 2.3) | 5(3, 8) | 26.1(23.8,26.9) |
| AKI 1 | 3(1.8, 5.55)* | 9(6, 15)* | 23(0.9, 25.8)* |
| AKI 2 | 4.3(2.3, 9.7)* | 12(7, 20)* | 17.8(0, 24.9)* |
| AKI3 | 7.1(3, 15.65)* | 16(9,28)* | 0(0, 20.95)* |
Mann-Whitney U-test comparing AKI/1/2/3 vs. No AKI: p<0.0001.
The classification of AKIN for the development of AKI is based on the combination of two components: urine output measurements (UO) and serum creatinine (CR) increases in a 48 hour window. We examined the ability of each component of the AKIN criteria (urine output or creatinine) to predict mortality independently. First we computed Area Under the receiver operating characteristic Curve (AUC) for AKI categorized by urine output from 10-fold cross-validation using a logistic regression analysis (the same covariates were included as above). We then computed the AUC for AKI using CR. We then compared AUCs corresponding to UO and CR.
Regarding the subset of patients without AKI, we found that the mortality predictive ability of CR was superior to that of UO (AUC (CR) = 0.780 vs. AUC (UO) = 0.764; p<0.0001). However, for the subset of patients who developed AKI, divided according to severity stages, we found that the mortality predictive ability of UO was always superior to that of CR: AKI 1- AUC (UO) = 0.741 vs. AUC (CR) = 0.714; p=0.005. AKI 2- AUC (UO) = 0.722 vs. AUC (CR) = 0.655; p=0.001. AKI3- AUC (UO) = 0.763 vs. AUC (CR) = 0.660; p=0.001 (Table 6).
Table 6.
Mortality predictive value of urine output vs. serum creatinine
| Urine Output [median(Q1–Q3)] | Creatinine [median(Q1–Q3)] | Overall [median(Q1–Q3)] | AUC [Urine output] vs. AUC [Creatinine] [p-value1] |
|
|---|---|---|---|---|
| No AKI | 0.764 (0.759–0.768) | 0.780(0.777–0.784) | 0.789(0.762–0.794) | 0.002 |
| AKI 1 | 0.741(0.724–0.747) | 0.714(0.698–0.716) | 0.713(0.709–0.724) | 0.005 |
| AKI 2 | 0.722(0.702–0.729) | 0.655(0.626–0.683) | 0.694(0.678–0.713) | 0.001 |
| AKI 3 | 0.763(0.728–0.789) | 0.66(0.629–0.672) | 0.661(0.646–0.68) | 0.001 |
from Mann-Whitney U-test comparing predictive AUC for urine output and creatinine
Discussion
Our analysis of a cohort of more than 14,000 patients, from a single, large, academic center, using the AKIN proposed acute kidney classification on data from the MIMIC-II database, showed a clear and significant increase in the risk for mortality in patients who developed acute kidney injury compared with patients who did not. The increased risk was found to be proportional to the stage of AKI although there is no clear risk difference between the patients with AKI 1 and AKI 2 compared to a large increase in mortality risk in patients with AKI 3. These results are consistent with previous studies, in which the authors hypothesized that an inaccurate use of the criteria, specifically data regarding urine output, which, by their nature, can be inaccurately collected, was the cause for this phenomenon[11]. In contrast with the aforementioned studies, the MIMIC-II database allowed us to follow urine output measurements in a higher resolution (6 hour windows), and therefore fully meet urine output criteria as designed in the AKIN classification. Nevertheless, we still did not see a significant difference between AKI 1 and 2, regarding the risk of mortality. This finding suggests that although these patients are classified as two different groups according to the AKIN classification, this division should be reconsidered.
The increased mortality rate, especially in the less severe AKI groups (1 and 2), may be explained by an indirect rather than a direct mechanism. In the past there have been studies which demonstrated that kidney injury can influence morbidity and mortality directly by causing water and salt retention leading to hyperkalemia, acidosis [17–18]and fluid overload. However, AKI has been associated with increased insulin resistance and protein breakdown that can lead to immune system dysfunction. This can create an indirect influence on morbidity and mortality, particularly given that sepsis is the most common mechanism of death in AKI [16]. Kidney injury can also cause activation of the immune system that promotes the secretion of proinflammatory cytokines that can lead to an increased activity of pulmonary macrophages; this could result in increased pulmonary capillary permeability and cause respiratory compromise [19].
Accumulating data, including our results, show that although kidney injury is not always directly related to the cause of death, it is clearly a marker of worsening patient status, and may be a useful clinical marker of deterioration. We therefore suggest that it might be used as a risk assessment tool for clinicians.
In view of the above it would seem logical to assume that tackling AKI would create a beneficial effect for these patients. However, this approach while useful to prognosticate remains unproven when used to direct therapy [20–26]. We believe the reason to be the multi-factorial nature of AKI and the fact that it might be only a part of a systemic process rather than its cause.
There are a number of limitations to our study. First, our database did not have a specific and accurate coding system for RRT. In order to exclude patients that had ESRD we had to use a text search. We have tried to overcome this limitation by refining the search and by sampling of 100 patients (out of 630 excluded patients) in order to ensure that patients who were excluded indeed had ESRD. The results were that in 98% of these sampled cases, patients have had RRT on the day of admission and were appropriately excluded. Because the misclassification rate in the manual review was 2% (95% CI 0–4.7%), a Simulated 5% misclassification rate among patients coded as having ESRD resulted in the movement of only 32 patients from ESRD to the cohort. The mortality rate and calculated OR for various AKI stages did not differ from the original cohort. Secondly, the database contains data from a period of 7 years (2001–2007), during which there were changes in management of the critically ill and therefore possibly in patients outcome. Because the MIMIC II database is completely de-identified, we were unable to divide the patients into groups that correspond to their different treatment periods. Finally, although our study included the data of more than 14,000 patients and had strong statistical power, it was still a retrospective analysis with its characteristic limitations.
The use of lowest creatinine during hospital stay as baseline creatinine level can be also considered a limitation. Although, a number of studies have demonstrated the inaccuracy of the currently used methods for the calculation of baseline serum creatinine level (i.e. MDRD formula) especially in patients with pre-AKI reduced GFR[27–28]. Therefore we decided to use the lowest serum creatinine level of a patient during his hospital stay as baseline creatinine level.
Conclusion
In view of AKI’s tremendous effect on prognosis, we propose using the AKI classification as a risk assessment tool for clinicians. Larger prospective randomized controlled trials are needed in order to examine whether the application of treatment measurements targeting the AKI will improve patient prognosis.
Acknowledgments
Support: This work was supported in part by NIH Grant No. R01-EB001659.
Footnotes
Dr. Malhotra received consulting/research income from Philips, SGS, SHC, Apnex, Sepracor, Cephalon, Pfizer, Merck, Apnicure, Ethicon, Medtronic, and Itimar. The remaining authors have not disclosed any potential conflicts of interest.
References
- 1.Chertow GM, et al. Acute kidney injury, mortality, length of stay, and costs in hospitalized patients. J Am Soc Nephrol. 2005;16(11):3365–70. doi: 10.1681/ASN.2004090740. [DOI] [PubMed] [Google Scholar]
- 2.Chertow GM, et al. Independent association between acute renal failure and mortality following cardiac surgery. Am J Med. 1998;104(4):343–8. doi: 10.1016/s0002-9343(98)00058-8. [DOI] [PubMed] [Google Scholar]
- 3.de Mendonca A, et al. Acute renal failure in the ICU: risk factors and outcome evaluated by the SOFA score. Intensive Care Med. 2000;26(7):915–21. doi: 10.1007/s001340051281. [DOI] [PubMed] [Google Scholar]
- 4.Bellomo R, et al. Acute renal failure - definition, outcome measures, animal models, fluid therapy and information technology needs: the Second International Consensus Conference of the Acute Dialysis Quality Initiative (ADQI) Group. Crit Care. 2004;8(4):R204–12. doi: 10.1186/cc2872. [DOI] [PMC free article] [PubMed] [Google Scholar]
- 5.Bellomo R, Kellum J, Ronco C. Acute renal failure: time for consensus. Intensive Care Med. 2001;27(11):1685–8. doi: 10.1007/s00134-001-1120-6. [DOI] [PubMed] [Google Scholar]
- 6.Gruberg L, et al. The prognostic implications of further renal function deterioration within 48 h of interventional coronary procedures in patients with pre-existent chronic renal insufficiency. J Am Coll Cardiol. 2000;36(5):1542–8. doi: 10.1016/s0735-1097(00)00917-7. [DOI] [PubMed] [Google Scholar]
- 7.Lassnigg A, et al. Minimal changes of serum creatinine predict prognosis in patients after cardiothoracic surgery: a prospective cohort study. J Am Soc Nephrol. 2004;15(6):1597–605. doi: 10.1097/01.asn.0000130340.93930.dd. [DOI] [PubMed] [Google Scholar]
- 8.Levy MM, et al. Early changes in organ function predict eventual survival in severe sepsis. Crit Care Med. 2005;33(10):2194–201. doi: 10.1097/01.ccm.0000182798.39709.84. [DOI] [PubMed] [Google Scholar]
- 9.Mehta RL, et al. Acute Kidney Injury Network: report of an initiative to improve outcomes in acute kidney injury. Crit Care. 2007;11(2):R31. doi: 10.1186/cc5713. [DOI] [PMC free article] [PubMed] [Google Scholar]
- 10.Joannidis M, et al. Acute kidney injury in critically ill patients classified by AKIN versus RIFLE using the SAPS 3 database. Intensive Care Med. 2009;35(10):1692–702. doi: 10.1007/s00134-009-1530-4. [DOI] [PubMed] [Google Scholar]
- 11.Ostermann M, Chang R. Correlation between the AKI classification and outcome. Crit Care. 2008;12(6):R144. doi: 10.1186/cc7123. [DOI] [PMC free article] [PubMed] [Google Scholar]
- 12.Brochard L, et al. An Official ATS/ERS/ESICM/SCCM/SRLF Statement: Prevention and Management of Acute Renal Failure in the ICU Patient: an international consensus conference in intensive care medicine. Am J Respir Crit Care Med. 2010;181(10):1128–55. doi: 10.1164/rccm.200711-1664ST. [DOI] [PubMed] [Google Scholar]
- 13.Saeed M, et al. Multiparameter Intelligent Monitoring in Intensive Care II (MIMIC-II): A public-access intensive care unit database. Crit Care Med. 2011 doi: 10.1097/CCM.0b013e31820a92c6. [DOI] [PMC free article] [PubMed] [Google Scholar]
- 14.Vincent JL, et al. The SOFA (Sepsis-related Organ Failure Assessment) score to describe organ dysfunction/failure. On behalf of the Working Group on Sepsis-Related Problems of the European Society of Intensive Care Medicine. Intensive Care Med. 1996;22(7):707–10. doi: 10.1007/BF01709751. [DOI] [PubMed] [Google Scholar]
- 15.Elixhauser A, et al. Comorbidity measures for use with administrative data. Med Care. 1998;36(1):8–27. doi: 10.1097/00005650-199801000-00004. [DOI] [PubMed] [Google Scholar]
- 16.Schoenfeld DA, Bernard GR. Statistical evaluation of ventilator-free days as an efficacy measure in clinical trials of treatments for acute respiratory distress syndrome. Crit Care Med. 2002;30(8):1772–7. doi: 10.1097/00003246-200208000-00016. [DOI] [PubMed] [Google Scholar]
- 17.Kellum JA, Song M, Li J. Lactic and hydrochloric acids induce different patterns of inflammatory response in LPS-stimulated RAW 264.7 cells. Am J Physiol Regul Integr Comp Physiol. 2004;286(4):R686–92. doi: 10.1152/ajpregu.00564.2003. [DOI] [PubMed] [Google Scholar]
- 18.Rocktaeschel J, et al. Acid-base status of critically ill patients with acute renal failure: analysis based on Stewart-Figge methodology. Crit Care. 2003;7(4):R60. doi: 10.1186/cc2333. [DOI] [PMC free article] [PubMed] [Google Scholar]
- 19.Kramer AA, et al. Renal ischemia/reperfusion leads to macrophage-mediated increase in pulmonary vascular permeability. Kidney Int. 1999;55(6):2362–7. doi: 10.1046/j.1523-1755.1999.00460.x. [DOI] [PubMed] [Google Scholar]
- 20.Brienza N, et al. A comparison between fenoldopam and low-dose dopamine in early renal dysfunction of critically ill patients. Crit Care Med. 2006;34(3):707–14. doi: 10.1097/01.CCM.0000201884.08872.A2. [DOI] [PubMed] [Google Scholar]
- 21.Heinrich MC, et al. Nephrotoxicity of iso-osmolar iodixanol compared with nonionic low-osmolar contrast media: meta-analysis of randomized controlled trials. Radiology. 2009;250(1):68–86. doi: 10.1148/radiol.2501080833. [DOI] [PubMed] [Google Scholar]
- 22.Huber W, et al. Prophylaxis of contrast material-induced nephropathy in patients in intensive care: acetylcysteine, theophylline, or both? A randomized study. Radiology. 2006;239(3):793–804. doi: 10.1148/radiol.2393041456. [DOI] [PubMed] [Google Scholar]
- 23.Kelly AM, et al. Meta-analysis: effectiveness of drugs for preventing contrast-induced nephropathy. Ann Intern Med. 2008;148(4):284–94. doi: 10.7326/0003-4819-148-4-200802190-00007. [DOI] [PubMed] [Google Scholar]
- 24.McCullough PA, et al. A meta-analysis of the renal safety of isosmolar iodixanol compared with low-osmolar contrast media. J Am Coll Cardiol. 2006;48(4):692–9. doi: 10.1016/j.jacc.2006.02.073. [DOI] [PubMed] [Google Scholar]
- 25.Morelli A, et al. Prophylactic fenoldopam for renal protection in sepsis: a randomized, double-blind, placebo-controlled pilot trial. Crit Care Med. 2005;33(11):2451–6. doi: 10.1097/01.ccm.0000186413.04875.ef. [DOI] [PubMed] [Google Scholar]
- 26.Tepel M, et al. Prevention of radiographic-contrast-agent-induced reductions in renal function by acetylcysteine. N Engl J Med. 2000;343(3):180–4. doi: 10.1056/NEJM200007203430304. [DOI] [PubMed] [Google Scholar]
- 27.Bagshaw SM, et al. A comparison of observed versus estimated baseline creatinine for determination of RIFLE class in patients with acute kidney injury. Nephrol Dial Transplant. 2009;24(9):2739–44. doi: 10.1093/ndt/gfp159. [DOI] [PubMed] [Google Scholar]
- 28.Rule AD. Understanding estimated glomerular filtration rate: implications for identifying chronic kidney disease. Curr Opin Nephrol Hypertens. 2007;16(3):242–9. doi: 10.1097/MNH.0b013e328057de8b. [DOI] [PubMed] [Google Scholar]