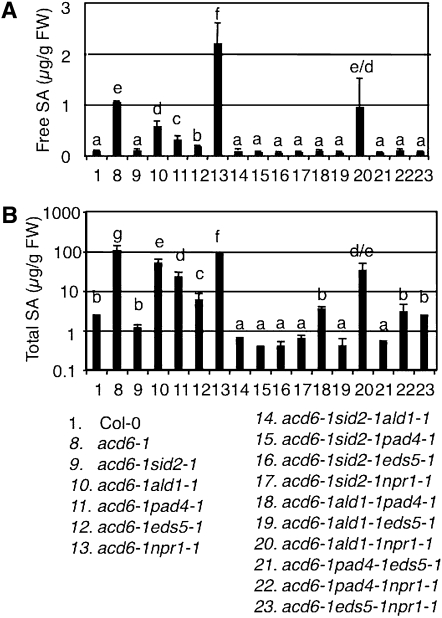
Figure 4 .
Genetic interactions among SA mutants lead to altered SA accumulation in acd6-1. SA was extracted from 25-day-old plants and analyzed by HPLC for free (A) and total SA (B). Note B has a log scale. The single mutants have similar SA levels as Col-0 (data not shown). Letters indicate significant difference among the samples (P < 0.05).

