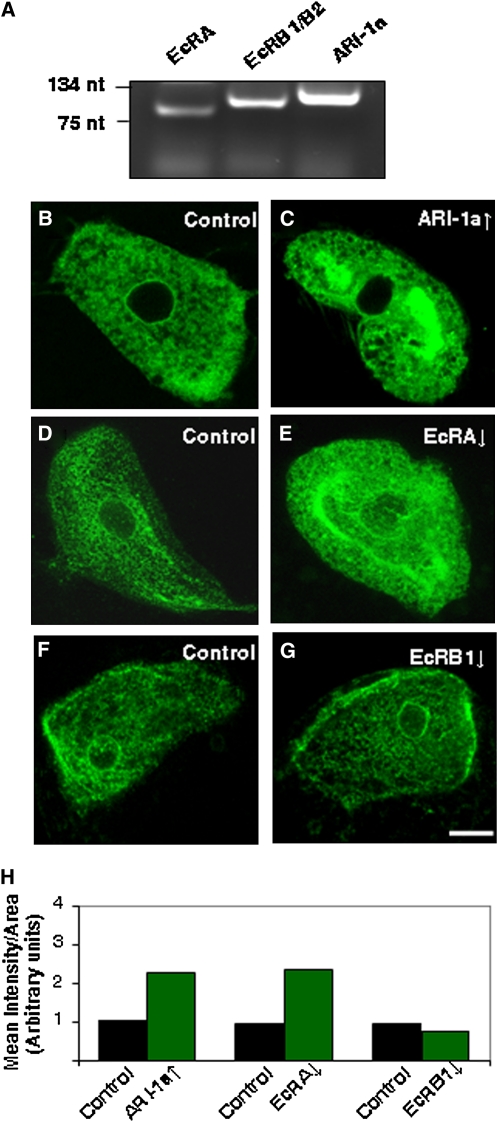
Figure 5 .
ARI-1a phenotypes at the single-cell level. (A) RT-PCR from Malpighian tubuli showing expression of EcRA, EcRB1/B2, and ari-1a genes. (B and C) Effect of overexpressing (↑) ARI-1a in larval Malpighian tubuli (stellate cells) co-expressing the GFP-tagged membrane protein CD8 under the driver Gal4-C649. (D and E) Effect of underexpressing (↓) EcRA. Note that in both cases the amount of membranous signal is increased with respect to controls. (F and G) By contrast, the underexpression of EcRB1 yields no effect, demonstrating that the phenomenon is specific of EcRA. The underexpression of EcRA and EcRB1 was performed by driving the expression of the corresponding RNAi constructs with Gal4-C649. (H) Relative quantification of GFP intensity signals in each genotype. Controls always correspond to sibling genotypes. Laser settings were kept constant in all images. Bar, 10 µm.

