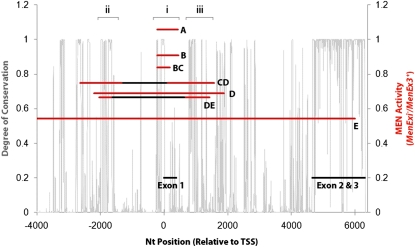
Figure 4—
The degree of conservation within the Men genomic region measured across 10 Drosophila genomes (gray lines, left y-axis) and average relative activity of the excision heterozygotes (height of bars representing excision groups). Tukey’s HSD groups (overlapping groups A–E) were determined by relative MEN enzyme activity (right y-axis). Red lines show total deletion size within that bin, and the black lines indicate common deletion size per bin. Deletion groups without a black line are made up of only one MenExi− allele. Regions of interest have a bracket above and are denoted i, ii, and iii.

