

Non-technical summary
Skeletal muscle has the capacity to modify its size in response to external cues such as mechanical load, neural activity, hormones, stress and nutritional status. Pathological muscle loss or ‘atrophy’ occurs as the result of a number of disparate conditions including ageing, immobilization, diabetes, cancer, sepsis and as a serious side effect of corticosteroid hormone treatment. Synthetic glucocorticoids are often used to treat inflammation; however, high doses and chronic use of these hormones can lead to the loss of skeletal muscle mass and weakness. We show that in mice with a deletion of the MuRF1 protein, but not the MAFbx protein, the loss of muscle mass is attenuated relative to normal mice following 14 days of glucocorticoid treatment. Knowledge of how the MuRF1 protein functions in skeletal muscle to regulate skeletal muscle mass could lead to the development of therapeutics to prevent muscle atrophy under various conditions including glucocorticoid treatment.
Abstract
Abstract
Skeletal muscle atrophy occurs under a variety of conditions and can result from alterations in both protein synthesis and protein degradation. The muscle-specific E3 ubiquitin ligases, MuRF1 and MAFbx, are excellent markers of muscle atrophy and increase under divergent atrophy-inducing conditions such as denervation and glucocorticoid treatment. While deletion of MuRF1 or MAFbx has been reported to spare muscle mass following 14 days of denervation, their role in other atrophy-inducing conditions is unclear. The goal of this study was to determine whether deletion of MuRF1 or MAFbx attenuates muscle atrophy after 2 weeks of treatment with the synthetic glucocorticoid dexamethasone (DEX). The response of the triceps surae (TS) and tibialis anterior (TA) muscles to 14 days of DEX treatment (3 mg kg−1 day−1) was examined in 4 month-old male and female wild type (WT) and MuRF1 or MAFbx knock out (KO) mice. Following 14 days of DEX treatment, muscle wet weight was significantly decreased in the TS and TA of WT mice. Comparison of WT and KO mice following DEX treatment revealed significant sparing of mass in both sexes of the MuRF1 KO mice, but no muscle sparing in MAFbx KO mice. Further analysis of the MuRF1 KO mice showed significant sparing of fibre cross-sectional area and tension output in the gastrocnemius (GA) after DEX treatment. Muscle sparing in the MuRF1 KO mice was related to maintenance of protein synthesis, with no observed increases in protein degradation in either WT or MuRF1 KO mice. These results demonstrate that MuRF1 and MAFbx do not function similarly under all atrophy models, and that the primary role of MuRF1 may extend beyond controlling protein degradation via the ubiquitin proteasome system.
Introduction
Skeletal muscle mass is regulated by multiple interconnecting pathways that control processes involved in both the synthesis and degradation of proteins (Jackman & Kandarian, 2004; Kimball & Jefferson, 2010). The cellular and molecular pathways responsible for the regulation of protein turnover in skeletal muscle continue to be elucidated, and two muscle-specific E3 ubiquitin ligases, muscle RING finger 1 (MuRF1) and muscle atrophy F-Box (MAFbx, also known as Atrogin-1) are thought to be key regulators of the process, especially under atrophy-inducing conditions. MuRF1 and MAFbx are recognized as markers of muscle atrophy since they are expressed at relatively low levels in resting muscle and transcriptionally increased under a variety of atrophy-inducing conditions (Bodine et al. 2001; Gomes et al. 2001; Sacheck et al. 2007). Further, these ligases are thought to be critical regulators of the atrophy process since the null deletion of MuRF1 attenuates muscle atrophy following loss of innervation (Bodine et al. 2001) and unloading (Labeit et al. 2010), while the deletion of MAFbx spares muscle mass following loss of innervation (Bodine et al. 2001). The investigation of the role of either ligase in other forms of atrophy, such as those linked to elevated glucocorticoids, has been limited.
Both natural and synthetic glucocorticoids are potent inducers of skeletal muscle atrophy (Hasselgren, 1999). Elevated levels of endogenous glucocorticoids are associated with a number of muscle atrophy-inducing conditions, including fasting, metabolic acidosis and cachexia (May et al. 1986; Wing & Goldberg, 1993; Tisdale, 2009). In addition, elevated glucocorticoids can exacerbate the loss of muscle mass that occurs with diabetes (Hu et al. 2009), sepsis (Tiao et al. 1996) and inactivity (Fitts et al. 2007). Synthetic glucocorticoids are widely used to treat inflammation (Rhen & Cidlowski, 2005) and muscular dystrophy (Matthews et al. 2010); however, they induce serious side effects such as muscle and bone loss (Decramer et al. 1994; Barry & Gallagher, 2003) and insulin resistance (Stojanovska et al. 1990; Severino et al. 2002; Ruzzin et al. 2005; Qi & Rodrigues, 2007), which limit their clinical use. Identification of the pathways responsible for glucocorticoid-induced muscle atrophy could lead to the development of new therapeutics to treat diseases associated with elevated endogenous glucocorticoids, or new synthetic glucocorticoids for the treatment of inflammation without the deleterious side effect of muscle loss.
The mechanism by which glucocorticoids trigger muscle atrophy is uncertain; however, glucocorticoids are reported to cause both decreases in protein synthesis and increases in protein degradation (Odedra et al. 1983; Kayali et al. 1987). Treatment of young adult and old rats for 5–6 days with the synthetic glucocorticoid dexamethasone (DEX) suppresses protein synthesis in hindlimb muscles (Savary et al. 1998). Diminished rates of protein synthesis may be due to the antagonistic effects of glucocorticoids on the Akt/mTOR growth pathway. Treatment with DEX for as little as 4 h has been shown to decrease the phosphorylation of S6K1 and 4E-BP1 in rat skeletal muscle (Shah et al. 2000), both important downstream targets of mTOR. In addition, DEX treatment increases the expression of regulated in DNA damage and development (REDD1), resulting in an increase in the association of TSC1 with TSC2 and the inhibition of mTOR activity (Wang et al. 2006).
Glucocorticoid-induced atrophy may also be mediated by increases in muscle catabolism through the activation of the ubiquitin proteasome system (UPS) (Hasselgren, 1999; Schakman et al. 2008). In this system, the actions of an E1 ubiquitin-activating enzyme, an E2-conjugating enzyme and an E3 ubiquitin ligase catalyse the transfer of a single ubiquitin molecule to a substrate protein (Lecker et al. 1999). Repeated rounds of activity can result in the formation of polyubiquitin chains, which often serve as a signal for protein degradation by the 26S proteasome. While glucocorticoids have been shown to increase the mRNA expression of ubiquitin (Marinovic et al. 2002) and many proteasome subunits (Price et al. 1994; Combaret et al. 2004), they also upregulate the transcription of MuRF1 and MAFbx, which, as mentioned, have E3 ubiquitin ligase activity (Bodine et al. 2001; Sacheck et al. 2004). The transcriptional regulation of MuRF1 and MAFbx by glucocorticoids occurs, in part, through activation of the Forkhead transcription factors (FOXOs), FOXO1 and FOXO3a. However, full transcriptional activation of MuRF1, but not MAFbx, in response to glucocorticoids appears to be dependent on the direct binding of an activated glucocorticoid receptor homodimer to the promoter (Waddell et al. 2008).
The purpose of this study was to investigate whether deletion of either MuRF1 or MAFbx spares muscle mass in response to excess glucocorticoids. Although knocking out MuRF1 or MAFbx has been shown to attenuate muscle loss following denervation, it remains unknown whether muscle sparing also occurs in a systemic catabolic model of muscle atrophy. Using mice with a null deletion in either MuRF1 or MAFbx, muscle sparing was found to occur only in the MuRF1 null mice after 14 days of DEX treatment. The loss of MuRF1 protected against DEX-induced decreases in protein synthesis and prevented sustained increases in the expression of Forkhead transcription factors. The finding that MAFbx null mice do not spare muscle mass indicates that MuRF1 and MAFbx do not function similarly in all atrophy models, and suggests divergent mechanisms of action for these two muscle-specific E3 ligases.
Methods
Ethical approval
All animal procedures were approved by the Institutional Animal Care and Use Committee at the University of California, Davis and are in compliance with the policies and regulations outlined by The Journal of Physiology (Drummond, 2009).
Animals
The generation of MuRF1 and MAFbx null mice has been previously described (Bodine et al. 2001). Both mouse lines are on a C57Bl/6 background, and all wild type (WT) mice were generated from heterozygous × heterozygous crosses and are thus on the same background as the knock out (KO) mice. Male and female mice, 4 months of age, were utilized for all experiments. For terminal experiments, mice were anaesthetized with 2–4% inhaled isoflurane for tissue removal, and then killed by exsanguination. For the contractile studies, mice were anaesthetized with an intraperitoneal injection of ketamine (85 mg (kg body wt)−1)–xylazine (5 mg (kg body wt)−1) and maintained at surgical levels of anaesthesia with supplemental doses.
Dexamethasone study
Mice were housed in ventilated cages with free access to food and water under a 12 h dark–light cycle. Male and female WT and KO mice were treated with DEX for a period of either 3 or 14 days. Dexamethasone (Sigma D2915, water soluble) was provided in the drinking water at a concentration of 0.03 mg ml−1 in order to deliver a dose of 3 mg kg−1 per mouse, as based on pilot dosing studies in C57Bl/6 mice where daily water and food consumption were measured. During the course of the treatment, fresh DEX-treated water was provided every other day at which time water consumption was measured, confirming that the mice were indeed receiving a dose of 3 mg kg−1. The effectiveness of the dosing was verified at the end of the experiment by measuring spleen mass, which decreases in response to glucocorticoids due to apoptosis of splenocytes.
At the end of the treatment period, mice were weighed, and the tibialis anterior (TA) muscle and triceps surae complex (TS: soleus, plantaris, medial gastrocnemius, lateral gastrocnemius) were excised bilaterally, weighed, frozen in liquid nitrogen and stored at –80°C for further analysis. The spleen was also removed and weighed. A subset of triceps surae muscles were pinned on cork at a length approximating the optimal length (Lo) and frozen in isopentane cooled in liquid nitrogen for histological analysis.
Nutritional deprivation study
Female WT and MuRF1 KO mice were housed individually in ventilated cages and given free access to food and water for 1 week. During that week, the body weight and amount of food consumed by each mouse was recorded daily. On the first day of the second week, all food was removed at 9:00 h from each cage and then 20% of each animal's ad libitum food intake was presented at 17:00 h every day for 3 days. Body weight was recorded at 9:00 h each day of the study to ensure the mice did not lose more than 20% during the study. On the morning of the fourth day, the body weight was measured and the TA and TS muscles were excised bilaterally, weighed, frozen in liquid nitrogen, and stored at –80°C for further analysis.
Immunohistochemistry
Serial cross-sections (10 μm) were cut from the TS using a Leica CM 3050S cryostat (Leica Microsystems). Sections were stained with laminin (Sigma, 1:1000) to determine fibre cross-sectional area (μm2). Digital images of the stained sections were taken under 200× total magnification using an Axio Imager M1 light microscope (Zeiss). Fibre cross-sectional area was measured in the soleus and gastrocnemius (GA: lateral and medial heads) muscles. For the GA, five non-overlapping regions were identified and a total of 100–250 fibres were analysed within each region using AxioVision software (Zeiss). The same five regions were analysed across all mice.
Protein synthesis measurements
Female WT and MuRF1 KO mice were treated with DEX for 3 or 14 days (n = 3–4 per group). On the final day of treatment, an initial blood sample was collected from the tail of each animal. Each animal was then given an intraperitoneal injection of 2H water (Sigma) equivalent to 3% of total body water which was calculated to be equal to (body weight × 0.75) in milliliters. Following a 4 h equilibration time in which food was removed from the cage, mice were anaesthetized with 2–4% isoflurane and the TA and TS were excised, weighed and frozen in liquid nitrogen. A final blood sample was collected via cardiac puncture. The right TS along with the two blood samples collected from each animal were sent to the Mouse Metabolic Phenotyping Center at Case Western University to determine the protein fractional synthesis rate by methods described previously (Dufner et al. 2005; Anderson et al. 2008).
mRNA expression analysis
Total RNA was extracted from the TS complex using TRIzol reagent according to the manufacturer's instructions (Invitrogen). MAFbx expression was analysed by Northern blotting by loading 10 μg of total RNA onto a 1% formaldehyde–agarose denaturing gel. The RNA was electrophoresed at 100 V for 2–3 h and then transferred to Whatman Nytran SPC nylon membrane (Fisher) overnight by capillary action. The following day, RNA was UV cross-linked and then probed with a MAFbx cDNA fragment using a Random Primer DNA Labelling kit (Invitrogen). Hybridization was performed at 42°C overnight. The hybridized membrane was then washed and exposed to Kodak X-OMAT blue film. MuRF1, FOXO1 and FOXO3a gene expression was measured by quantitative PCR (qPCR) in WT and MuRF1 KO mice after 3 and 14 days of DEX treatment (n = 3–4 per group). cDNA was then synthesized using a QuantiTech Reverse Transcription Kit (Qiagen) from 1 μg of total RNA. qPCR was performed using PerkinElmer 2× SYBR Green master mix on an ABI 7900HT thermocycler. Cycling conditions were one cycle at 94°C for 10 min followed by 40 cycles at 94°C for 30 s, 59°C for 30 s and 72°C for 30 s. Each sample was run in triplicate. Sequences of the mouse forward and reverse primers are as follows: MuRF1 forward: 5′-GCTGGTGGAAAACATCATTGACAT-3′; reverse: 5′-CATCGGGTGGCTGCCTTT-3′; FOXO1 forward: 5′-AAGAGCGTGCCCTACTTCAA-3′; reverse: 5′-TGCTGTGAAGGGACAGATTG-3′, FOXO3a forward: 5′-CAGGCTCCTCACTGTATTCAGCTA-3′; reverse: 5′-CATTGAACATGTCCAGGTCCAA-3′; Rpl39 forward: 5′-CAAAATCGCCCTATTCCTCA-3′; reverse: 5′-AGACCCAGCTTCGTTCTCCT-3′. Quantification of expression was performed relative to a standard curve based on plasmid copy number containing the amplicon for each gene and normalized to Rpl39 expression.
Western blotting
Frozen TS complex muscles from control and DEX-treated WT and MuRF1 KO mice were powdered and homogenized in sucrose lysis buffer (50 mm Tris pH 7.5, 250 mm sucrose, 1 mm EDTA, 1 mm EGTA, 1% Triton X-100, 50 mm NaF, 5 mm Na2(PO4)2 with fresh 0.5 mm PMSF, 10 μg ml−1 aprotinin, 10 μg ml−1 leupeptin, 1 mm NaVO4 and 0.1% DTT). Protein concentrations were determined in triplicate from the supernatant using the Bradford method (Bio-Rad). Six to twenty micrograms of protein was subjected to SDS-PAGE on acrylamide gels ranging from 7.5–12% and transferred to polyvinylidene diflouride (PVDF) membrane. Membranes were blocked in 3% non-fat dairy milk in Tris-buffered saline with 0.1% Tween-20 added (TBST) for 1 h and then probed with primary antibody overnight at 4°C. FOXO1, FOXO3a (both Santa Cruz) and EEF2 (Cell Signalling) were used at a concentration of 1:1000, actin (Sigma) was used at 1 ng μl−1, β5 (Biomol) was used at 1:1250, and myosin heavy chain (fast) (Sigma) and GAPDH (Cell Signalling) were used at 1:5000. The next day, membranes were washed and incubated with HRP-conjugated secondary antibodies at 1:10,000, or in the case of actin and GAPDH 1:25,000, for 1 h at room temperature. Immobilon Western Chemiluminescent HRP substrate (Millipore) was then added to the membranes and exposed in a Chemigenius Bio-imaging System (Syngene).
Contractile studies
The isometric contractile function of the gastrocnemius (GA: lateral and medial heads) muscle of control and 14 day DEX-treated WT and MuRF1 KO mice was measured in situ as previously described with modifications (Whetzel et al. 1997). Briefly, mice were deeply anaesthetized and the right GA muscle and tendon were carefully isolated and then attached to a force transducer (Grass-FT-03) for force measurement. The GA muscle was activated by electrical stimulation of the tibial nerve branch. The animal was placed on a heating plate and the right limb was secured to a metal frame by clamps above the knee and at the ankle joint. Muscle temperature was monitored and maintained at 35–36°C using radiant heat. The exposed muscle was coated with a mixture of mineral oil and vasoline to insulate and prevent drying of the muscle. The optimal length (Lo) of the GA was determined by adjusting the length of the muscle until maximum twitch tension was produced.
A twitch profile of the muscle was generated by measuring peak twitch tension (Pt), the time to peak tension (Tc), and the time from the peak to half-relaxation (THRT). A force–frequency profile was obtained by delivering a 500 ms train of pulses at frequencies between 10 and 150 Hz. Maximal isometric tension (Po) was determined from the force–frequency profile and specific tension was calculated. Upon completion of the contractile testing, the length of the stimulated muscle was measured and both the right and left GA muscles were removed and weighed. Physiological cross-sectional area was then calculated based on the following formula: PCSA = muscle weight (g)/(muscle length (cm) × 1.056 (g cm−3)) where 1.056 g cm−3 is the density of the tissue. For determination of specific tension, the mass of the left muscle was used since the contractile testing results in an increase in mass due to fluid absorption.
Proteasome activity
20S and 26S proteasome activities were performed as previously described (Gomes et al. 2006). The caspase-like (β1), trypsin-like (β2) and chymotrypsin-like (β5) activity assays were carried out in a total volume of 100 μl in 96-well opaque plates. For the 20S assays, 20 μg of protein was added to assay buffer containing 250 mm Hepes, 5 mm EDTA and 0.03% SDS (pH 7.5). For all 26S activity assays, 20 μg of protein was added to assay buffer containing 50 mm Tris, 1 mm EDTA, 150 mm NaCl, 5 mm mgCl2, 50 μm ATP and 0.5 mm DTT (pH 7.5). The β1 β2, and β5 assays were conducted in the absence and presence of their respective proteasomal inhibitors: beta 1: 40 nm Z-Pro-Nle-Asp-al (Biomol), beta 2: 40 μm epoxomicin and beta 3: 10 μm epoxomicin (Peptides International). The activity of the 20S and 26S proteasome was measured by calculating the difference between fluorescence units recorded with or without the specific inhibitor in the reaction medium. β1 was initiated by the addition of 10 μl of a 1 mm solution of Z-Leu-Leu-Glu-7-AMC (Peptide Institute). β2 was initiated by the addition of 10 μl of 1 mm Boc-Leu-Ser-Thr-Arg-7-AMC (Bachem). β5 was initiated by the addition of 10 μl of 1 mm succinyl-Leu-Leu-Val-Tyr-7-amido-4-methylcoumarin (LLVY-AMC) (Bachem). These substrates are cleaved by the proteasome releasing free AMC, which is then detected fluorometrically. Released AMC was measured by a Fluoroskan Ascent fluorometer (Thermo Electron) at an excitation wavelength of 390 nm and an emission wavelength of 460 nm. Fluorescence was measured at 15 min intervals for 2 h. All assays were linear in this range and each sample was done in triplicate.
Total ubiquitin and polyubiquitin ELISAs
Control and DEX-treated WT and MuRF1 KO TS protein samples (1 μg in 1× PBS) were incubated overnight at 4°C to optimize binding to the bottom of 96–well ELISA plates (Santa Cruz Biotech). The next day, samples were incubated in 1% BSA-1× PBST blocking buffer, rinsed three times in 1× PBS and incubated with either total ubiquitin (1:1000, Santa Cruz) or polyubiquitin (1:1000, Biomol) antibodies. Following three rinses in 1× PBST, HRP-conjugated secondary antibody was added. Lastly, the TMB substrate was added to initiate a colour change reaction proportional to HRP activity. Sulphuric acid (2.5 m) was added to stop the enzyme–substrate reaction. The quantification of total ubiquitinated and polyubiquinated proteins was measured spectrophotometrically at a wavelength of 450 nm.
Statistics
Results are presented as mean ± standard deviation (SD) unless otherwise indicated. A repeated measures two-way ANOVA was used to determine differences in per cent body mass lost between DEX-treated WT and MuRF1 KO mice with time as the repeated factor. All other data were analysed by two-way ANOVA or by Student's t test. Tukey's post hoc analysis was used to determine differences when interactions existed. Statistical significance was set at P < 0.05.
Results
DEX-induced muscle atrophy is attenuated in MuRF1 KO mice
Numerous studies have reported increases in MuRF1 and MAFbx expression in muscle undergoing atrophy (Bodine et al. 2001; Gomes et al. 2001; Lecker et al. 2004; Sandri et al. 2004), but only with disuse has the deletion of MuRF1 been shown to spare muscle mass (Bodine et al. 2001; Labeit et al. 2010). Here, we examined whether muscle mass is spared in MuRF1 KO mice following dexamethasone treatment. A treatment dose of 3 mg kg−1 dexamethasone (DEX) was used for this study based on pilot studies in which muscle atrophy was determined in WT C57Bl/6 mice of both sexes at doses of DEX ranging from 1 to 5 mg kg−1. At a dose of 3 mg kg−1 day−1, both male and female C57Bl/6 mice had significant muscle atrophy and up-regulation of MuRF1 and MAFbx expression (data not shown); thus, this dose was used to examine DEX-induced atrophy in the MuRF1 and MAFbx WT and KO mice, which are on a C57Bl/6 background.
Treatment of male and female WT and MuRF1 KO mice with DEX for 2 weeks resulted in significant and similar losses in spleen mass between WT and MuRF1 KO mice suggesting that both WT and MuRF1 KO mice received comparable doses of DEX (Table 1). The per cent spleen mass lost in treated female mice was greater than in male mice, illustrating the greater sensitivity of female versus male mice to DEX. Treatment with DEX caused decreases in body mass in both the WT and MuRF1 KO mice; however, female and male WT mice lost more body mass than their MuRF1 KO littermates (Fig. 1A and B). In general, female WT mice had a rapid drop in body mass during the first week of treatment, with a slower decline during the second week. In contrast, the female MuRF1 KO mice did not exhibit any significant decreases in body mass over the 14 day treatment period, and the difference in per cent body mass lost between WT and MuRF1 KO mice was significant starting at day 4. Male WT mice dropped the largest amount of body mass within the first 2 days of DEX treatment, after which they showed a steady decline. Similarly, the male MuRF1 KO mice saw a gradual decrease in body mass during the treatment period, but the percentage of body mass lost was never as large as seen in the WT mice.
Table 1.
Body and organ weights of control and dexamethasone (DEX)-treated female and male wild type (WT) and MuRF1 null (KO) mice
| Females | WT Con (n = 9) | WT DEX (n = 8) | KO Con (n = 7) | KO DEX (n = 8) |
|---|---|---|---|---|
| Starting BW (g) | 22.3 ± 2.8 | 20.1 ± 1.3 | 25.4 ± 0.5† | 25.1 ± 1.6 |
| Final BW (g) | 22.2 ± 2.4 | 18.1 ± 1.6* | 26.4 ± 2.1 | 23.9 ± 2.7* |
| Heart (mg) | 119.7 ± 16.9 | 105.6 ± 15¶ | 146.1 ± 7.7† | 143.5 ± 8.2 |
| Spleen (mg) | 85.9 ± 10.4 | 37.3 ± 6.5¶ | 86.3 ± 6.0 | 40.4 ± 7.1¶ |
| Males | WT Con (n = 9) | WT DEX (n = 10) | KO Con (n = 8) | KO DEX (n = 8) |
|---|---|---|---|---|
| Starting BW (g) | 29.3 ± 2.5 | 29.4 ± 1.5 | 32.3 ± 2.6† | 32.5 ± 2.3 |
| Final BW (g) | 29.0 ± 0.004 | 27.0 ± 1.7* | 33.6 ± 2.2 | 30.4 ± 3.0* |
| Heart (mg) | 143.4 ± 18.8 | 138.9 ± 15.2 | 178.1 ± 11.8† | 169.8 ± 15.8¶ |
| Spleen (mg) | 80.0 ± 12.0 | 55.0 ± 7.7¶ | 76.4 ± 8.3 | 44.3 ± 5.2¶ |
Female and male WT and MuRF1 KO mice were treated with DEX for 14 days. The average (mean ± SD) starting body weight (BW), final body weight, heart mass and spleen mass of control (Con) and DEX-treated mice was calculated upon completion of the experiment.
Statistical difference between starting and ending BW (P < 0.05)
statistical difference between control WT and KO mice
statistical difference control and DEX treatment within each group (P < 0.05).
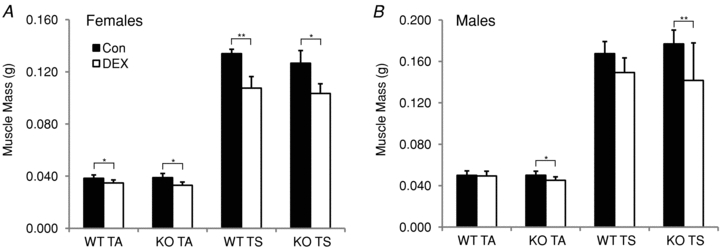
Figure 1. Comparison of dexamethasone (DEX) treatment on body weight and muscle mass in wild type (WT) and MuRF1 null (KO) mice.

Female (A and C) and male (B and D) WT and MuRF1 KO mice were treated with DEX for a period of 14 days. Body weight was measured every 2 days in WT (filled squares) and KO (open squares) DEX-treated mice and the mean ± SEM was plotted for female (A) and male (B) mice (n = 8–10 per group). *denotes within group comparison relative to day 0 (P < 0.05), † denotes across group comparison of treatment effect on WT and KO mice (P < 0.05). The average mass (mean ± SD, wet weight in grams) of the tibialis anterior (TA) and triceps surae (TS) was calculated in female (C) and male (D) WT and MuRF1 KO mice after no treatment (Con, filled bars) or 14 days of DEX treatment (open bars). *P < 0.05, **P < 0.001.
The loss in body mass seen in the DEX-treated mice was accompanied by decreases in muscle mass. Overall, both male and female MuRF1 KO mice showed significant muscle sparing of the TA and TS muscles following 14 days of DEX treatment (Fig. 1C and D). In female mice, significant muscle mass loss was observed in the DEX-treated TA of WT (14.2% loss relative to control), but not KO (2.8%) mice. Similarly, loss of mass in the TS was significantly greater in the WT (26.1%) compared to the KO (8.7%) mice. In male mice, the loss of mass in the TA was also significantly greater in WT (7.2%) than KO (1%) mice. Likewise, male WT mice lost a significant amount of TS mass (11.2%) compared to the male MuRF1 KO (5.1%) mice.
MAFbx KO mice do not show sparing of muscle mass after DEX treatment
Since MAFbx deletion has also been shown to attenuate muscle atrophy under denervation conditions (Bodine et al. 2001), female and male MAFbx KO mice were treated with the same 3 mg kg−1 DEX treatment regimen for 14 days to look for muscle sparing. Body weight and spleen mass decreased similarly in WT and KO mice (Supplemental Table S1). Further, the TA and TS muscles of the DEX-treated MAFbx KO mice atrophied to the same extent as the muscles of the DEX-treated WT mice (Fig. 2). In the TA of the treated mice, female WT mice lost 9.3% of their muscle mass, while the MAFbx KO mice lost 15.1% relative to control. The 19.8% loss in TS mass in the female WT mice was essentially matched by an 18.3% loss in the MAFbx KO mice. Surprisingly, a greater loss of TA and TS muscle mass was observed in the male MAFbx KO mice compared to the WT mice (Fig. 2B). Overall, the MAFbx KO mice showed no sparing of muscle mass. Given that only the MuRF1 KO mice spared muscle mass with DEX treatment, the remaining studies utilized only the MuRF1 KO mice in order to examine the mechanism of muscle sparing with glucocorticoid treatment.
Figure 2. Comparison of dexamethasone (DEX) treatment on muscle mass in wild type (WT) and MAFbx null (KO) mice.
The average mass (mean ± SD, wet weight in grams) of the tibialis anterior (TA) and triceps surae (TS) was calculated in female (A) and male (B) WT and MAFbx KO mice after no treatment (Con, filled bars) or 14 days of DEX treatment (open bars). *P < 0.05, **P < 0.001.
MuRF1 KO mice maintain myofibre cross-sectional area
Fibre cross-sectional area (CSA) was measured in the GA and soleus muscles of female and male WT and MuRF1 KO mice to determine if muscle sparing, evident from the measurement of muscle mass, was also apparent at the single fibre level. In response to DEX treatment, the GA of female WT mice showed a significant decrease (35%) in mean muscle fibre CSA; however, no significant change in CSA was found in the MuRF1 KO mice (Fig. 3A and B). Examination of the distribution of fibre sizes in the GA of the WT mice showed a leftward shift in the distribution after DEX treatment due to an increase in the percentage of small fibres and a decrease in the percentage of large fibres (Fig. 3C). While mean fibre cross-sectional area was not significantly different in the GA of control and DEX-treated KO mice, there was some atrophy in the largest, type II fibres as noted by the small leftward shift in the distribution of fibre areas (see Fig. 3D). The fibre size analysis in the male WT and MuRF1 KO mice revealed similar trends as seen in the females, although the leftward shift in the DEX-treated WT mice was less evident due to the smaller amount of atrophy (Supplementary Fig. S1). No change was evident in the mean fibre size of the soleus from WT or MuRF1 KO mice following DEX treatment (data not shown).
Figure 3. Sparing of muscle fibre size in MuRF1 null (KO) mice following 14 days of dexamethasone (DEX) treatment.
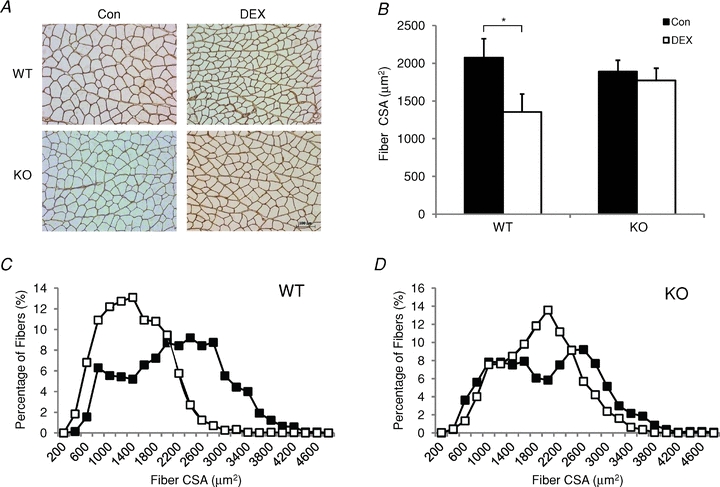
The fibre cross-sectional area (CSA) of muscle fibres in the gastrocnemius muscle (GA) of female wild type (WT) and MuRF1 KO mice were determined from laminin-stained cross-sections. A, representative laminin-stained cross-sections of the same region within the GA muscle for each experimental group. Original magnification ×200, scale bar: 100 μm. B, histogram of the mean ± SD fibre CSA from the GA of control (filled bars) and 14 day DEX-treated (open bars) WT and MuRF1 KO mice (n = 3–5 per group). *P < 0.01. C and D, distributions of fibre cross-sectional areas of fibres in the GA of WT (C) and KO (D) mice following no treatment (Con, filled squares) or 14 days of DEX treatment (DEX, open squares).
DEX-treated MuRF1 KO mice maintain normal contractile function
To investigate whether the attenuated muscle atrophy observed in the DEX-treated MuRF1 KO mice translated to functional sparing of muscle mass, isometric contractile properties of the GA muscle were measured in control and 14 day DEX-treated female WT and MuRF1 KO mice. No significant differences were found in the twitch profiles for any of the groups tested, although there was a trend toward a slower contraction time with DEX treatment in the WT mice (WT Con vs. WT DEX, P = 0.068; KO Con vs. KO DEX, P = 0.228) (Table 2). The force–frequency curves, when expressed as absolute or relative force, were similar between WT and MuRF1 KO mice in both the control and DEX-treated groups (Supplemental Fig. S2). The maximum isometric force of control WT and MuRF1 KO mice was similar and did not change following DEX treatment. This was unexpected for the WT mice given the 35% decrease in mean CSA following DEX treatment. Calculation of specific tension (force per cross-sectional area) revealed an increase in the specific tension of both WT and MuRF1 KO mice following DEX treatment (P = 0.053).
Table 2.
Isometric contractile properties of control and dexamethasone (DEX)-treated wild type (WT) and MuRF1 null (KO) mice
| WT Con (n = 7) | WT DEX (n = 8) | KO Con (n = 5) | KO DEX (n = 6) | |
|---|---|---|---|---|
| Twitch time to peak tension (ms) | 17.3 ± 3.1 | 21.2 ± 4.5 | 17.1 ± 5.2 | 20.1 ± 2.2 |
| Twitch half-relaxation time (ms) | 13.9 ± 4.7 | 14.6 ± 4.1 | 15.0 ± 2.2 | 15.4 ± 2.7 |
| Twitch peak tension (mN) | 579.6 ± 88.9 | 604.5 ± 135.2 | 539.2 ± 81.9 | 580.9 ± 28.9 |
| Maximum isometric tension (mN) | 2086.7 ± 448.9 | 2109.3 ± 529.1 | 1802.8 ± 400.9 | 2262.1 ± 374.1 |
| Specific tension (N cm−2) | 25.3 ± 4.8 | 30.6 ± 7.7 | 22.8 ± 3.9 | 28.2 ± 8.1 |
| Twitch/tetanic ratio | 0.28 ± 0.03 | 0.29 ± 0.07 | 0.25 ± 0.04 | 0.26 ± 0.03 |
The isometric contractile properties of the gastrocnemius muscle were measured in female WT and MuRF1 KO mice following 14 days of DEX treatment. The twitch to tetanic ratio was calculated as the peak twitch tension divided by the maximum isometric force. The data are expressed as mean ± SD for a sample size equal to n.
MuRF1 KO mice are resistant to acute glucocorticoid-induced decreases in protein synthesis
As shown in Fig. 1, the greatest decrease in body mass was seen within the first 7 days of treatment, suggesting that major changes in protein turnover could be occurring during this period. Thus, we measured protein synthesis following both 3 and 14 days of glucocorticoid treatment to better understand the mechanism for muscle sparing in the MuRF1 KO mice. After 3 days of DEX treatment, the fractional protein synthesis rate of the TS dropped significantly relative to untreated controls in WT mice, but not in MuRF1 KO mice (Fig. 4A). After 14 days, fractional protein synthesis rates were not different within groups, but the MuRF1 KO control mice had a significantly higher synthesis rate compared to the WT control mice (Fig. 4B).
Figure 4. Effect of dexamethasone (DEX) treatment on the protein fractional synthesis rate.
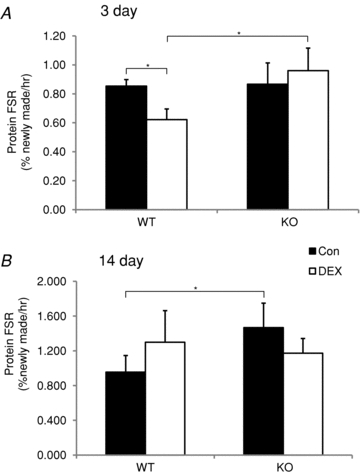
The protein fractional synthesis rate (FSR) was measured in the triceps surae (soleus, plantaris, gastrocnemius) of wild type (WT) and MuRF1 null (KO) mice after 3 (A) and 14 (B) days of either no treatment (Con, filled bars) or DEX treatment (DEX, open bars). FSR is expressed as % newly made proteins per hour. Data are mean ± SD for n = 3–4 per group. *P < 0.05.
DEX induction of select atrophy-related genes is altered in WT and MuRF1 KO mice
Glucocorticoids have previously been shown to increase MuRF1, MAFbx and FOXO expression (Bodine et al. 2001; Furuyama et al. 2003; Sandri et al. 2004). To determine if the lack of MuRF1 affects the expression of these genes, mRNA expression of MuRF1, MAFbx, FOXO1 and FOXO3a was measured in WT and MuRF1 KO mice following DEX treatment. MuRF1 expression was significantly elevated in WT mice after 3 and 14 days of DEX treatment (Fig. 5A). The lack of MuRF1 expression in the KO mice confirmed the deletion of the MuRF1 gene in these mice. MAFbx expression was significantly increased in both WT and MuRF1 KO mice after 3 and 14 days of DEX treatment, and no significant difference was found between the response of WT and KO mice (Fig. 5B). FOXO1 and FOXO3a expression was also significantly elevated after 3 days of DEX treatment in both groups of mice; however, while FOXO expression remained significantly elevated at 14 days in the WT mice, the expression of both FOXO1 and FOXO3a mRNA returned to baseline in the MuRF1 KO mice at the 14 day time point (Fig. 6A and C). Despite the increases in FOXO1 and FOXO3a mRNA expression, only FOXO1 protein was significantly elevated after DEX treatment (Fig. 6B). Significant increases in FOXO1 protein were found in both WT and MuRF1 KO mice after 3 days of DEX treatment; however, the increase in protein expression was greater in the WT than the MuRF1 KO mice. After 14 days of DEX treatment, FOXO1 protein expression was significantly elevated only in the WT mice, which mirrored the changes seen in mRNA expression. FOXO3a protein expression remained unchanged after DEX treatment in WT and KO mice (Fig. 6D).
Figure 5. Expression of MuRF1 and MAFbx in wild type (WT) and MuRF1 null (KO) mice after dexamethasone (DEX) treatment.

MuRF1 and MAFbx expression was measured in the triceps surae of female mice after either 3 or 14 days of DEX treatment. A, quantitative PCR was performed to measure MuRF1 expression in control (filled bars) and DEX-treated (open bars) WT and MuRF1 KO mice. Expression values were normalized to Rpl39 and expressed as mean ± SD (n = 3–4 per group). As expected, MuRF1 expression was not detected in the KO mice. *P < 0.05. B, MAFbx expression was assessed by Northern blot and quantified by densitometry in control (filled bars) and DEX-treated (open bars) WT and MuRF1 KO mice. *P < 0.01.
Figure 6. FOXO mRNA and protein expression in wild type (WT) and MuRF1 null (KO) mice after dexamethasone (DEX) treatment.
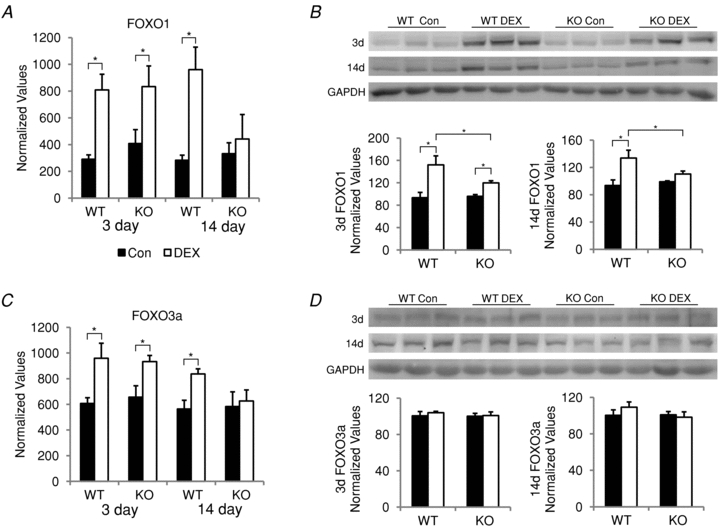
FOXO1 and FOXO3a mRNA and protein expression was measured in the triceps surae of female mice after either 3 or 14 days of DEX treatment. FOXO1 (A) and FOXO3a (C) mRNA expression in control (filled bars) and DEX-treated (open bars) WT and MuRF1 KO mice was assessed by qPCR. Expression values were normalized to Rpl39 and expressed as mean ± SD (n = 3–4 per group). *P < 0.001. Western blots of FOXO1 (B) and FOXO3a (D) protein expression in control (filled bars) and DEX-treated (open bars) WT and MuRF1 KO mice. Protein expression was quantified by densitometry and normalized to GAPDH. *P < 0.05.
Glucocorticoid treatment does not alter ubiquitin levels or proteasome activity in MuRF1 KO mice
In addition to decreases in protein synthesis, muscle atrophy can result from increases in protein degradation. Since glucocorticoids have been reported to increase protein degradation, ubiquitin levels and proteasome activity were analysed in the TS following 3 and 14 days of DEX treatment in WT and MuRF1 KO mice. Total ubiquitin and polyubiquitin levels were measured by ELISA. Total ubiquitin levels were significantly decreased after 3, but not 14 days of DEX treatment in WT mice (Fig. 7A and B). In addition, polyubiquitin levels were significantly decreased at 14 days of DEX treatment in the WT mice (Fig. 7D). No significant changes in the amount of total ubiquitin or polyubiquitin were found after 3 or 14 days of DEX treatment in the MuRF1 KO mice. Untreated MuRF1 KO mice, however, tended to have less total ubiquitin and polyubiquitin levels overall compared to untreated WT mice.
Figure 7. Total ubiquitin and polyubiquitin levels in wild type (WT) or MuRF1 null (KO) mice after dexamethasone (DEX) treatment.
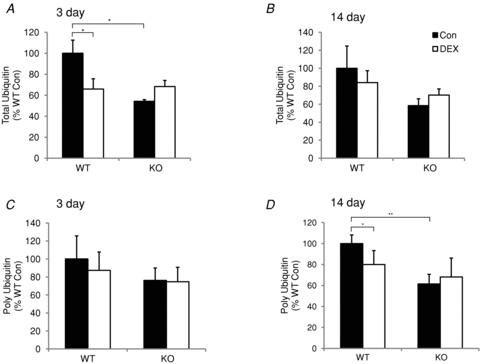
Total ubiquitin and polyubiquitin were measured in the triceps surae of female mice after either 3 or 14 days of DEX treatment. Total ubiquitin levels were measured by ELISA after either 3 (A) or 14 (B) days in WT and KO mice following no treatment (Con, filled bars) or DEX treatment (DEX, open bars). Polyubiquitin levels were measured by ELISA after either 3 (C) or 14 (D) days in WT and KO mice following no treatment (Con, filled bars) or DEX treatment (DEX, open bars). Data are expressed as a per cent of WT control values (mean ± SD, n = 3–4 per group). *P < 0.05, **P < 0.001.
Proteasome activity was unchanged for the majority of the 20S and 26S β1, β2 and β5 proteasome subunits after 3 and 14 days of DEX treatment in both WT and KO mice (Supplemental Fig. S3). The only significant difference between WT and MuRF1 KO mice was found for the 26S β5 subunit activity in the 3 day treatment group where the DEX-treated MuRF1 KO mice had a slight but significantly lower activity than DEX-treated WT mice (Fig. 8A). The decrease in 26S β5 activity in the KO mice (Fig. 8B) did not appear to be related to a decrease in β5 protein levels (Fig. 8C).
Figure 8. 26S proteasome activity in wild type (WT) and MuRF1 null (KO) mice after dexamethasone (DEX) treatment.

26S β5 proteasome activity was measured by fluorometric assay after either 3 (A) or 14 (B) days in WT and KO mice following no treatment (Con, filled bars) or DEX treatment (DEX, open bars). Data are expressed as a per cent of WT control (n = 3–4 per group). *P < 0.05. C, a representative Western blot of β5 and GAPDH protein levels in control and DEX-treated WT and MuRF1 KO mice.
MuRF1 KO mice do not show muscle sparing following nutritional deprivation
Wild type and MuRF1 KO mice were fed 20% of their normal ad libitum food intake for a period of 3 days to determine if the deletion of MuRF1 could protect against atrophy associated with elevated levels of endogenous glucocorticoids such as during nutritional deprivation (ND), which also causes a host of other hormonal and metabolic changes. A significant loss (12–20%) of body weight occurred in both WT and MuRF1 KO female mice after 3 days of ND (Supplemental Table S2). The TS mass significantly decreased in both the WT and MuRF1 KO mice, while the TA mass decreased significantly only in the MuRF1 KO mice with ND (Fig. 9). The mRNA expression of MuRF1, MAFbx, FOXO1 and FOXO3a in the TS significantly increased in the WT mice following nutritional deprivation. In contrast, in the MuRF1 KO mice, FOXO3a was unchanged, while MAFbx and FOXO1 increased significantly. Interestingly, the increase in FOXO1 expression was significantly greater in KO compared to WT, while the increase in MAFbx expression was significantly less in KO compared to WT mice. These results differ from that seen following synthetic glucocorticoid treatment.
Figure 9. Response of wild type (WT) and MuRF1 null (KO) mice to 3 days of nutritional deprivation (ND).

A, the average mass (mean ± SD, wet weight in grams) of the tibialis anterior (TA) and triceps surae (TS) was calculated in female WT and MuRF1 KO mice after no treatment (control, filled bars) or 3 days of ND (open bars). B, MuRF1, MAFbx, FOXO1 and FOXO3a mRNA expression levels were measured by qPCR in WT and MuRF1 KO mice following no treatment (Con, filled bars) or 3 days of ND (open bars). Expression levels were normalized to Rpl39 expression and expressed as a per cent of WT control (mean ± SD, n = 3–6 per group). *P < 0.05.
Discussion
Muscle atrophy is a debilitating side effect of many catabolic conditions associated with increased levels of endogenous glucocorticoids and is a serious side effect of synthetic glucocorticoids, such as dexamethasone, which are often used in the treatment of inflammatory and autoimmune disorders. While there are currently no treatments available to prevent muscle atrophy, two muscle-specific E3 ligases, MuRF1 and MAFbx, have been identified as important markers of atrophy and are thought to initiate the loss of muscle mass under a variety of conditions. The purpose of this study was to investigate whether deletion of either MuRF1 or MAFbx spares muscle mass during synthetic glucocorticoid treatment. The results of this study show that the loss of MuRF1, but not MAFbx, attenuates muscle atrophy during DEX treatment. While deletion of MuRF1 resulted in sparing of muscle mass in response to elevated synthetic glucocorticoids, there was no sparing in response to 80% food restriction, a condition that has been shown to result in elevated endogenous glucocorticoids (Wing & Goldberg, 1993). Muscle sparing in the DEX-treated MuRF1 null mice was related primarily to maintenance of protein synthesis, as we found no changes in the major proteolytic pathways (ubiquitin proteasome pathway, calpain and cathepsin L) in either the WT or MuRF1 KO mice in response to our DEX treatment regimen. Interestingly, the sparing in the MuRF1 null mice occurred without a repression of MAFbx expression, but with an inability to sustain induced FOXO1 expression.
Although MuRF1 and MAFbx expression is upregulated under a number of atrophy-inducing conditions (Bodine et al. 2001; Gomes et al. 2001; Lecker et al. 2004; Sandri et al. 2004), the function and target substrates of both proteins in vivo remains uncertain. The deletion of MuRF1 has been shown to spare hindlimb muscle mass in mice following a number of challenges including denervation (Bodine et al. 2001), hindlimb unloading (Labeit et al. 2010) and feeding a diet lacking in amino acids (Koyama et al. 2008), while deletion of MAFbx has been shown to spare mass following denervation (Bodine et al. 2001). Our data contrast with those of Clarke et al. (2007), who did not find significant muscle sparing in MuRF1 KO mice following DEX treatment. A major difference in the two studies is that we studied both female and male mice at a dose of 3 mg kg−1, rather than 1 mg kg−1, and observed significant sparing in both sexes. It should be noted that we found that female mice are more responsive to DEX than males (which were studied in Clarke et al. 2007). In humans, women have been reported to be more sensitive to exogenous glucocorticoids (Lew et al. 1993), and testosterone has been shown to protect against the catabolic effects of DEX (Zhao et al. 2008; Qin et al. 2010). Regardless of the sex difference in DEX sensitivity, treatment of MuRF1 and MAFbx KO mice with DEX clearly revealed that muscle mass was spared only in the MuRF1 KO mice. Therefore, MuRF1 and MAFbx null mice do not similarly affect the loss of muscle mass under all atrophy conditions, and thus these E3 ligases probably target proteins with very distinct functions.
Since MuRF1 is an E3 ubiquitin ligase and upregulated soon after the initiation of an atrophy-inducing stressor, it has been implicated in muscle proteolysis via degradation of contractile proteins by the ubiquitin proteasome system. Using in vitro assays, MuRF1 has been shown to ubiquitinate a number of sarcomeric proteins, including myosin heavy chain (Clarke et al. 2007; Cohen et al. 2009), myosin light chain 1 and 2 (Cohen et al. 2009), myosin binding protein C (Cohen et al. 2009; Mearini et al. 2010) and cardiac troponin I (Kedar et al. 2004). Recently, it was proposed that MuRF1 selectively degrades thick, but not thin, filament proteins under denervation conditions (Cohen et al. 2009). Further, MuRF1-mediated degradation of myosin heavy chain (MyHC) was found to occur only after the concentrations of the myosin light chains and myosin binding protein C had been reduced (Clarke et al. 2007). Following dexamethasone treatment, Clarke et al. (2007) reported a significant decrease in the concentration of MyHC in both C2C12 myotubes (after only 24 h of DEX treatment) and in mouse hindlimb muscles (after 10 days of DEX). Moreover, they report that following DEX treatment, there is a decrease in the ratio of MyHC to skeletal α-actin both in vitro and in vivo (Clarke et al. 2007). If the relative ratio of MyHC to actin should decrease following glucocorticoid treatment, then specific force of the muscle fibre should also be diminished. This, however, has not been observed following glucocorticoid treatment in vivo, and in fact, the literature shows that force output changes in proportion to cross-sectional area in single fibres following DEX-induced atrophy (Laszewski & Ruff, 1985). In the present study, Western blot analysis did not reveal a selective decrease in the relative concentration of MyHC to skeletal α-actin in response to dexamethasone (Supplemental Fig. S4). Further, no decreases in isometric contractile force were found after 14 days of DEX treatment. Both peak twitch tension and maximum isometric tension were statistically unchanged in both WT and MuRF1 KO mice following DEX treatment and calculation of specific tension (force per cross-sectional area) revealed a 21% and 24% (P = 0.053) increase in the DEX-treated WT and KO mice, respectively, which is consistent with previous reports (Gardiner et al. 1980; Baltgalvis et al. 2009).
In an attempt to understand the mechanism by which MuRF1 KO mice spare muscle mass with DEX treatment, protein synthesis rates and proteasome activity in the TS were measured to determine if the absence of MuRF1 protects against glucocorticoid-induced changes in protein turnover. Glucocorticoids have been shown to inhibit the rate of protein synthesis in vivo as early as 1 day after treatment (Shoji & Pennington, 1977), so the protein fractional synthesis rate was analysed in the TS after 3 and 14 days of DEX treatment to examine potential acute and chronic changes. After 3 days of DEX treatment, the protein fractional synthesis rate of the TS significantly decreased in the WT mice, but not in the MuRF1 KO mice. Following 14 days of DEX treatment, protein fractional synthesis rates were not significantly different between WT and MuRF1 KO mice. This suggests that one mechanism by which deletion of MuRF1 spares muscle mass is by affecting protein synthesis rather than, or in addition to, protein degradation. This alternative view to prevailing notions of MuRF1 function was also recently proposed by Koyama et al. (2008), who showed that following 4 days of amino acid deprivation the quadriceps of MuRF1 KO mice maintained two-fold higher protein synthesis rates relative to WT mice. The target of MuRF1 affecting protein synthesis, and how MuRF1 functions to govern its expression and/or activity, is currently unknown and will be an important next step in this line of research.
While it is often suggested that increases in MuRF1 promote muscle atrophy through an increase in targeted degradation of proteins by the ubiquitin proteasome system, no study has directly measured proteasome activity in mice with a deletion of MuRF1. In the present study, we measured both 20S and 26S proteasome activity, in addition to total ubiquitin and polyubiquitin levels in the TS following DEX treatment. The 26S proteasome is comprised of the 19S regulatory particle and the 20S core particle. Three β subunits within the 20S core particle have proteolytic activity and cleave unfolded polypeptides that have entered the 20S proteasome: the β1 subunit has caspase-like activity, the β2 subunit has trypsin-like activity, and the β5 has chymotrypsin-like activity. Of the three subunits, the β5 subunit has been found to be the most important for proteasome function, so significant increases in the activity of this subunit can lead to large increases in protein breakdown (Jäger et al. 1999). Previously, increases in chymotrypsin-like activity of the proteasome have been measured following 6 days of DEX treatment in rats (Combaret et al. 2004). The treatment regimen used in our study did not result in significant changes in activity in most of the 20S and 26S proteasome subunits after 3 or 14 days of DEX treatment. We did note that 26S β5 activity was significantly greater in WT than MuRF1 KO mice in the 3–day-treated TS, and that at 14 days there was a trend for the 26S β5 subunit activity to be higher in WT than MuRF1 KO mice, but it did not reach significance. Interestingly, total ubiquitin and polyubiquitin levels were consistently lower in the MuRF1 KO than WT mice under resting conditions, but this did not correlate with a significantly different proteasome activity. Further, the decreases in total ubiquitin and polyubiquitin (at 14 days) seen in the DEX-treated WT mice did not correlate with significant increases in proteasome activity. It is formally possible that proteasome activity significantly increased sometime between 3 and 14 days and thus was missed in our analyses. It is also possible that the expression or activity of deubiquitinating enzymes are altered in the MuRF1 KO mice leading to fewer ubiquitinated proteins.
Previous observations of glucocorticoid-induced increases in proteasome activity (Auclair et al. 1997; Combaret et al. 2005) could be due to the fact that food consumption is usually decreased significantly in rats following DEX treatment, adding an additional influence on muscle protein turnover. In contrast, we found no change in food or water consumption in C57Bl/6 mice (the background strain of our WT and KO mice) when given the dose of DEX used in this study (i.e. 3 mg kg−1) (data not shown). Thus, it appears that the attenuated muscle loss seen in the MuRF1 KO mice after 14 days of DEX treatment is the result of maintained levels of protein synthesis, while intriguing, we do not know the extent to which the overall lower levels of polyubiquitination in the MuRF1 KO mice relative to WT mice may have contributed to the muscle sparing in response to DEX treatment. In addition to proteasome activity, no differences were measured in the activities of calpain or cathepin L between WT and MuRF1 KO mice in controls or following DEX treatment (data not shown).
Beyond influencing protein synthesis and degradation, MuRF1 may influence the expression of genes involved in muscle atrophy as well. A number of genes have been identified as important regulators of muscle atrophy, i.e. atrogenes, since they are upregulated under a variety of atrophy-inducing conditions. These so-called atrogenes include MuRF1 itself and MAFbx and the class O Forkhead transcription factors FOXO1 and FOXO3a. FOXOs are involved in numerous cellular functions including metabolism, proliferation and survival (Accili & Arden, 2004). Two of these FOXO proteins, FOXO1 and FOXO3a, have been implicated in causing muscle atrophy, and are upregulated in response to glucocorticoid treatment (Furuyama et al. 2003; Waddell et al. 2008). FOXO3a can directly bind to the MAFbx promoter and activate its transcription (Sandri et al. 2004), while FOXO1, in combination with the glucocorticoid receptor, can significantly increase MuRF1 expression by binding to its promoter (Waddell et al. 2008). FOXO1 and FOXO3a mRNA levels were similarly upregulated in the WT and MuRF1 KO mice after 3 days of DEX treatment; however, at 14 days the levels of FOXO1 and FOXO3a mRNAs were no longer induced in the MuRF1 KO mice when sparing of muscle becomes readily apparent. FOXO1 protein expression generally followed the pattern of mRNA expression, especially at 14 days; however, we did not detect induced FOXO3a protein in any treatment group. Interestingly, while FOXO1 and FOXO3a were no longer induced at 14 days following DEX treatment in the MuRF1 KO mice, MAFbx expression remained elevated. The lack of continued FOXO1 induction in the MuRF1 KO mice may be contributing to the muscle sparing observed in these mice. Of additional note is that muscle loss was not attenuated in the MuRF1 KO mice in response to 80% food restriction, a more severe challenge than DEX treatment (at 3 mg kg−1) that caused a more rapid loss of muscle mass within 3 days. Interestingly, FOXO1 mRNA expression increased to a greater extent in the MuRF1 KO mice than in WT mice, whereas FOXO3a mRNA significantly increased in the WT, but not the KO mice. Suppression of FOXO1 expression has been suggested to be responsible for the protective effect of testosterone against DEX-induced atrophy (Qin et al. 2010). Glucocorticoid-induced atrophy was also reported to be attenuated in mice with a null deletion of myostatin; sparing in this model is accompanied by a suppression of MuRF1, MAFbx and FOXO3a expression (Gilson et al. 2007). Unfortunately, FOXO1 expression was not measured in the myostatin null mice in response to DEX. Nevertheless, a role of MuRF1 in the control of FOXO1 expression in different atrophy models is novel and could be an important component of the atrophy-inducing pathway. While the full spectrum of the role of FOX01 in skeletal muscle structure and function is not understood, recent evidence in other cell types supports a role for cytosolic FOXO1 in the induction of autophagy (Zhao et al. 2010), as well as nuclear FOXO1 in the suppression of mitochondrial function (Cheng et al. 2009).
In summary, the present results demonstrate that the deletion of MuRF1, but not MAFbx, can attenuate muscle atrophy following synthetic glucocorticoid treatment providing additional support for MuRF1 being a key regulator of the atrophy process. While MuRF1 is a good marker of muscle atrophy, it may not always be a marker of protein degradation as is often implied in the literature. A recent study reported increases in MuRF1 and MAFbx expression following alcohol intoxication with no increases in proteolysis (Vary et al. 2008). Additional roles for MuRF1 are beginning to be elucidated, as MuRF1 has been implicated in regulating carbohydrate metabolism (Hirner et al. 2008) and energy homeostasis (Koyama et al. 2008); it has also been detected in the nucleus, suggesting that it could affect transcription (Ochala et al. 2011). The current finding that deletion of MuRF1 affects protein synthesis suggests that the targets of MuRF1 ubiquitination may be other than thick filament contractile proteins, and that the role of MuRF1 in protein turnover may involve more than regulation of the ubiquitin proteasome system. Further, suppression of MuRF1 alone is not always enough to attenuate atrophy under all conditions as illustrated by the nutritional deprivation model.
Acknowledgments
We thank Drs Keith Baar and Aldrin Gomes for their advise, support and technical assistance. This work was supported by funds from NIH DK75801 (S.C.B. and J.D.F.).
Glossary
Abbreviations
- 4E-BP1
eukaryotic initiation factor 4E binding protein 1
- DEX
dexamethasone
- FOXO
class O Forkhead transcription factor
- GA
gastrocnemius muscle
- MAFbx
muscle atrophy F box
- MuRF1
muscle RING finger 1
- mTOR
mammalian target of rapamycin
- ND
nutritional deprivation
- REDD1
regulated in DNA damage and development
- S6K1
ribosomal protein S6 kinase 1
- TA
tibialis anterior
- TS
triceps surae
- TSC1
tuberous sclerosis complex 1
- TSC2
tuberous sclerosis complex 2
- UPS
ubiquitin proteasome system
Author contributions
L.M.B. is a doctoral student and contributed to the conception and design of the experiments, data collection, analysis and interpretation, and to the writing of the manuscript. J.D.F. contributed to the conception and design of the experiments, data analysis and interpretation, and to the critical revisions and final approval of the manuscript. S.C.B. contributed to the conception and design of the experiments, data collection, analysis and interpretation, and to the writing and critical revisions. All authors approved the final version of the manuscript.
Supplementary material
Supplemental Table 1
Supplemental Table 2
Supplemental Figure 1
Supplemental Figure 2
Supplemental Figure 3
Supplemental Figure 4
As a service to our authors and readers, this journal provides supporting information supplied by the authors. Such materials are peer-reviewed and may be re-organized for online delivery, but are not copy-edited or typeset. Technical support issues arising from supporting information (other than missing files) should be addressed to the authors
References
- Accili D, Arden KC. FoxOs at the crossroads of cellular metabolism, differentiation, and transformation. Cell. 2004;117:421–426. doi: 10.1016/s0092-8674(04)00452-0. [DOI] [PubMed] [Google Scholar]
- Anderson SR, Gilge DA, Steiber AL, Previs SF. Diet-induced obesity alters protein synthesis: tissue-specific effects in fasted versus fed mice. Metabolism. 2008;57:347–354. doi: 10.1016/j.metabol.2007.10.009. [DOI] [PMC free article] [PubMed] [Google Scholar]
- Auclair D, Garrel DR, Chaouki Zerouala A, Ferland LH. Activation of the ubiquitin pathway in rat skeletal muscle by catabolic doses of glucocorticoids. Am J Physiol Cell Physiol. 1997;272:C1007–C1016. doi: 10.1152/ajpcell.1997.272.3.C1007. [DOI] [PubMed] [Google Scholar]
- Baltgalvis KA, Call JA, Nikas JB, Lowe DA. Effects of prednisolone on skeletal muscle contractility in mdx mice. Muscle Nerve. 2009;40:443–454. doi: 10.1002/mus.21327. [DOI] [PMC free article] [PubMed] [Google Scholar]
- Barry SC, Gallagher CG. Corticosteroids and skeletal muscle function in cystic fibrosis. J Appl Physiol. 2003;95:1379–1384. doi: 10.1152/japplphysiol.00506.2002. [DOI] [PubMed] [Google Scholar]
- Bodine SC, Latres E, Baumhueter S, Lai VK-M, Nunez L, Clarke BA, et al. Identification of ubiquitin ligases required for skeletal muscle atrophy. Science. 2001;294:1704–1708. doi: 10.1126/science.1065874. [DOI] [PubMed] [Google Scholar]
- Cheng Z, Guo S, Copps K, Dong X, Kollipara R, Rodgers JT, et al. Foxo1 integrates insulin signaling with mitochondrial function in the liver. Nat Med. 2009;15:1307–1311. doi: 10.1038/nm.2049. [DOI] [PMC free article] [PubMed] [Google Scholar]
- Clarke BA, Drujan D, Willis MS, Murphy LO, Corpina RA, Burova E, et al. The E3 Ligase MuRF1 degrades myosin heavy chain protein in dexamethasone-treated skeletal muscle. Cell Metab. 2007;6:376–385. doi: 10.1016/j.cmet.2007.09.009. [DOI] [PubMed] [Google Scholar]
- Cohen S, Brault JJ, Gygi SP, Glass DJ, Valenzuela DM, Gartner C, et al. During muscle atrophy, thick, but not thin, filament components are degraded by MuRF1-dependent ubiquitylation. J Cell Biol. 2009;185:1083–1095. doi: 10.1083/jcb.200901052. [DOI] [PMC free article] [PubMed] [Google Scholar]
- Combaret L, Adegoke OA, Bedard N, Baracos V, Attaix D, Wing SS. USP19 is a ubiquitin-specific protease regulated in rat skeletal muscle during catabolic states. Am J Physiol Endocrinol Metab. 2005;288:E693–E700. doi: 10.1152/ajpendo.00281.2004. [DOI] [PubMed] [Google Scholar]
- Combaret L, Taillandier D, Dardevet D, Bechet D, Ralliere C, Claustre A, Grizard J, Attaix D. Glucocorticoids regulate mRNA levels for subunits of the 19 S regulatory complex of the 26 S proteasome in fast-twitch skeletal muscles. Biochem J. 2004;378:239–246. doi: 10.1042/BJ20031660. [DOI] [PMC free article] [PubMed] [Google Scholar]
- Decramer M, Lacquet LM, Fagard R, Rogiers P. Corticosteroids contribute to muscle weakness in chronic airflow obstruction. Am J Respir Crit Care Med. 1994;150:11–16. doi: 10.1164/ajrccm.150.1.8025735. [DOI] [PubMed] [Google Scholar]
- Drummond GB. Reporting ethical matters in The Journal of Physiology: standards and advice. J Physiol. 2009;587:713–719. doi: 10.1113/jphysiol.2008.167387. [DOI] [PMC free article] [PubMed] [Google Scholar]
- Dufner DA, Bederman IR, Brunengraber DZ, Rachdaoui N, Ismail-Beigi F, Siegfried BA, et al. Using 2H2O to study the influence of feeding on protein synthesis: effect of isotope equilibration in vivo vs. in cell culture. Am J Physiol Endocrinol Metab. 2005;288:E1277–E1283. doi: 10.1152/ajpendo.00580.2004. [DOI] [PubMed] [Google Scholar]
- Fitts RH, Romatowski JG, Peters JR, Paddon-Jones D, Wolfe RR, Ferrando AA. The deleterious effects of bed rest on human skeletal muscle fibers are exacerbated by hypercortisolemia and ameliorated by dietary supplementation. Am J Physiol Cell Physiol. 2007;293:C313–C320. doi: 10.1152/ajpcell.00573.2006. [DOI] [PubMed] [Google Scholar]
- Furuyama T, Kitayama K, Yamashita H, Mori N. Forkhead transcription factor FOXO1 (FKHR)-dependent induction of PDK4 gene expression in skeletal muscle during energy deprivation. Biochem J. 2003;375:365–371. doi: 10.1042/BJ20030022. [DOI] [PMC free article] [PubMed] [Google Scholar]
- Gardiner PF, Montanaro G, Simpson DR, Edgerton VR. Effects of glucocorticoid treatment and food restriction on rat hindlimb muscles. Am J Physiol Endocrinol Metab. 1980;238:E124–E130. doi: 10.1152/ajpendo.1980.238.2.E124. [DOI] [PubMed] [Google Scholar]
- Gilson H, Schakman O, Combaret L, Lause P, Grobet L, Attaix D, et al. Myostatin gene deletion prevents glucocorticoid-induced muscle atrophy. Endocrinology. 2007;148:452–460. doi: 10.1210/en.2006-0539. [DOI] [PubMed] [Google Scholar]
- Gomes AV, Zong C, Edmondson RD, Li X, Stefani E, Zhang J, et al. Mapping the murine cardiac 26S proteasome complexes. Circ Res. 2006;99:362–371. doi: 10.1161/01.RES.0000237386.98506.f7. [DOI] [PubMed] [Google Scholar]
- Gomes MD, Lecker SH, Jagoe RT, Navon A, Goldberg AL. Atrogin-1, a muscle-specific F-box protein highly expressed during muscle atrophy. Proc Natl Acad Sci U S A. 2001;98:14440–14445. doi: 10.1073/pnas.251541198. [DOI] [PMC free article] [PubMed] [Google Scholar]
- Hasselgren PO. Glucocorticoids and muscle catabolism. Curr Opin Clin Nutr Metab Care. 1999;2:201–205. doi: 10.1097/00075197-199905000-00002. [DOI] [PubMed] [Google Scholar]
- Hirner S, Krohne C, Schuster A, Hoffmann S, Witt S, Erber R, et al. MuRF1-dependent regulation of systemic carbohydrate metabolism as revealed from transgenic mouse studies. J Mol Biol. 2008;379:666–677. doi: 10.1016/j.jmb.2008.03.049. [DOI] [PubMed] [Google Scholar]
- Hu Z, Wang H, Lee IH, Du J, Mitch WE. Endogenous glucocorticoids and impaired insulin signaling are both required to stimulate muscle wasting under pathophysiological conditions in mice. J Clin Invest. 2009;119:3059–3069. doi: 10.1172/JCI38770. [DOI] [PMC free article] [PubMed] [Google Scholar]
- Jackman RW, Kandarian SC. The molecular basis of skeletal muscle atrophy. Am J Physiol Cell Physiol. 2004;287:C834–C843. doi: 10.1152/ajpcell.00579.2003. [DOI] [PubMed] [Google Scholar]
- Jäger S, Groll M, Huber R, Wolf DH, Heinemeyer W. Proteasome β-type subunits: unequal roles of propeptides in core particle maturation and a hierarchy of active site function. J Mol Biol. 1999;291:997–1013. doi: 10.1006/jmbi.1999.2995. [DOI] [PubMed] [Google Scholar]
- Kayali AG, Young VR, Goodman MN. Sensitivity of myofibrillar proteins to glucocorticoid-induced muscle proteolysis. Am J Physiol Endocrinol Metab. 1987;252:E621–E626. doi: 10.1152/ajpendo.1987.252.5.E621. [DOI] [PubMed] [Google Scholar]
- Kedar V, McDonough H, Arya R, Li H-H, Rockman HA, Patterson C. Muscle-specific RING finger 1 is a bona fide ubiquitin ligase that degrades cardiac troponin I. Proc Natl Acad Sci U S A. 2004;101:18135–18140. doi: 10.1073/pnas.0404341102. [DOI] [PMC free article] [PubMed] [Google Scholar]
- Kimball SR, Jefferson LS. Control of translation initiation through integration of signals generated by hormones, nutrients, and exercise. J Biol Chem. 2010;285:29027–29032. doi: 10.1074/jbc.R110.137208. [DOI] [PMC free article] [PubMed] [Google Scholar]
- Koyama S, Hata S, Witt CC, Ono Y, Lerche S, Ojima K, et al. Muscle ring-finger protein-1 (murf1) as a connector of muscle energy metabolism and protein synthesis. J Mol Biol. 2008;376:1224–1236. doi: 10.1016/j.jmb.2007.11.049. [DOI] [PubMed] [Google Scholar]
- Labeit S, Kohl CH, Witt CC, Labeit D, Jung J, Granzier H. Modulation of muscle atrophy, fatigue and MLC phosphorylation by MuRF1 as indicated by hindlimb suspension studies on MuRF1-KO mice. J Biomed Biotechnol. 2010;2010:693741. doi: 10.1155/2010/693741. [DOI] [PMC free article] [PubMed] [Google Scholar]
- Laszewski B, Ruff RL. Effects of glucocorticoid treatment on excitation-contraction coupling. Am J Physiol Endocrinol Metab. 1985;248:E363–E369. doi: 10.1152/ajpendo.1985.248.3.E363. [DOI] [PubMed] [Google Scholar]
- Lecker SH, Jagoe RT, Gilbert A, Gomes M, Baracos V, Bailey J, et al. Multiple types of skeletal muscle atrophy involve a common program of changes in gene expression. FASEB J. 2004;18:39–51. doi: 10.1096/fj.03-0610com. [DOI] [PubMed] [Google Scholar]
- Lecker SH, Solomon V, Mitch WE, Goldberg AL. Muscle protein breakdown and the critical role of the ubiquitin-proteasome pathway in normal and disease states. J Nutr. 1999;129:227S–237S. doi: 10.1093/jn/129.1.227S. [DOI] [PubMed] [Google Scholar]
- Lew KH, Ludwig EA, Milad MA, Donovan K, Middleton E, Jr, Ferry JJ, Jusko WJ. Gender-based effects on methylprednisolone pharmacokinetics and pharmacodynamics. Clin Pharm Ther. 1993;54:402–414. doi: 10.1038/clpt.1993.167. [DOI] [PMC free article] [PubMed] [Google Scholar]
- Marinovic AC, Zheng B, Mitch WE, Price SR. Ubiquitin (UbC) expression in muscle cells is increased by glucocorticoids through a mechanism involving Sp1 and MEK1. J Biol Chem. 2002;277:16673–16681. doi: 10.1074/jbc.M200501200. [DOI] [PubMed] [Google Scholar]
- Matthews DJ, James KA, Miller LA, Pandya S, Campbell KA, Ciafaloni E, et al. Use of corticosteroids in a population-based cohort of boys with duchenne and becker muscular dystrophy. J Child Neurol. 2010;25:1319–1324. doi: 10.1177/0883073810362762. [DOI] [PMC free article] [PubMed] [Google Scholar]
- May RC, Kelly RA, Mitch WE. Metabolic acidosis stimulates protein degradation in rat muscle by a glucocorticoid-dependent mechanism. J Clin Invest. 1986;77:614–621. doi: 10.1172/JCI112344. [DOI] [PMC free article] [PubMed] [Google Scholar]
- Mearini G, Gedicke C, Schlossarek S, Witt CC, Krämer E, Cao P, et al. Atrogin-1 and MuRF1 regulate cardiac MyBP-C levels via different mechanisms. Cardiovasc Res. 2010;85:357–366. doi: 10.1093/cvr/cvp348. [DOI] [PMC free article] [PubMed] [Google Scholar]
- Ochala J, Gustafson A-M, Diez ML, Renaud G, Li M, Aare S, et al. Preferential skeletal muscle myosin loss in response to mechanical silencing in a novel rat intensive care unit model: underlying mechanisms. J Physiol. 2011;589:2007–2026. doi: 10.1113/jphysiol.2010.202044. [DOI] [PMC free article] [PubMed] [Google Scholar]
- Odedra BR, Bates PC, Millward DJ. Time course of the effect of catabolic doses of corticosterone on protein turnover in rat skeletal muscle and liver. Biochem J. 1983;214:617–627. doi: 10.1042/bj2140617. [DOI] [PMC free article] [PubMed] [Google Scholar]
- Price SR, England BK, Bailey JL, Van Vreede K, Mitch WE. Acidosis and glucocorticoids concomitantly increase ubiquitin and proteasome subunit mRNAs in rat muscle. Am J Physiol Cell Physiol. 1994;267:C955–C960. doi: 10.1152/ajpcell.1994.267.4.C955. [DOI] [PubMed] [Google Scholar]
- Qi D, Rodrigues B. Glucocorticoids produce whole body insulin resistance with changes in cardiac metabolism. Am J Physiol Endocrinol Metab. 2007;292:E654–E667. doi: 10.1152/ajpendo.00453.2006. [DOI] [PubMed] [Google Scholar]
- Qin W, Pan J, Wu Y, Bauman WA, Cardozo C. Protection against dexamethasone-induced muscle atrophy is related to modulation by testosterone of FOXO1 and PGC-1α. Biochem Biophys Res Commun. 2010;403:473–478. doi: 10.1016/j.bbrc.2010.11.061. [DOI] [PubMed] [Google Scholar]
- Rhen T, Cidlowski JA. Antiinflammatory action of glucocorticoids – new mechanisms for old drugs. New Engl J Med. 2005;353:1711–1723. doi: 10.1056/NEJMra050541. [DOI] [PubMed] [Google Scholar]
- Ruzzin J, Wagman AS, Jensen J. Glucocorticoid-induced insulin resistance in skeletal muscles: defects in insulin signalling and the effects of a selective glycogen synthase kinase-3 inhibitor. Diabetologia. 2005;48:2119–2130. doi: 10.1007/s00125-005-1886-0. [DOI] [PubMed] [Google Scholar]
- Sacheck JM, Hyatt J-PK, Raffaello A, Jagoe RT, Roy RR, Edgerton VR, et al. Rapid disuse and denervation atrophy involve transcriptional changes similar to those of muscle wasting during systemic diseases. FASEB J. 2007;21:140–155. doi: 10.1096/fj.06-6604com. [DOI] [PubMed] [Google Scholar]
- Sacheck JM, Ohtsuka A, McLary SC, Goldberg AL. IGF-I stimulates muscle growth by suppressing protein breakdown and expression of atrophy-related ubiquitin ligases, atrogin-1 and MuRF1. Am J Physiol Endocrinol Metab. 2004;287:E591–E601. doi: 10.1152/ajpendo.00073.2004. [DOI] [PubMed] [Google Scholar]
- Sandri M, Sandri C, Gilbert A, Skurk C, Calabria E, Picard A, et al. Foxo transcription factors induce the atrophy-related ubiquitin ligase atrogin-1 and cause skeletal muscle atrophy. Cell. 2004;117:399–412. doi: 10.1016/s0092-8674(04)00400-3. [DOI] [PMC free article] [PubMed] [Google Scholar]
- Savary I, Debras E, Dardevet D, Sornet C, Capitan P, Prugnaud J, Mirand PP, Grizard J. Effect of glucocorticoid excess on skeletal muscle and heart protein synthesis in adult and old rats. Br J Nutr. 1998;79:297–304. doi: 10.1079/bjn19980047. [DOI] [PubMed] [Google Scholar]
- Schakman O, Gilson H, Thissen JP. Mechanisms of glucocorticoid-induced myopathy. J Endocrinol. 2008;197:1–10. doi: 10.1677/JOE-07-0606. [DOI] [PubMed] [Google Scholar]
- Severino C, Brizzi P, Solinas A, Secchi G, Maioli M, Tonolo G. Low-dose dexamethasone in the rat: a model to study insulin resistance. Am J Physiol Endocrinol Metab. 2002;283:E367–E373. doi: 10.1152/ajpendo.00185.2001. [DOI] [PubMed] [Google Scholar]
- Shah OJ, Kimball SR, Jefferson LS. Acute attenuation of translation initiation and protein synthesis by glucocorticoids in skeletal muscle. Am J Physiol Endocrinol Metab. 2000;278:E76–E82. doi: 10.1152/ajpendo.2000.278.1.E76. [DOI] [PubMed] [Google Scholar]
- Shoji S, Pennington RJ. The effect of cortisone on protein breakdown and synthesis in rat skeletal muscle. Mol Cell Endocrinol. 1977;6:159–169. doi: 10.1016/0303-7207(77)90082-x. [DOI] [PubMed] [Google Scholar]
- Stojanovska L, Rosella G, Proietto J. Evolution of dexamethasone-induced insulin resistance in rats. Am J Physiol Endocrinol Metab. 1990;258:E748–E756. doi: 10.1152/ajpendo.1990.258.5.E748. [DOI] [PubMed] [Google Scholar]
- Tiao G, Fagan J, Roegner V, Lieberman M, Wang JJ, Fischer JE, Hasselgren PO. Energy-ubiquitin-dependent muscle proteolysis during sepsis in rats is regulated by glucocorticoids. J Clin Invest. 1996;97:339–348. doi: 10.1172/JCI118421. [DOI] [PMC free article] [PubMed] [Google Scholar]
- Tisdale MJ. Mechanisms of cancer cachexia. Physiol Rev. 2009;89:381–410. doi: 10.1152/physrev.00016.2008. [DOI] [PubMed] [Google Scholar]
- Vary TC, Frost RA, Lang CH. Acute alcohol intoxication increases atrogin-1 and MuRF1 mRNA without increasing proteolysis in skeletal muscle. Am J Physiol Regul Integr Comp Physiol. 2008;294:R1777–R1789. doi: 10.1152/ajpregu.00056.2008. [DOI] [PMC free article] [PubMed] [Google Scholar]
- Waddell DS, Baehr LM, van den Brandt J, Johnsen SA, Reichardt HM, Furlow JD, Bodine SC. The glucocorticoid receptor and FOXO1 synergistically activate the skeletal muscle atrophy-associated MuRF1 gene. Am J Physiol Endocrinol Metab. 2008;295:E785–E797. doi: 10.1152/ajpendo.00646.2007. [DOI] [PMC free article] [PubMed] [Google Scholar]
- Wang H, Kubica N, Ellisen LW, Jefferson LS, Kimball SR. Dexamethasone represses signaling through the mammalian target of rapamycin in muscle cells by enhancing expression of REDD1. J Biol Chem. 2006;281:39128–39134. doi: 10.1074/jbc.M610023200. [DOI] [PubMed] [Google Scholar]
- Whetzel TP, Stevenson TR, Sharman RB, Carlsen RC. The effect of ischemic preconditioning on the recovery of skeletal muscle following tourniquet ischemia. Plast Reconstr Surg. 1997;100:1767–1775. doi: 10.1097/00006534-199712000-00019. [DOI] [PubMed] [Google Scholar]
- Wing SS, Goldberg AL. Glucocorticoids activate the ATP-ubiquitin-dependent proteolytic system in skeletal muscle during fasting. Am J Physiol Endocrinol Metab. 1993;264:E668–E676. doi: 10.1152/ajpendo.1993.264.4.E668. [DOI] [PubMed] [Google Scholar]
- Zhao W, Pan J, Zhao Z, Wu Y, Bauman WA, Cardozo CP. Testosterone protects against dexamethasone-induced muscle atrophy, protein degradation and MAFbx upregulation. J Steroid Biochem Mol Biol. 2008;110:125–129. doi: 10.1016/j.jsbmb.2008.03.024. [DOI] [PubMed] [Google Scholar]
- Zhao Y, Yang J, Liao W, Liu X, Zhang H, Wang S, et al. Cytosolic FoxO1 is essential for the induction of autophagy and tumour suppressor activity. Nat Cell Biol. 2010;12:665–675. doi: 10.1038/ncb2069. [DOI] [PubMed] [Google Scholar]
Associated Data
This section collects any data citations, data availability statements, or supplementary materials included in this article.