

Abstract
Sensitive assays for rapid quantitative analysis of histologic sections, resected tissue specimens, or in situ tissue are highly desired for early disease diagnosis. Stained histopathology is the gold standard but remains a subjective practice on processed tissue taking from hours to days. We describe a microscopy technique that obtains a sensitive and accurate color-coded image from intrinsic molecular markers. Spectrally reconstructed nonlinear interferometric vibrational imaging can differentiate cancer versus normal tissue sections with greater than 99% confidence interval in a preclinical rat breast cancer model and define cancer boundaries to ±100 μm with greater than 99% confidence interval, using fresh unstained tissue sections imaged in less than 5 minutes. By optimizing optical sources and beam delivery, this technique can potentially enable real-time point-of-care optical molecular imaging and diagnosis.
Introduction
Stained histopathology is the gold standard for diagnosing disease in tissue and relies on experienced pathologists to assess subtle architectural features of labeled biological structures at the subcellular, cellular, and tissue levels. By far, it is a subjective practice done remote from the patient and from processed/stained tissue that takes over a few hours to days. Current practice offers about 80% inter- and intraobserver rates for reaching the same histologic diagnoses (1). There is a significant need for a more quantitative and rapid histopathologic approach to give pathologists more powerful tools for disease diagnosis.
Optical imaging has traditionally been used for visualizing tissue and for making diagnostic decisions. Advances in molecular imaging have enabled the mapping of specific receptors, ligands, or target cells and tissues, using a wide range of exogenous contrast agents (2). In particular, these have been used to better understand the development, distribution, and response of cancer (3). Among the emerging technologies, vibrational microspectroscopy holds substantial promise for biomedical applications. The intrinsic molecular vibrational contrast provides a noninvasive characterization of the tissue with no external staining or labeling. Diseases and pathologic anomalies are associated with various structural and biochemical composition variations, which are reflected in the vibrational spectrum of the tissue. The vibrational spectrum can, thus, be used as a reliable phenotypic marker of the tissue pathology.
Near-infrared Raman spectroscopy is well suited to study various disease pathologies (4–11). However, the extremely small Raman cross sections of typical biomacromolecular buiding blocks necessitate long acquisition times. Exposure times of seconds for pixel-by-pixel spectra lead to image acquisition times of hours, unrealistic for a real-time diagnostic technique. Coherent anti-Stokes Raman scattering (CARS) microscopy, which is also based on vibrational contrast (12–15), relies on coherence enhancement to obviate the need for high incident powers and permits video rate imaging compatible with real-time diagnosis (16). However, CARS is plagued by a nonresonant background, which limits its use as a quantitative chemical imaging tool. Various methods have been reported for suppressing the background, but these limit access to broadband spectral information necessary for accurate diagnosis (6, 8, 17–19).
The speed and quantification problems are solved by nonlinear interferometric vibrational imaging (NIVI) (20–22), which combines the information content of Raman spectroscopy with the high throughput of CARS microscopy. The nonresonant CARS background is eliminated by coupling broadband CARS (23–25) to spectral interferometry (26). We have recently shown (27) that the NIVI spectra are as accurate as spontaneous Raman for analytic measurements and can be acquired 200 times faster for comparable signal to noise (S/N) ratio. The unique combination of quantitative accuracy and spectral acquisition speed makes NIVI a very promising tool for rapid tissue characterization and diagnosis. The key factors to realize this potential are i) spectral response linear to the biochemical composition of the tissue, ii) millisecond spectral acquisition to permit rapid imaging of histologic sections, resected tissue specimens, or in situ tissue, and iii) the reduction of complex spectral information to an accurate yet simple visual code, allowing diagnosis at a glance.
Here, we report such a combination of vibrational imaging and spectral visualization in spectrally reconstructed (SR) NIVI. First, NIVI captures the molecular vibrational spectrum with accurate Raman line shape at each pixel of the imaged tissue specimen (20–22, 27, 28). Next, the resulting hyperspectral cube of image data is reduced by SR into a simple color-coded tissue image that facilitates decision making. The color code is an optimized choice that reflects the relevance of spectral information content to the tissue pathology. We demonstrate the potential of SR-NIVI for cancer diagnosis in a well-characterized rat mammary tumor model that recapitulates human ductal carcinoma in situ (29–32). In less than 5 minutes of image acquisition and data processing on fresh tissue sections, we achieved a diagnostic algorithm that differentiates the pathologic state (tumor or nontumor) of rat breast tissue to greater than 99% confidence limits.
Materials and Methods
Animal protocol
All animal procedures were conducted under a protocol approved by the Institutional Animal Care and Use Committee (IACUC) at the University of Illinois Urbana-Champaign. To induce mammary tumors, 4.5-week-old female Wistar-Furth rats (Harlan, Indianapolis, IN) were injected intraperitoneally with N-nitroso-N-methylurea (NMU; 12.5 mg/mL; Sigma, St. Louis, MO) at a final concentration of 55 mg/kg on the left side of the abdominal region. A second injection of NMU was given a week later on the right side of the abdominal region. At approximately 12 weeks of age, animals were sacrificed and the mammary tumors were removed and immediately flash-frozen for later sectioning, imaging, and histologic staining. For this study, 6 normal tissue specimens were taken from 2 animals and 13 diseased specimens were taken from 5 tumors of different size and location from 3 animals.
Tissue nonlinear spectroscopy
A schematic of our microscopy setup is shown in Figure 1. Our prototype laser system was designed for flexibility and ease of manipulation. A detailed description of the instrumentation and data processing can be found elsewhere (27, 28). In brief, our laser system generates broadband pump (810 nm), Stokes (1,060 nm), and reference (655 nm) pulses (100-femtosecond pulse width) at 250 kHz that probe the C–H stretch spectral range of 2,800 to 3,100 cm−1. We weakly focused these beams (~2 μm lateral, ~10 μm axial resolution; full-width at half-maximum) in the tissue by using a 0.3 numerical aperture objective. The translational stage was raster scanned at 500 μm/s. The spectra, acquired at 1 kHz, were binned into 100 pixels for each scan line (500 μm) in the image. The lateral resolution is limited by the pixel size of 5-μm. Thus, the NIVI spectrum within each pixel represented a sampled volume of approximately 5 × 5 × 10 μm3.
Figure 1.

SR-NIVI methodology. The pump and Stokes beams interact with the third-order polarizability of the tissue specimen to yield the CARS output, which is separated from the longer wavelength input pulses and fluorescence by a spectral filter (SP). A 0.3 numerical aperture 60× objective was used. A 1,200-grove/mm grating disperses the combined CARS/reference beam onto a 2,048-pixel line camera (LC). Extraction of vibrational spectra involves calculating the inverse Fourier transform (FT) of the interferogram, zeroing of the low frequency and negative components, and then calculating the FT to yield the spectra. SVD is used to transform the spectral pixels into a single diagnostic component C, which is color mapped by the red–blue range shown (blue = positive, C = normal; red = negative, C = tumor).
Fresh tissue sections were used for imaging and were exposed for less than 30 minutes to avoid tissue degradation. Typical laser powers, verified to be nondisruptive by repetitive imaging of control tissue sections, used in this study were 10 to 15 mW of pump, 0.5 to 1 mW of Stokes, and 1 to 2 mW of reference.
Statistical data analysis for spectral reconstruction
We use singular value decomposition (SVD) for spectral decomposition and dimensionality reduction. This approach can be applied only to background-free line shapes linearly proportional to molecular concentration (as in NIVI but not ordinary CARS). The data matrix for SVD was constructed from 19 NIVI images (6 normal, 13 tumor). Each of the NIVI pixel spectra was digitized as 1,000 spectral elements in the range 2,400 to 3,300 cm−1. The NIVI spectra within each image were classified on the basis of their signal (integrated intensity between 2,800 and 3,100 cm−1) to noise (intensity standard deviation between 2,450 and 2,650 cm−1) ratio. The noisy (coded white) areas contain little spectral information compared with high signal areas (coded by saturated colors using the mapping shown in Fig. 1). Two thousand spectra for each normal image and 1,000 spectra for each tumor image, with S/N > 5, were randomly extracted and stacked as rows in a matrix of dimension 25,000 × 1,000 on which SVD was performed. The first 3 singular value basis (SVB) functions recovered 99% of the variance in the data matrix. Similar results were obtained by SVD of the 19 × 1,000 matrix, with the average spectra (spectral centroids) of the 19 NIVI images as rows.
Logistic regression analysis, which classifies the spectral projections on SVB2 and SVB3 in terms of the tissue pathology, is implemented using MATLAB (R2008a, The Math-works). The model assumes that the probability Pi that a particular tissue pixel (or tissue sample when the averaged image spectrum is considered) falls in a specific category, say normal, is given by the logistic function as follows:
| (A) |
where C2 and C3 are the projections of the spectrum onto SVB2 and SVB3, respectively. The likelihood of a given set of pathologies for the pixel set is given by the product of the individual probabilities, Pi, that the ith pixel corresponds to a specific pathology. The parameters (a, bk) are obtained using the maximum likelihood principle by maximizing the likelihood of obtaining the correct set of pathologies for the 19 samples (i.e., supervised training). Enforcing a linear boundary, where the probability of the 2 categories (normal and tumor) is equal, the equation of the decision line is obtained as follows:
| (B) |
The orthogonal component to the decision line, which contains the key diagnostic information, is color coded accordingly for spectral reconstruction of the NIVI images, as described in the Results section.
Tumor margin detection
We adapted an edge detection algorithm for noisy images (33) to automatically detect the tumor margins in SR-NIVI images. The SR-NIVI image pixel values were given by the diagnostic linear combination C of C2 and C3. For any chosen window within the image, the algorithm verifies the presence of a connected tumor margin by considering the overall pixel statistics in multiple tests. An overlapping sliding square window of 20-pixel length (100 × 100 μm2) is large enough for valid statistics and ensures the connectivity of tumor margins over the entire image. The test begins with margin confirmation and then proceeds to quantitative margin detection as detailed in the following text.
SR-NIVI images (plotting C) were presmoothed by a Gaussian of 30-μm full-width at half-maximum. A prescreening test was employed to avoid unnecessary computations. If the average C in the sliding window fell within the 99% confidence ellipses of normal/tumor pathology, then the window was deemed monomodal (no margin) and was screened out from subsequent analysis. Windows that fell outside of the ellipses were subjected to the statistical tests as detailed in the following text.
For histogram analysis, a chi-square fit test was used to compare the binned intensity distribution of the window with that of normalized monomodal distributions within normal and tumor pathologies. Tumor margins lead to deviations from monomodality and thereby to a high chi-square value.
For analysis of spatial variations, the window was further divided into 10 rectangular subwindows (4 × 20 or 20 × 4) and the homogeneity of means and variances of the subwindows was analyzed using 4 ANOVA-like tests as detailed in Suk and Hong (33). A tumor margin was a source of inhomogeneity of means and variances among the subwindows.
Each of these tests yielded a test statistic. Critical values of the test statistics, adopted from Suk and Hong (33), categorize the 3 cases of a margin being present/absent/no decision. The majority vote among the 5 tests was then taken to make the final decision on the presence of a margin. The redundancy of the multiple statistical tests makes the algorithm more reliable and less sensitive to noise.
Once the presence of a margin was confirmed, the margin was detected quantitatively as follows. By thresholding the binned intensity distribution, the window could be divided into 2 domains. The pixels that fell above the threshold were set to a high value. The image was then scanned in 2 orthogonal directions to identify the pixels (margin pixels) adjoining these high valued pixels.
Results
Figure 2 provides a comparison of SR-NIVI reconstructed tissue maps of normal and diseased rat mammary tissue with hematoxylin and eosin (H&E)-stained histology images. The sections on the left of Figure 2 are realistic examples of the contrast obtainable in real time from thick, unfixed, unstained tissue sections. The visual contrast between tumor and normal tissues is striking, even on easily prepared thick sample sections. A simple color code (blue =normal, red =cancer) allows rapid diagnosis on sample scales of less than 100 μm.
Figure 2.

Comparison of SR-NIVI images and H&E-stained histology images. Top row, adipose tissue; middle row, normal mammary tissue; bottom row, tumor tissue. All images are 300 × 300 μm2. The stained sections are 10-μm thick. The SR-NIVI images are 63 × 63 pixels, acquired in less than 5 minutes from 30- to 100-μm thick sections. The bottom 2 SR-NIVI images are full spectral reconstructions with color code (blue >99% probability of normal tissue, red >99% probability of tumor tissue), so tumor incursions less than 100 μm in size can be differentiated readily (see also Fig. 4 and the text). The adipose tissue is a spectral intensity-only NIVI image with color code: white = zero signal, blue = maximum lipid signal.
We briefly describe the SR-NIVI experimental methodology leading to the diagnostic tissue maps and discuss the prospects of SR-NIVI as a sensitive clinical diagnostic tool for real-time stain- or label-free molecular histopathologic studies. The detailed theory of NIVI has been described elsewhere (20–22). Figure 1 provides a summary of the methodology for cancer diagnosis applications. Our near-infrared laser system generates the pump, Stokes, and reference pulses that probe the carbon–hydrogen vibrational stretching region (2,800–3,100 cm−1) of the sample. The collinear pump and Stokes beams are focused into the tissue by a microscope objective. Nonlinear interaction of the pump and Stokes fields with endogenous vibrational polarizability of the sample generates a CARS output beam. The shorter wavelength CARS beam is then spectrally filtered from the pump, Stokes, and background fluorescence.
Spectral interferometry
The first key step of NIVI is to acquire both the amplitude and phase of the CARS spectrum, allowing Raman-quality, background-free spectra to be extracted. To achieve this, the CARS beam is mixed with a time-delayed reference pulse (delay ~2 picoseconds) covering the same spectral range. The spectral components of the mixed beams are dispersed by a grating, and the resulting spectral interferogram is acquired on a line camera. The principles of Fourier transform spectral interferometry (26) are used to reconstruct the complex CARS field from the interferogram. Briefly, the calibrated interferogram is inverse Fourier transformed to get the time domain response. The CARS reference time delay helps reject the DC component as well as the negative time response, forbidden by causality in the time domain. Fourier transformation of the positive time response yields the complex CARS spectrum. While the real part, which contains the nonresonant background, is rejected, the imaginary part gives the vibrational spectrum. Accurate and noise-free vibrational spectra are extracted pixel by pixel for thick tissue samples (>100 μm; see the Materials and Methods section). A NIVI hyperspectral cube is obtained by rapid raster scanning of the tissue pixel-by-pixel.
A concern for performing NIVI of biological tissue is the diffuse scattering from the tissue, which makes signal collection and phase retrieval less efficient than those obtained from a homogenous specular sample. The use of thick tissue sections (100–150 μm) as well as thin sections (<30 μm) served as a rigorous test of our system performance. The heterodyne sensitivity of NIVI effectively recouped the scattering losses. The normal and tumor tissue spectra from multiple animals differ in a very reproducible manner for tumors of different sizes and locations.
Spectral image reconstruction
The second key step is to create a SR-NIVI color-coded image from the NIVI hyperspectral cube. We used a combination of dimensionality reduction [SVD (34)] followed by classification (logistic regression) algorithms to reduce the NIVI spectrum into a color code that is representative of the tissue pathology. The resulting SR-NIVI color map of a tumor margin in Figure 1 shows tumor projections into normal tissue that taper off to a 100-μm length scale, which can be discerned at a glance.
For such a visual diagnosis to be feasible from the SR-NIVI tissue images, the normal and tumor tissue spectra must differ from one another. The transformation of mammary tissue from a normal to a diseased state reflects a variety of biochemical and morphologic changes. Earlier Raman studies, on both animal models and human breast, established that the relative abundance of lipid and protein domains is a key classifier of tissue pathology (6, 8, 17–19). Figure 3A shows the NIVI spectra (C–H stretch region) of model compounds that best represent the lipid (methyl oleate) and protein (collagen type I) domains in animal models (35, 36). These evident differences of lipid and protein NIVI spectra are our basis for classifying the tissue pathology. Figure 3B shows representative NIVI spectra of normal and tumor tissues. Comparing with Figure 3A, these differences reflect the lipid (fat) and protein (collagen) contents. The normal mammary tissue is rich in fat leading to prominent peaks at 2,855 cm−1 (CH2 stretch) and 3,015 cm−1 (=C–H stretch). Stromal proliferation switches the composition toward collagen, leading to an absence of these features in tumor spectra. This observation is also consistent with a morphologic model for human breast cancer identifying the fat to collagen ratio as a diagnostic parameter (19). Where the spectra in Figure 3A and B differ from past CARS work is in the nearly background-free Raman line shapes, linear dependence on lipid/protein content, and a high S/N ratio, as previously quantified (27, 28).
Figure 3.

Comparison of NIVI spectra. A, for reference, methyl oleate (a lipid) versus collagen (a protein). B, normal versus tumor. C, the first 3 basis spectra obtained by SVD of the normal and tumor spectral images. SVB1 is an average spectrum and contains little information to differentiate normal and tumor tissues. SVB2 and SVB3 highlight the most important differences between normal and tumor spectra resulting from relative changes in lipid versus protein composition as well as the degree of lipid saturation (small vibrational peak above 3,000 cm−1).
Visual diagnosis by SR-NIVI
To make the spectral data accessible for immediate visual diagnosis, we used SVD, followed by logistic regression to turn each NIVI spectrum in our data set into a single color code.
First, we use SVD to represent the 1,000 frequency data points of each spectral pixel by just a few SVD basis spectra, which provide a reduced dimensional framework for the classification of normal and tumor tissue spectra. Figure 3C shows the 3 most important basis spectra. Each pixel i spectrum was reconstructed as follows:
| (C) |
The SVB functions SVB2 and SVB3 provided the best space for differentiation. SVB1 is just an average spectrum with little information to differentiate normal and tumor tissues; C2 and C3 contain all the information to differentiate normal from tumor spectra.
Our full data set represented in Figure 4 consisted of 6 normal and 13 tumor tissue NIVI images from 5 animals, each of which spans 500 × 500 μm2 (100 × 100 pixels each). We used only the highest signal pixels in each image to calculate average C2 and C3 for each image (see the Materials and Methods section). Each image is represented by a point (centroid) in Figure 4. Each centroid is shown surrounded by its four-standard-deviation ellipsoid in Figure 4, calculated from pixel-to-pixel variations of the spectra.
Figure 4.

Tissue classification. Following SVD analysis, 19 normal and tumor samples from 5 animals (see the Materials and Methods section) are classified as centroids in a 2-dimensional plot of C2 and C3, which are the SVD coefficients of spectral basis functions SVB2 and SVB3 (see Fig. 3), required to reconstruct average spectra for each image according to eq. (C). Logistic regression then yields the central black region, dividing normal (top) and tumor (bottom) spectral centroids with the highest confidence interval. Centroids coded with the same color are from the same tumor. The small ellipses around individual tissue centroids are four-standard-deviations of the mean for that tissue sample. The large ellipses are 99% confidence intervals (Student’s t distribution corrected) for the separate normal and tumor tissue sets. The 2 black squares correspond to tumor margins evident as the red–blue boundaries in the corresponding SR-NIVI images.
We then used logistic regression to classify the points as “normal” or “tumor” in the reduced dimensional coordinates C2 and C3. The decision line from logistic regression maximizes the likelihood for obtaining the known diagnoses for these samples. It is given as follows:
| (D) |
The best single coordinate C is perpendicular to this decision line and is given by the linear combination as follows:
| (E) |
C is then turned into a red–blue color code according to the map shown in Figure 3. In addition to a red–blue code, the images are also coded for the signal intensity at each pixel: fully saturated corresponds to maximum signal (typically S/N > 100; see Fig. 3) and white to S/N ≤ 1.
Figure 4 also shows the 99% confidence intervals for normal and tumor categories, based on the Student’s t test on the sample set. One notices that the SR-NIVI diagnostic sensitivity is not limited by either the spectral noise within an image (small ellipsoids) or the heterogeneity among images (large ellipsoids).
The average spectrum of images containing equal amounts of normal and tumor tissues (black squares in Fig. 4) can lie near the decision line, but, in fact, when the color-coded SR-NIVI images are examined visually, the normal and tumor areas are easily discerned down to less than 100 μm. Each area by itself lies within the 99% confidence intervals. SR-NIVI, thus, spatially resolves normal and tumor tissues to less than 100 μm by color-coded spectral reconstruction that can be carried out in real time (Fig. 2).
Margin detection
It would be useful if such margins could be detected automatically. Figure 5 illustrates software detection of tumor margins at the 100-μm scale. Margins were detected by the algorithm of Suk and Hong (33) in less than a few seconds (on a Macbook Pro). The tumor margins are at the 99% confidence interval. The images for margin detection again show the optimum linear combination C of the spectral coefficients C2 and C3 from Figure 4 and eq. (E). A clean margin (<1–2 pixel wide) demarcating the tumor and normal domains can be obtained by placing the threshold at C = 0 with the algorithm. Instead of a sharp threshold, we chose as a “margin zone” 2 narrow bands tangent to the edges of the 99% confidence ellipses near the decision line. We thus obtained the tumor margin as a band with a finite width as shown in Figure 5. Pixels within the band cannot be assigned to normal or tumor tissue with greater than 99% confidence interval. The residual width of the margin and small islands of segmented regions are a result either of noise or of the spatial heterogeneity associated with tumor incursions into normal tissue.
Figure 5.
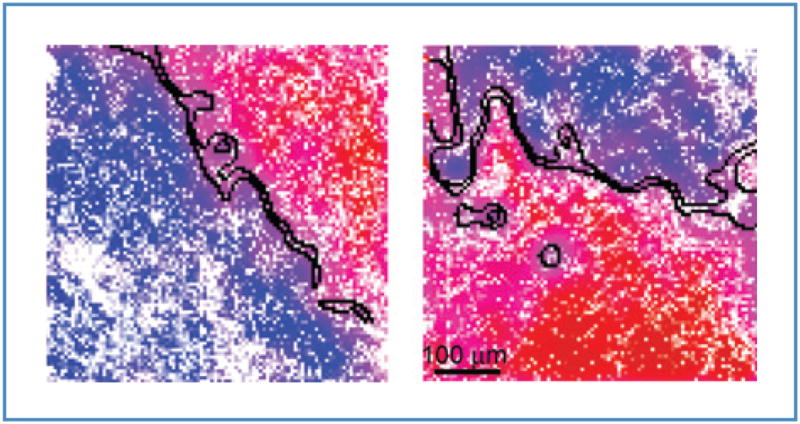
Automated tumor margin identification (black curves) overlaid on 2 smoothed representative SR-NIVI images. The 2 boundaries of the margin demarcate normal and tumor domains at the greater than 99% confidence interval. Tumor margins are readily resolved to 100 μm.
Discussion
We recently demonstrated that nonlinear interferometric vibrational spectroscopy (the spectroscopic analogue of NIVI) yields Raman-quality spectra with S/N > 500, no background, and linear sample concentration dependence (27). We were able to discern not just the approximate lipid content of a sample, as is done with CARS to quantify the unsaturation content in lipids with the same accuracy as spontaneous Raman spectroscopy, but also 200 times faster. Linearity and accuracy are the 2 key features that allow us to apply a linear spectral decomposition technique (SVD) to lipid and protein spectra in the C–H stretching region. Fast throughput extends the capabilities of NIVI as a diagnostic tool. The spectral range is limited by the finite bandwidth of our laser system. This however is not a fundamental limitation and can be expanded further with current ultrabroadband sources. Despite the reduced spectral range, the coherent sensitivity of NIVI leads to an increased S/N ratio that makes subtle spectral features discernable. This enables the extraction of the relative composition of lipids and proteins (using a signal that is linear in the concentration of the species).
As with many other cancers, breast cancer prognosis and survival depend critically on the cancer stage at diagnosis. The survival rate of less than 25% for late-stage diagnosis of metastatic breast cancer improves to better than 90% for diagnosis of an early-stage localized tumor (37). The high cost per malignancy detected, prolonged times to diagnosis, nonrepresentative sampling, and subjectivity are notable limitations of mammographic screening, tissue biopsy, and current diagnostic routines. There is an evident need for more reliable, rapid, and non- or minimally-invasive diagnostic techniques. Using a preclinical model for human breast cancer, we showed that SR-NIVI has the potential to be a real-time quantitative and objective complement to standard histology and immunohistochemistry.
The proof of principle presented in this article is amenable to a number of improvements. With recent advances in laser source technologies, the prototype instrument we describe can be assembled from commercial components into a cart-sized platform. Optical coherence tomography (38), which has a similar overhead of lasers and optics, has already been successfully tested clinically on a cart platform for the intraoperative detection of positive breast tumor margins (39). In that study, structural cell and tissue features based on optical scattering were used as diagnostic biomarkers rather than the molecular spectral signatures presented in this study.
With rapid advances in fiber lasers designed to pump nonlinear photonic crystal fibers (40, 41), key steps have been taken toward translating the SR-NIVI technique for use in a clinical environment. Rapid scanning galvanometers and high numerical aperture objectives can simultaneously increase image dimension to 1 × 1 mm2 with less than 500-nm diffraction-limited resolution while maintaining the same high throughput. Such a roughly 50-fold improvement of spatial dynamic range might allow pinpointing of individual cancer cells. The present CH-only approach can reliably distinguish normal from cancer tissues but cannot probably differentiate similar pathologies from one another. Therefore, tuning into the fingerprint spectral region will permit tapping the DNA vibrational markers, which could help classify subtle differences between pathologies. Current advances in optical fiber delivery have demonstrated nonlinear microscopic endoscopy using CARS, second harmonic generation, and two-photon fluorescence (42), paving the way for endoscopic SR-NIVI, or using fiber-based optical biopsy needles for in vivo diagnosis in real time (43). This would obviate the need for tissue sections and slides, although the tissues samples reported here already were easily obtained for unstained thick sections. One can even foresee SR-NIVI providing guidance in intraoperative surgical procedures such as lumpectomies in which the precise delineation of tumor margins is critical (39) and in which SR-NIVI could provide endogenous molecular differentiation to complement the real-time optical coherence tomography imaging of endogenous scattering structures.
Acknowledgments
We thank Rohit Bhargava from the Beckman Institute for Advanced Science and Technology for his helpful discussions and review of our work.
Grant Support
This work was supported by a grant from the National Institutes of Health, National Cancer Institute (R21/R33 CA115536). Z. Jiang was supported by the Beckman Fellows Program.
Footnotes
Disclosure of Potential Conflicts of Interest
S.A. Boppart is co-founder of Diagnostic Photonics, Inc., a company developing Interferometric Synthetic Aperture Microscopy for intraoperative imaging. He also receives royalties from patents related to optical coherence tomography, licensed from the Massachusetts Institute of Technology. The other authors disclosed no potential conflicts of interest.
References
- 1.Robbins P, Pinder S, de Klerk N, Dawkins H, Harvey J, Sterrett G, et al. Histological grading of breast carcinomas: a study of interobserver agreement. Hum Pathol. 1995;26:873–9. doi: 10.1016/0046-8177(95)90010-1. [DOI] [PubMed] [Google Scholar]
- 2.Massoud TF, Gambhir SS. Molecular imaging in living subjects: seeing fundamental biological processes in a new light. Genes Dev. 2003;17:545–80. doi: 10.1101/gad.1047403. [DOI] [PubMed] [Google Scholar]
- 3.Phelps ME. Positron emission tomography provides molecular imaging of biological processes. Proc Natl Acad Sci U S A. 2000;97:9226–33. doi: 10.1073/pnas.97.16.9226. [DOI] [PMC free article] [PubMed] [Google Scholar]
- 4.Bhargava R. Towards a practical Fourier transform infrared chemical imaging protocol for cancer histopathology. Anal Bioanal Chem. 2007;389:1155–69. doi: 10.1007/s00216-007-1511-9. [DOI] [PubMed] [Google Scholar]
- 5.Krafft C, Steiner G, Beleites C, Salzer R. Disease recognition by infrared and Raman spectroscopy. J Biophotonics. 2009;2:13–28. doi: 10.1002/jbio.200810024. [DOI] [PubMed] [Google Scholar]
- 6.Kast RE, Serhatkulu GK, Cao A, Pandya AK, Dai H, Thakur JS, et al. Raman spectroscopy can differentiate malignant tumors from normal breast tissue and detect early neoplastic changes in a mouse model. Biopolymers. 2008;89:235–41. doi: 10.1002/bip.20899. [DOI] [PubMed] [Google Scholar]
- 7.Motz JT, Gandhi SJ, Scepanovic OR, Haka AS, Kramer JR, Dasari RR, et al. Real-time Raman system for in vivo disease diagnosis. J Biomed Opt. 2005;10:031113. doi: 10.1117/1.1920247. [DOI] [PubMed] [Google Scholar]
- 8.Haka AS, Shafer-Peltier KE, Fitzmaurice M, Crowe J, Dasari RR, Feld MS. Diagnosing breast cancer by using Raman spectroscopy. Proc Natl Acad Sci USA. 2005;102:12371–6. doi: 10.1073/pnas.0501390102. [DOI] [PMC free article] [PubMed] [Google Scholar]
- 9.Hanlon EB, Manoharan R, Koo TW, Shafer KE, Motz JT, Fitzmaurice M, et al. Prospects for in vivo Raman spectroscopy. Phys Med Biol. 2000;45:R1–59. doi: 10.1088/0031-9155/45/2/201. [DOI] [PubMed] [Google Scholar]
- 10.Kneipp J, Schut TB, Kliffen M, Menke-Pluijmers M, Puppels G. Characterization of breast duct epithelia: a Raman spectroscopic study. Vib Spectrosc. 2003;32:67–74. [Google Scholar]
- 11.Shafer-Peltier KE, Haka AS, Motz JT, Fitzmaurice M, Dasari RR, Feld MS. Model-based biological Raman spectral imaging. J Cell Biochem. 2002;39:125–37. doi: 10.1002/jcb.10418. [DOI] [PubMed] [Google Scholar]
- 12.Wang HW, Fu Y, Huff TB, Le TT, Wang H, Cheng JX. Chasing lipids in health and diseases by coherent anti-Stokes Raman scattering microscopy. Vib Spectrosc. 2009;50:160–7. doi: 10.1016/j.vibspec.2008.11.007. [DOI] [PMC free article] [PubMed] [Google Scholar]
- 13.Le TT, Huff TB, Cheng JX. Coherent anti-Stokes Raman scattering imaging of lipids in cancer metastasis. BMC Cancer. 2009;9:42. doi: 10.1186/1471-2407-9-42. [DOI] [PMC free article] [PubMed] [Google Scholar]
- 14.Krafft C, Ramoji AA, Bielecki C, Vogler N, Meyer T, Akimov D, et al. A comparative Raman and CARS imaging study of colon tissue. J Biophotonics. 2009;2:303–12. doi: 10.1002/jbio.200810063. [DOI] [PubMed] [Google Scholar]
- 15.Evans CL, Xie XS. Coherent anti-Stokes Raman scattering microscopy: chemical imaging for biology and medicine. Annu Rev Anal Chem. 2008;1:883–909. doi: 10.1146/annurev.anchem.1.031207.112754. [DOI] [PubMed] [Google Scholar]
- 16.Evans CL, Potma EO, Puoris’haag M, Cote D, Lin CP, Xie XS. Chemical imaging of tissue in vivo with video-rate coherent anti-Stokes Raman scattering microscopy. Proc Natl Acad Sci U S A. 2005;102:16807–12. doi: 10.1073/pnas.0508282102. [DOI] [PMC free article] [PubMed] [Google Scholar]
- 17.Kumar KK, Chowdary MVP, Mathew S, Rao L, Krishna CM, Kurien J. Raman spectroscopic diagnosis of breast cancers: evaluation of models. J Raman Spectrosc. 2008;39:1276–82. [Google Scholar]
- 18.Brozek-Pluska B, Placek I, Kurczewski K, Morawiec Z, Tazbir M, Abramczyk H. Breast cancer diagnostics by Raman spectroscopy. J Mol Liq. 2008;141:145–8. [Google Scholar]
- 19.Shafer-Peltier KE, Haka AB, Fitzmaurice M, Crowe J, Myles J, Dasari RR, et al. Raman microspectroscopic model of human breast tissue: implications for breast cancer diagnosis in vivo. J Raman Spectrosc. 2002;33:552–63. [Google Scholar]
- 20.Marks DL, Boppart SA. Nonlinear interferometric vibrational imaging. Phys Rev Lett. 2004;92:123905. doi: 10.1103/PhysRevLett.92.123905. [DOI] [PubMed] [Google Scholar]
- 21.Marks DL, Vinegoni C, Bredfeldt JS, Boppart SA. Interferometric differentiation between resonant coherent anti-Stokes Raman scattering and nonresonant four-wave-mixing processes. Appl Phys Lett. 2004;85:5787–9. [Google Scholar]
- 22.Jones GW, Marks DL, Vinegoni C, Boppart SA. High-spectral-resolution coherent anti-Stokes Raman scattering with interferometrically detected broadband chirped pulses. Opt Lett. 2006;31:1543–5. doi: 10.1364/ol.31.001543. [DOI] [PubMed] [Google Scholar]
- 23.Chen JX, Volkmer A, Book LD, Xie XS. Multiplex coherent anti-stokes Raman scattering microspectroscopy and study of lipid vesicles. J Phys Chem B. 2002;106:8493–8. [Google Scholar]
- 24.Knutsen KP, Messer BM, Onorato RM, Saykally RJ. Chirped coherent anti-Stokes Raman scattering for high spectral resolution spectroscopy and chemically selective imaging. J Phys Chem B. 2006;110:5854–64. doi: 10.1021/jp052416a. [DOI] [PubMed] [Google Scholar]
- 25.Onorato RM, Muraki N, Knutsen KP, Saykally RJ. Chirped coherent anti-Stokes Raman scattering as a high-spectral- and spatial-resolution microscopy. Opt Lett. 2007;32:2858–60. doi: 10.1364/ol.32.002858. [DOI] [PubMed] [Google Scholar]
- 26.Lepetit L, Cheriaux G, Joffre M. Linear techniques of phase measurement by femtosecond spectral interferometry for applications in spectroscopy. J Opt Soc Am B-Opt Phys. 1995;12:2467–74. [Google Scholar]
- 27.Chowdary PD, Benalcazar WA, Jiang Z, Marks DL, Boppart SA, Gruebele M. High speed nonlinear interferometric vibrational analysis of lipids by spectral decomposition. Anal Chem. 2010;82:3812–8. doi: 10.1021/ac100222c. [DOI] [PMC free article] [PubMed] [Google Scholar]
- 28.Benalcazar WA, Chowdary PD, Jiang Z, Marks DL, Chaney EJ, Gruebele M, et al. High-speed nonlinear interferometric vibrational imaging of biological tissue with comparison to Raman microscopy. IEEE J Sel Top Quant Elec. 2010;16:824–32. doi: 10.1109/JSTQE.2009.2035537. [DOI] [PMC free article] [PubMed] [Google Scholar]
- 29.Thompson HJ, Singh M, McGinley J. Classification of premalignant and malignant lesions developing in the rat mammary gland after injection of sexually immature rats with 1-methyl-1-nitrosourea. J Mammary Gland Biol Neoplasia. 2000;5:201–10. doi: 10.1023/a:1026495322596. [DOI] [PubMed] [Google Scholar]
- 30.Thompson HJ, Singh M. Rat models of premalignant breast disease. J Mammary Gland Biol Neoplasia. 2000;5:409–20. doi: 10.1023/a:1009582012493. [DOI] [PubMed] [Google Scholar]
- 31.Singh M, McGinley JN, Thompson HJ. A comparison of the histopathology of premalignant and malignant mammary gland lesions induced in sexually immature rats with those occurring in the human. Lab Invest. 2000;80:221–31. doi: 10.1038/labinvest.3780025. [DOI] [PubMed] [Google Scholar]
- 32.Boppart SA, Luo W, Marks DL, Singletary KW. Optical coherence tomography: feasibility for basic research and image-guided surgery of breast cancer. Breast Cancer Res Treat. 2004;84:85–97. doi: 10.1023/B:BREA.0000018401.13609.54. [DOI] [PubMed] [Google Scholar]
- 33.Suk M, Hong S. An edge extraction technique for noisy images. Comp Vis Graph Image Proc. 1984;25:24–45. [Google Scholar]
- 34.Press WH, Flannery BP, Teukolsky SA, Vetterling WT. Numerical recipes in FORTRAN 77: the art of scientific computing. 2. Cambridge: Cambridge University Press; 1992. [Google Scholar]
- 35.Kline NJ, Treado PJ. Raman chemical imaging of breast tissue. J Raman Spectrosc. 1997;28:119–24. [Google Scholar]
- 36.Frank CJ, Redd DCB, Gansler TS, McCreery RL. Characterization of human breast biopsy specimens with near-IR Raman-spectroscopy. Anal Chem. 1994;66:319–26. doi: 10.1021/ac00075a002. [DOI] [PubMed] [Google Scholar]
- 37.American Cancer Society. Breast Cancer Facts & Figures 2009–2010. Atlanta, GA: American Cancer Society; 2010. [Google Scholar]
- 38.Tearney GJ, Brezinski ME, Bouma BE, Boppart SA, Pitris C, Southern JF, et al. In vivo endoscopic optical biopsy with optical coherence tomography. Science. 1997;276:2037–9. doi: 10.1126/science.276.5321.2037. [DOI] [PubMed] [Google Scholar]
- 39.Nguyen FT, Zysk AM, Chaney EJ, Kotynek JG, Oliphant UJ, Bellafiore FJ, et al. Intraoperative evaluation of breast tumor margins with optical coherence tomography. Cancer Res. 2009;69:8790–6. doi: 10.1158/0008-5472.CAN-08-4340. [DOI] [PMC free article] [PubMed] [Google Scholar]
- 40.Kimura M, editor. Fiber lasers: research, technology and applications. Nova Science Publishers; 2009. [Google Scholar]
- 41.Tu H, Boppart SA. Optical frequency up-conversion by supercontinuum-free widely-tunable fiber-optic Cherenkov radiation. Opt Express. 2009;17:9858–72. doi: 10.1364/oe.17.009858. [DOI] [PMC free article] [PubMed] [Google Scholar]
- 42.Fu L, Jain A, Cranfield C, Xie H, Gu M. Three-dimensional nonlinear optical endoscopy. J Biomed Opt. 2007;12:040501. doi: 10.1117/1.2756102. [DOI] [PubMed] [Google Scholar]
- 43.Zysk AM, Nguyen FT, Chaney EJ, Kotynek JG, Oliphant UJ, Bellafiore FJ, et al. Clinical feasibility of microscopically-guided breast needle biopsy using a fiber optic probe with computer-aided detection. Tech Cancer Res Treatment. 2009;8:315–22. doi: 10.1177/153303460900800501. [DOI] [PMC free article] [PubMed] [Google Scholar]