Abstract
We have characterized the native voltage-dependent K+ (Kv) current in rabbit urethral smooth muscle cells (RUSMC) and compared its pharmacological and biophysical properties with Kv2.1 and Kv2.2 channels cloned from the rabbit urethra and stably expressed in human embryonic kidney (HEK)-293 cells (HEKKv2.1 and HEKKv2.2). RUSMC were perfused with Hanks′ solution at 37°C and studied using the patch-clamp technique with K+-rich pipette solutions. Cells were bathed in 100 nM Penitrem A (Pen A) to block large-conductance Ca2+-activated K+ (BK) currents and depolarized to +40 mV for 500 ms to evoke Kv currents. These were unaffected by margatoxin, κ-dendrotoxin, or α-dendrotoxin (100 nM, n = 3–5) but were blocked by stromatoxin-1 (ScTx, IC50 ∼130 nM), consistent with the idea that the currents were carried through Kv2 channels. RNA was detected for Kv2.1, Kv2.2, and the silent subunit Kv9.3 in urethral smooth muscle. Immunocytochemistry showed membrane staining for both Kv2 subtypes and Kv9.3 in isolated RUSMC. HEKKv2.1 and HEKKv2.2 currents were blocked in a concentration-dependent manner by ScTx, with estimated IC50 values of ∼150 nM (Kv2.1, n = 5) and 70 nM (Kv2.2, n = 6). The mean half-maximal voltage (V1/2) of inactivation of the USMC Kv current was −56 ± 3 mV (n = 9). This was similar to the HEKKv2.1 current (−55 ± 3 mV, n = 13) but significantly different from the HEKKv2.2 currents (−30 ± 3 mV, n = 11). Action potentials (AP) evoked from RUSMC studied under current-clamp mode were unaffected by ScTx. However, when ScTx was applied in the presence of Pen A, the AP duration was significantly prolonged. Similarly, ScTx increased the amplitude of spontaneous contractions threefold, but only after Pen A application. These data suggest that Kv2.1 channels contribute significantly to the Kv current in RUSMC.
Keywords: Kv2.2, urethral tone, urethral electrophysiology
the urethra plays an important role in the maintenance of urinary continence by generating sufficient force to prevent urine outflow from the bladder. The spontaneous activity in the urethra is thought to be initiated and modulated by specialized pacemaking cells, which control the bulk smooth muscle (33). Although a number of studies have characterized the main inward currents in urethral smooth muscle and assessed their role in urethral tone (6, 9, 18), little is known about the voltage-gated K+ (Kv) currents in these cells. The majority of work on urethral K+ currents has focused on examining the role of ATP-sensitive K+ (KATP) channels in isolated pig myocytes (34–36). The contribution of other K+ channels to the electrical activity in the urethra is poorly understood, and few studies have focused on examining which Kv subtypes are present (5). Hollywood et al. (17) unmasked an iberiotoxin- and Penitrem A (Pen A)-insensitive Kv current, which was tetraethylammonium (TEA) sensitive and contributed to the repolarization phase of evoked action potentials (AP). However, the molecular identity of the Kv channels underlying the Kv current in urethra remain undetermined.
The molecular identity of Kv channels in the bladder (7, 24, 37) has been examined in more detail, and it has been demonstrated that Kv2 expression is significantly higher than Kv1 in the rat bladder (24). Similarly, Thorneloe and Nelson (37) found that the delayed rectifier currents in murine urinary bladder cells were likely to be carried through Kv2.1 channels. It is likely that these channels help regulate contractions in the bladder since, blockade of Kv2 channels with stromatoxin-1 (ScTx) enhances both myogenic and neurogenic contractions in the rat bladder (7).
Given that Kv2 channels appear to play an important role in bladder smooth muscle, we have examined whether they also contribute to the delayed rectifier in urethral smooth muscle. In this study, the molecular identity and cellular expression of the Kv current present in rabbit urethral smooth muscle cells (RUSMCs) are examined and the biophysical, pharmacological, and functional properties of the Kv current are investigated. The results demonstrate that isolated RUSMCs are immunopositive for Kv2 channels and a ScTx-sensitive Kv2 channel is likely to carry the Kv current in freshly dispersed rabbit urethral myocytes. Furthermore, a comparison of the native current with Kv2.1 and Kv2.2 cloned from the rabbit urethra and stably expressed in human embryonic kidney (HEK)-293 cells suggests that the native current shares a number of features consistent with it being Kv2.1. These data suggest that, although Kv2 channels can modify electrical activity and myogenic contractions, they only play a significant role when large-conductance Ca2+-activated K+ (BK) currents are inhibited.
MATERIALS AND METHODS
All procedures were carried out in accordance with current European Union legislation and with the approval of Dundalk Institute of Technology Animal Care and Use Committee. Male and female New Zealand White rabbits (16–20 wk old) were humanely killed with a lethal intravenous injection of pentobarbitone.
Cell Isolation
The most proximal 1.5 cm of the urethra was removed and placed in Krebs solution. Strips of proximal urethra 0.5 cm in width were cut into 1-mm3 pieces and stored in Hanks' Ca2+-free solution for 30 min before being incubated in dispersal medium containing [per 5 ml Ca2+-free Hanks' solution (see Solutions)] 15 mg collagenase (Sigma type 1A), 0.5 mg protease (Sigma type XXIV), 5 mg bovine serum albumin (Sigma), and 15 mg trypsin inhibitor (Sigma) for 10–15 min at 37°C. Tissue was then transferred to Ca2+-free Hanks' solution and stirred for a further 15–30 min to release single smooth muscle cells. These cells were plated in petri dishes containing 100 μM Ca2+ Hanks′ solution and stored at 4°C for use within 8 h.
Patch-Clamp Recordings
Currents from RUSMC were recorded with the perforated patch configuration of the whole cell patch-clamp technique (28). The cell membrane was perforated using the antibiotic amphotericin B (600 μg/ml). Patch pipettes were initially front-filled by dipping into pipette solution and then back filled with the amphotericin B-containing solution. For experiments on HEK-293 cells, currents were recorded using the ruptured patch configuration of the patch-clamp technique (13). Pipettes were pulled from borosilicate glass capillary tubing (1.5-mm outer diameter, 1.17-mm inner diameter; Clark Medical Instruments) to a tip of diameter approximately 1–1.5 μm and resistance of 2–4 MΩ.
Series resistance and capacitative currents were usually compensated by up to 80% in this study. Voltage-clamp commands were delivered via an Axopatch 1D patch-clamp amplifier (Axon Instruments) connected to a Digidata 1322A AD/DA converter (Axon Instruments) interfaced to a computer running pClamp software (Axon Instruments).
Solutions
The composition of the solutions used was as follows (in mM): Hanks' solution: 129.8 Na+, 5.8 K+, 135 Cl−, 4.17 HCO3− 0.34 HPO42−, 0.44 H2PO4−, 1.8 Ca2+, 0.9 Mg2+, 0.4 SO42−, 10 glucose, 2.9 sucrose, 10 N-2-hydroxyethylpiperazine-N′-2-ethanesulfonic acid (HEPES), pH adjusted to 7.4 with NaOH; Ca2+-free Hanks' perfusate solution: 129.8 Na+, 5.8 K+, 135 Cl−, 4.17 HCO3−, 0.34 HPO42−, 0.44 H2PO4−, 2.7 Mg2+, 0.4 SO42−, 10 glucose, 2.9 sucrose, 5 EGTA, 10 HEPES, pH adjusted to 7.4 with NaOH; Ca2+-free Hanks' cell dispersal solution: 125 NaCl, 5.36 KCl, 10 glucose, 2.9 sucrose, 15.5 NaHCO3, 0.44 KH2PO4, 0.33 Na2HPO4, 10 HEPES, pH adjusted to 7.4 with NaOH; Krebs solution: 120 NaCl, 5.9 KCl, 1.2 NaHCO3, 5.5 glucose, 12.5 CaCl2, 6 MgCl2, pH maintained at 7.4 by bubbling with 95% O2-5% CO2; K+ pipette solution (whole cell): 132 K+, 110 gluconate, 21 Cl−, 2 Na+, 0.5 Mg2+, 1 ATP, 0.1 GTP, 2.5 phosphocreatine, 5 HEPES, 1 EGTA, pH adjusted to 7.2 with KOH; and K+ pipette solution (perforated patch): 133 K+, 135 Cl−, 1 Mg2+, 0.5 EGTA, 10 HEPES, pH adjusted to 7.2 with KOH.
During experiments, the dish containing the cells was superfused with Hanks' solution. In addition, the cell under study was continuously superfused with Hanks' solution by means of a close delivery system consisting of a pipette (tip diameter 200 μm) placed ∼300 μm away. This could be switched, with a dead-space time of ∼5 s, to a solution containing a drug. All experiments were carried out at 36 ± 1°C.
Statistics
Experiments on freshly dispersed RUSMCs were usually carried out on a minimum of three animals. In all experiments, n refers to the number of cells studied. Summary data are presented as means ± SE, and statistical comparisons were made on raw data using Student's paired t-test, unpaired t-test, or ANOVA as appropriate, taking P < 0.05 level as significant.
Total RNA Isolation and RT-PCR
Total RNA was prepared from brain and urethral smooth muscle strips using the TRIzol method (Invitrogen) as per the manufacturer's instructions and treated with DNase (Stratagene). First-strand cDNA was prepared from the RNA preparations using the Superscript II RNase H reverse transcriptase (Invitrogen); 200 μg/ml of random hexamer was used to reverse transcribe the RNA sample. The cDNA formed from the reverse transcription reaction was amplified with specific primers by RT-PCR. This was preformed in a 25-μl reaction containing 12.5 μl Amplitaq Gold Mastermix (Applied Biosystems), 8.5 μl of water, 1 μl of sense and antisense primers (at a concentration of 10 μM), and 2 μl of template cDNA. All reactions were performed in a Techne TC-512 gradient thermal cycler. The amplification profile for all primer pairs was as follows: 95°C for 5 min, followed by 35 cycles of 95°C for 30 s and 56°C for 1 min, 72°C for 1 min, with a final extension step at 72°C for 7 min. The amplified products were separated by electrophoresis on a 2% agarose-1 × TAE (Tris, acetic acid, EDTA) gel, and the DNA bands were subsequently visualized by ethidium bromide staining and documented on an INGENIUS gel documentation system (Syngene Bio Imaging).
Quantitative Real-Time PCR
Quantitative real-time RT-PCR (qPCR) was performed in a 25-μl reaction containing 12.5 μl SYBR Green Mastermix (Applied Biosystems), 8.5 μl of water, 1 μl of sense and antisense primers (at a concentration of 10 μM), and 2 μl of template cDNA. The reaction was carried out using a Techne-Quantica Real Time Thermal Cycler. The thermal protocol for the qPCR was identical to that described above. We used the relative quantification method (3), using the housekeeper gene β-actin as an internal standard. Only primers with 90–110% efficiency were used for these experiments; however, differential primer efficiencies were accounted for in this analysis by generation of standard curves (range 1:2 to 1:100 dilution). Standard curves were generated for Kv subunit and β-actin mRNA from regression analysis of the mean values of RT-PCRs for the log10 diluted cDNA. Unknown quantities relative to the standard curve for the Kv primers were calculated, yielding transcriptional quantification of Kv cDNA relative to β-actin. Each cDNA sample was tested in triplicate, and cDNA was obtained from a minimum of three different animals. Mean values generated at individual time points were compared by ANOVA, and statistical analyses were performed using GraphPad Prism software (version 4; GraphPad Software, San Diego, CA). To validate that the double-stranded DNA fluorescence was primarily amplicon based (as opposed to primer dimer), melting curve analysis was employed by ramping the temperature from 70°C to 90°C, which resulted in melting of the double-stranded DNA. If one distinct peak was present, this was consistent with one PCR product resulting from the reaction.
Primer Design
All primers for PCR were designed against the published rabbit sequence except for Kv1.7, which was designed against the human sequence. For each of the following sequences, the number in parentheses is the GenBank accession number.
Kv1.2 (NM_001082722.1).
Primer sequences were as follows: sense nucleotide nt 168–183, GCAGCTGGAAGGCGTA, and antisense nt 584–568, TCTCCATGGCCTCCTCA. Amplicon size was 417 base pairs (bp).
Kv1.3 (NM_001171129.1).
Primer sequences were as follows: sense nucleotide nt 343–358, AACGTGCCCATCGACA, and antisense nt 740–756, GAGCAGCTCGAAGGAGA. Amplicon size was 414 bp.
Kv1.7 (AY779768.1).
Primer sequences were as follows: sense nucleotide nt 637–659, TGCCCTTCAATGACCCGTTCTTC, and antisense nt 886–864, AAGACACGCACCAATCGGATGAC. Amplicon size was 250 bp.
Kv2.1 (NM_001082087.1).
Primer sequences were as follows: sense nt 1060–1079, GTCCAGATCTTCCGCATCAT, and antisense nt 1255–1236, ACTTGGTGTCGTCCTCATCC. Amplicon size was 196 bp.
Kv2.2 (NM_001082137.1).
Primer sequences were as follows: sense nt 1561–1580, CGAAGTATGGAACTGATCGA, and antisense nt 1726–1707, CCTCCTGGTACTTATTCTCA. Amplicon size was 166 bp.
Kv4.2 (NM_001082118.1).
Primer sequences were as follows: sense nt 546–565, CATGGCCCTGGTGTTCTACT, and antisense nt 738–719, CAGCAAGTACTCGACGGTGA. Amplicon size was 193 bp.
Kv4.3 (NM_001082717.1).
Primer sequences were as follows: sense nt 1573–1592, ATGCAGAACTACCCGTCCAC, and antisense nt 1783–1764, GATTAAGGCTGGAGCGACTG. Amplicon size was 211 bp.
Kv5.1 (XM_002722391).
Primer sequences were as follows: sense nucleotide (nt) 732–750, 5′-GCCCAACAAGCTGCACTTC-3′, and antisense nt 854–834, 5′-ACGTTGGTCAGCTCCATCATG-3′. Amplicon size was 123 bp.
Kv6.1 (XM_002722694).
Primer sequences were as follows: sense nucleotide (nt) 272–290, 5′-AGCTCAAGGCCTGCACCAA-3′, and antisense nt 362–344, 5′-GGGTTGCGGTCGAAGAAGA-3′. Amplicon size was 111 bp.
Kv6.3 (XM_002709903).
Primer sequences were as follows: sense nucleotide (nt) 799–820, 5′-ATCTCCGTGCTGATGACAGTGT-3′, and antisense nt 919–900, 5′-TGAAGTGACGGGCAAGCTTA-3′. Amplicon size was 121 bp.
Kv9.1 (XM_002721207).
Primer sequences were as follows: sense nucleotide (nt) 1025–1043, 5′-TCTCCGGTGTGGCCTACAC-3′, and antisense nt 1135–1117, 5′-CATCCCCGTAGCCCACTGT-3′. Amplicon size was 111 bp.
Kv9.2 (XM_002710709).
Primer sequences were as follows: sense nucleotide (nt) 596–617, 5′-GCTCCATCATCACCATGTGTCT-3′, and antisense nt 714–694, 5′-GAACCAGGCTATGCCAAAGTG-3′. Amplicon size was 119 bp.
Kv9.3 (NM_001082652).
Primer sequences were as follows: sense nucleotide (nt) 796–817, 5′-TTCTATGCCACGTTGGCAGTAG-3′, and antisense nt 916–897, 5′-GCCGGGCAAGCTTTAGAATT-3′. Amplicon size was 121 bp.
β-Actin (AF404278).
Primer sequences were as follows: sense nucleotide (nt) 1–20, 5′-GATTCACCATGGATGATGAT-3′, and antisense nt 238–219, 5′-ACTAGTGATTGCTGCTCGAT-3′. Amplicon size was 238 bp.
HEK-293 Stable Transfection With Kv2.1 and Kv2.2
Total RNAs were extracted from homogenates of male New Zealand White rabbit urethra (16 wk old) using the acid guanidium thiocyanate-phenol method, followed by digestion with RNase-free DNase. Reverse-transcription was performed using SuperScript II-RNase− (Invitrogen) according to Invitrogen's protocol. The resulting cDNA products were amplified with gene-specific primers. To obtain the full-length Kv2.1 and Kv2.2 clones from rabbit urethra cDNAs, oligonucleotide primers were designed using Genetyx-Win software (version 4.0, Genetyx, Tokyo, Japan) as follows: Kv2.1 (+):5-CTCCGAATTCTCGAGTGACAGCGGCCT-3′ corresponding to nucleotides 122–138 and (−):5-CTCCTCTAGATCAGAGGAACAGCCCCCCCACT-3′ corresponding to nucleotides 2824-2803 of rabbit Kv2.1 (GenBank accession no. NM_001082087, CDS: 175–2751); Kv2.2 (+):5′-CTCCAAGCTTAACTGTCATGCTTGCCCCG-3′ corresponding to nucleotides 98–116 and (−):5′-CTCCTCTAGACTAGTCACATGCTGGTCTCCCG-3′ corresponding to nucleotides 2923-2902 of rabbit Kv2.2 (NM_001082137, CDS: 184–2919). The sequences underlined are EcoR I (GAATTC), Hind III (AAGCTT), and Xba I (TCTAGA) recognition sites that were added to insert the PCR products into vector plasmid DNA, pcDNA3.1(+)/Neor or pcDNA3.1(+)/Zeor (Invitrogen) in the proper orientation. The thermal cycler program used for PCR amplification included a 0.5-min denaturation step at 94°C, a 0.5-min annealing step at 55°C, and a 3-min primer extension step at 72°C for 40 cycles. Reaction products were separated on 1% agarose gels in Tris acetate-EDTA buffer and were recovered from gel fragments using GENECLEAN II (Qbiogene, Carlsbad, CA). After restriction enzyme digestion, the amplified products for Kv2.1 and Kv2.2 were ligated into EcoR I/Xha I and Hind III/Xba I recognition sites of pcDNA3.1(+)/Neor and pcDNA3.1(+)/Zeor, respectively (pcDNA-rbKv2.1, pcDNA-rbKv2.2). Sequence homology of cloned cDNAs was confirmed by DNA sequence analysis with an ABI PRISM (model 310) (Applied Biosystems, Foster City, CA). The HEK-293 cell line was obtained from Health Science Research Resources Bank (HSRRB) (Tokyo, Japan) and maintained in complete DMEM containing penicillin (100 U/ml) and streptomycin (100 μg/ml). A mammalian expression vector was used for stable transfection by calcium phosphate precipitation, and then 1 mg/ml geneticine (Invitrogen) (for pcDNA-rbKv2.1) and zeocine (Invitrogen) (for pcDNA-rbKv2.2)-resistance cells were selected and identified by RT-PCR analysis, respectively.
Immunocytochemistry
Single cells were plated on 35-mm glass-bottom culture dishes, and culture medium was removed from HEK cells before staining. Cells were washed in phosphate-buffered saline (PBS) and fixed in a solution containing 2% paraformaldehyde (for Kv2.1 and Kv2.2 antibodies) made up in PBS or acetone (for Kv9.3 antibody) for 20–30 min. The fixative was then removed and cells were washed three times in PBS at 5-min intervals. Cells were permeabilized in a PBS solution containing 0.3% Triton X-100 and 3% goat serum for 10 min. Cells were again washed three times with PBS at 5-min intervals.
Primary antibodies were prepared as per manufacturer's instructions and optimized for use with this cell type. The primary antibodies (Alomone Labs, Jerusalem, Israel) were incubated with the cells overnight at 4°C in a humidified box. Primary antibody was removed and cells were washed a further three times with PBS. The secondary antibody, Alexa 488 anti-rabbit (Invitrogen, Kv2.1 and Kv2.2), or anti-goat (Invitrogen, Kv9.3) was prepared at a 1:1,000 dilution in 1 ml PBS with 3% goat serum. Cells were incubated in secondary antibody at 4°C for 1 h. Cells were washed with PBS five times before imaging. Dishes were mounted onto and imaged with an upright Axioskop 2 LSM 510 Meta confocal microscope (Zeiss). Cells were excited with a 488-nm laser and emission was detected at >505 nm.
Western Blot Analysis
Protein fractions of the plasma membrane were prepared from HEK-293 cells according to the Alomone Laboratory protocol (http://www.alomone.com). Protein fractions were solubilized with sample buffer including 1% SDS and subjected to SDS-PAGE (10%). The blots were incubated with anti-Kv2.1 or anti-Kv2.2 antibody (Alomone Labs), and then incubated with anti-rabbit horseradish peroxidase-conjugated IgG (Chemicon, Temecula, CA). An enhanced chemiluminescence detection system (Amersham Biosciences, Piscataway, NJ) was used for the detection of the bound antibody. Resulting images were analyzed by a LAS-1000 device (Fujifilm, Tokyo, Japan). Primary antibody preincubated with excess antigen was tested for specificity confirmation.
Tension Recordings
Strips of smooth muscle (8 × 1 × 1 mm) were removed from the rabbit urethra, placed in water-jacketed organ baths maintained at 36 ± 1°C, and perfused with warmed Krebs solution that was bubbled with 95% O2-5% CO2 and contained atropine (1 μM), guanethidine (1 μM), and NG-nitro-l-arginine (NO-ARG, 100 μM) to block any contribution from neurotransmitters. Strips were adjusted to a tension of 2–4 mN and allowed to equilibrate for 50 min before experimentation began. Contractions were measured using the multichannel Myobath system, and data were acquired using DataTrax 2 software (WPI, Europe).
Drugs
Amphotericin B, atropine, guanethidine, NO-ARG, α-dendrotoxin, κ-dendrotoxin, and Pen A were all obtained from Sigma. Stromatoxin and margatoxin were supplied by Alomone Labs. Iberiotoxin was obtained from Tocris. All drugs were made up in the appropriate stock solution before being diluted to their final concentrations in Hanks′ solution.
RESULTS
Using our dispersal procedure, relaxed urethral smooth muscle cells (RUSMC) and interstitial cells (ICC) could be reliably isolated from the rabbit urethra. The SMC were easily distinguished from the ICC because they were unbranched, spindle shaped, and contractile.
Blockade of BK Current Unmasks a Kv Current in RUSMCs
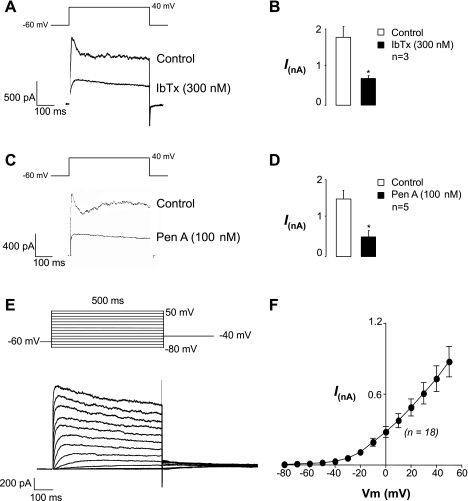
In this set of experiments, currents were recorded using the perforated patch configuration of the patch-clamp technique. Under voltage clamp at −60 mV, the SMC were electrically quiescent as demonstrated previously (33). When cells were depolarized from −60 mV to +40 mV for 500 ms, large transient and sustained outward currents were evoked (Fig. 1, A and C). We first examined the effects of the selective BK channel toxin iberiotoxin (IbTx, 300 nM) on these currents to ascertain whether they were due to activation of BK channels. As Fig. 1A suggests, application of IbTx abolished the transient current and also reduced the amplitude of the sustained current. A summary bar chart for three similar experiments is shown in Fig. 1B. Under control conditions, the peak current was 1,767 ± 307 pA at +40 mV and this was significantly reduced in IbTx to 622 ± 142 pA (P < 0.01, paired t-test). We also examined the effects of the BK channel blocker Pen A (100 nM) on the outward current evoked by a step to +40 mV, and as Fig. 1C suggests, blockade of the BK current unmasked a slowly activating, sustained outward current. Figure 1D shows summary data obtained from five cells in which Pen A significantly reduced the peak outward current at +40 mV from 1,456 ± 258 to 438 ± 179 pA (P < 0.05). Taken together, these data suggest that the transient current and a component of the sustained current in urethral SMC are due to the activation of BK channels and when this is blocked, a slowly activating Kv current is unmasked. In a separate set of experiments the effects of IbTx were assessed after Pen A application, and it was found to have no additional effect (n = 5). Similarly, application of Pen A (100 nM) after application of IbTx (300 nM) failed to further reduce the currents (n = 3), suggesting that Pen A selectively blocks BK current in these cells. To study the Kv current in more detail, all subsequent voltage-clamp experiments on RUSMC were carried out in the presence of 100 nM Pen A.
Fig. 1.
Blockade of transient large-conductance Ca2+-activated K+ (BK) current in urethral smooth muscle cells (USMCs) unmasks a slowly activating outward current. Currents were evoked from −60 mV to +40 mV for 500 ms and repolarized back to −60 mV. A: iberiotoxin (IbTx) blocks BK current and unmasks a delayed rectifier current. B: ∼30% of outward current is insensitive to IbTx. C: Penitrem A (Pen A) also blocks the transient and sustained currents to unmask a voltage-dependent K+ (Kv) current. D: summary data showing the effect of Pen A on peak outward current evoked by a step to +40 mV. E: typical current-voltage (I–V) plot of the Kv currents. Note that large tail currents were elicited when this cell was repolarized back to −40 mV. F: summary I–V plot of Kv currents recorded in Ca2+-free solution and Pen A (n = 18). *P < 0.05. Vm, membrane potential.
Figure 1E, top, shows the voltage protocol used to evoke Kv currents in RUSMC, which involved holding the cell at −60 mV and depolarizing it from −80 mV to +50 mV in 10-mV steps for 500 ms before repolarizing back to −40 mV. These experiments were carried out in Ca2+-free Hanks' solution to remove contaminant Ca2+ currents (6, 18). As Fig. 1E, bottom, suggests, outwardly rectifying, sustained currents were recorded in response to these depolarizing voltage steps and large, slowly deactivating tail currents were evoked upon repolarization to −40 mV. Figure 1F shows a summary current-voltage (I-V) plot taken from 18 cells and illustrates that the Kv current was activated at potentials positive to −50 mV.
Evidence That Kv1 Channels Do Not Contribute to the Kv Current in Rabbit Urethral Myocytes
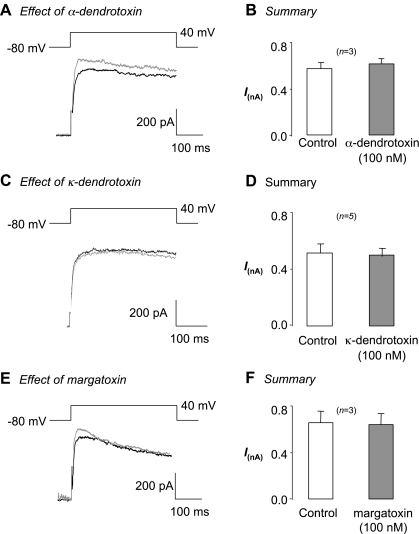
Given that Kv1 channels have been shown to play an important role in smooth muscle excitability (1, 3, 4, 8, 16, 32, 38), we first determined whether these channels contributed to this current by examining the effects of a variety of Kv1-specific toxins on currents evoked by steps from −60 to +40 mV. As Fig. 2A illustrates, application of the Kv1.1/Kv1.2/Kv1.6 blocker α-dendrotoxin (100 nM, gray trace) did not inhibit the current, even though it has been shown to block Kv1 channels in the nanomolar range (15, 29). In three similar experiments, application of α-dendrotoxin failed to significantly alter the current (control was 575 ± 53 pA compared with 617 ± 45 pA in α-dendrotoxin). Similarly, the Kv1.1 blocker κ-dendrotoxin did not block the current (Fig. 2, C and D, 515 ± 61 pA in control compared with 498 ± 57 pA in toxin, n = 5). Application of the pan-Kv1 blocker margatoxin (100 nM) was also without effect, as shown in Fig. 2E. In three experiments, application of this toxin had no significant effect on the Kv current (control was 686 ± 99 pA compared with 669 ± 102 pA; not significant). Taken together, these data suggest that the Kv current in rabbit urethral myocytes is unlikely to be due to homomers or heteromers of Kv1 subunits.
Fig. 2.
Rabbit USMC (RUSMC) Kv current is resistant to Kv1-selective toxins. Currents were evoked in all experiments from −80 mV to +40 mV for 500 ms. A: effect of α-dendrotoxin on the Kv current from USMCs in the presence of Pen A. B: summary data from 3 cells in which α-dendrotoxin (filled bars) failed to inhibit the Kv current. C: effect of κ-dendrotoxin on the Kv current from USMCs in the presence of Pen A. D: summary data from 5 cells in which κ-dendrotoxin (filled bars) failed to inhibit the Kv current. E: the pan-Kv1 blocker margatoxin also failed to block the Kv current evoked by a step to +40 mV. F: summary data from 3 cells.
Evidence That Kv2 Channels Do Contribute to the Kv Current in Rabbit Urethral Myocytes
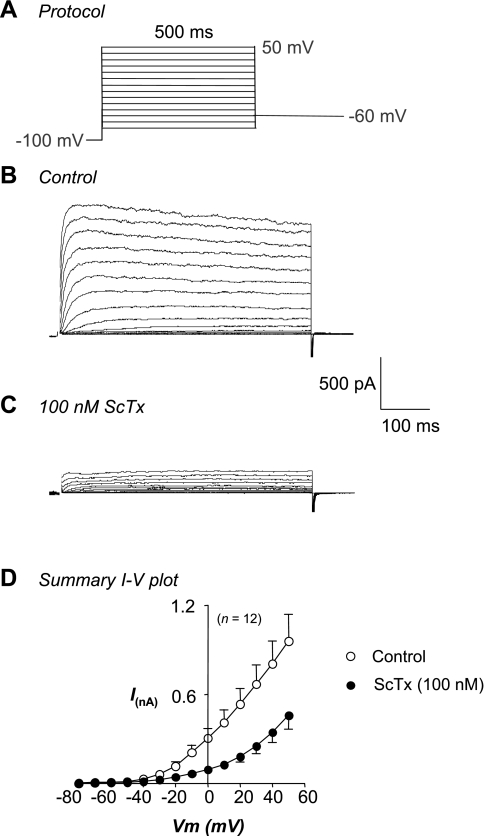
To test whether Kv2 channels were functionally expressed in rabbit urethral smooth muscle cells, we examined the effects of the Kv2 channel gating modifier, ScTx, on families of currents evoked by steps from −80 to +50 mV in 10-mV increments from a holding potential of −100 mV. When cells were stepped back to −60 mV, outward tail currents were difficult to resolve. Escoubas et al. (10) have previously shown that 100 nM ScTx reduced the amplitude of Kv2.1 currents in COS cells evoked by a step to +50 mV by ∼75%. As Fig. 3, B and C, demonstrates, application of 100 nM ScTx reduced the amplitude of the RUSMC currents. Figure 3D shows summary I-V plots of the Kv currents in the absence (open circles) and presence (filled circles) of ScTx obtained from 12 cells. ScTx significantly reduced the amplitude of currents at potentials positive to −30 mV, and the toxin appeared to block more effectively at negative membrane potentials. Thus, at 0 mV the peak current was reduced by ∼70%, from 306 ± 67 pA to 94 ± 20 pA compared with only 50% blockade at +50 mV, where the currents were reduced from 961 ± 182 pA to 460 ± 93 pA in the presence of ScTx.
Fig. 3.
RUSMC Kv current is sensitive to stromatoxin-1 (ScTx). A: voltage protocol. B: typical family of currents recorded in the absence of external Ca2+ and the presence of Pen A (100 nM). C: currents from the same cell in the presence of ScTx (100 nM). D: summary I-V plots from 12 cells of peak outward current in the absence (○) and presence (●) of ScTx (100 nM).
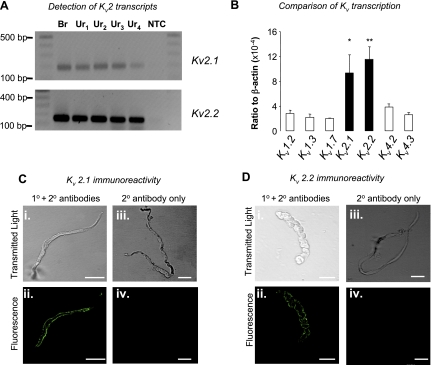
We next used RT-PCR to examine the expression profile of message for the Kv2 family members. As Fig. 4A demonstrates, PCR products for Kv2.1 (top; expected amplicon = 196 bp) and Kv2.2 (bottom; expected amplicon = 146 bp) were amplified from brain tissue (Br) and strips of urethra taken from four animals (Ur1–Ur4) but were absent in the nontemplate controls. To examine the quantitative expression of the two Kv2 subtypes in urethra (relative to β-actin), we performed qPCR on urethral strips taken from six animals. As Fig. 4B suggests, there was robust expression of Kv2.1 and Kv2.2 mRNA, but there was no significant difference in transcriptional expression levels between the two subtypes (paired t-test). When we examined the transcriptional expression of Kv1.2, Kv1.3, Kv1.7, Kv4.2, and Kv4.3 in three strips, we found that they were approximately threefold lower than either of the Kv2 family members.
Fig. 4.
Transcriptional and immunocytochemical detection of Kv2 subtypes in the rabbit urethra (Ur). A, top: transcriptional detection of Kv2.1 detected in control [brain (Br), top] and strips of urethra (bottom) from 4 animals. Expected amplicon size = 196 bp. A, bottom: Kv2.2 detection in the same 5 tissues. Expected amplicon size = 149 bp. No signal was detected in either nontemplate control (NTC). B: quantitative real-time RT-PCR (qPCR) determination of Kv2.1 and Kv2.2 transcriptional detection obtained from urethra from 6 animals. The expression of Kv2 message (n = 6, filled bars) was approximately threefold higher compared with Kv1.2, Kv1.3, Kv1.7, Kv4.2, or Kv4.3 (n = 3, open bars). *P < 0.05, **P < 0.01. C: transmitted light and fluorescent images obtained from freshly dispersed RUSMC incubated with anti-Kv2.1 primary and secondary (Ci and Cii) antibodies, or with secondary antibody alone (Ciii and Civ). D: transmitted light and fluorescent images obtained from freshly dispersed RUSMC incubated with anti-Kv2.2 primary and secondary (Di and Dii) antibodies, or with secondary antibody alone (Diii and Div). The calibration bars represent 20 μm.
Given that the transcriptional expression data were obtained from tissue strips, rather than isolated cells, it is possible that the data reflect Kv2 transcriptional expression in nerves or blood vessels in the urethra. Therefore, to test whether Kv2 was expressed in isolated RUSMC, we next performed immunocytochemistry with specific anti-Kv2.1 and anti-Kv2.2 antibodies. As Fig. 4C shows, membrane limited staining was obtained only when primary and secondary antibodies (Fig. 4Cii) raised against Kv2.1 were present. No immunoreactivity to Kv2.1 was detected when the antibody was incubated with an excess of antigen (data not shown). When cells were incubated with monoclonal mouse anti-Kv2.2 primary antibodies (Antibodies, Davis, CA) and stained with a goat anti-mouse Alexa 488 secondary antibody, some immunoreactivity was observed (Fig. 4Dii). Patchy staining appeared to be largely confined to membrane-bound areas although some intracellular staining was also present throughout the cells. It is unclear whether this was a result of poor antibody interaction or reflective of actual Kv2.2 distribution. However, secondary controls in which the primary antibody was omitted showed no immunoreactivity (Fig. 4Div).
Comparison of the Native ScTx-Sensitive Current With Kv2.1 and Kv2.2 Channels Cloned From the Rabbit Urethra
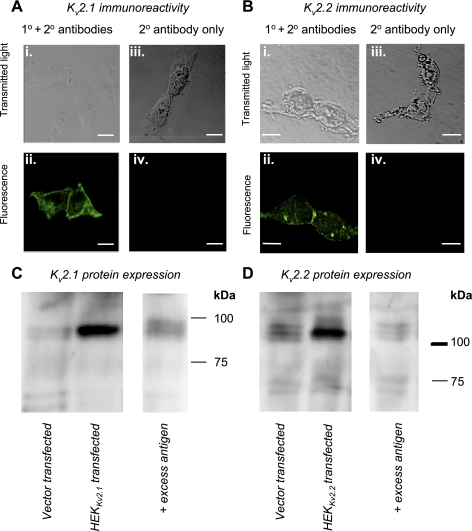
Having established that the majority of the Kv current in RUSMC was ScTx sensitive, we next cloned Kv2.1 and Kv2.2 from the rabbit urethra and stably expressed them in HEK-293 cells. We performed immunocytochemistry with specific anti-Kv2.1 and anti-Kv2.2 antibodies detailed above on each clone of the Kv2 channel. As Fig. 5A shows, membrane limited staining of HEKKv2.1 cells was obtained only when primary and secondary antibodies (Fig. 5Aii) raised against Kv2.1 were present. No immunoreactivity to Kv2.1 was detected when the antibody was incubated with an excess of antigen (data not shown). Similarly, the HEKKv2.2 were only immunopositive when incubated with both primary and secondary antibodies (Fig. 5Bii).
Fig. 5.
Immunocytochemical detection of Kv2 subtypes in human embryonic kidney (HEK) cells. A: transmitted light and fluorescent images obtained from HEK cells stably transfected with Kv2.1 and incubated with anti-Kv2.1 primary and secondary (Ai and Aii) antibodies, or with secondary antibody alone (Aiii and Aiv). B: transmitted light and fluorescent images obtained from HEK cells stably transfected with Kv2.2 incubated with anti-Kv2.2 primary and secondary (Bi and Bii) antibodies, or with secondary antibody alone (Biii and Biv). The calibration bars represent 20 μm. C: Western blots from membrane fractions obtained from vector-transfected HEK cells (left lane), HEK cells stably transfected with Kv2.1 (middle lane), and incubated with anti-Kv2.1 primary antibody in the presence of excess antigen (right lane) D: Western blots from membrane fractions obtained from vector-transfected HEK cells (left lane), HEK cells stably transfected with Kv2.2 (middle lane), and incubated with anti-Kv2.2 primary antibody in the presence of excess antigen (right lane).
We confirmed the molecular weights of Kv2.1 and Kv2.2 proteins cloned from rabbit urethra in HEK cells by Western blotting. Figure 5, C and D, shows that bands around 100 and 110 kDa were detected, consistent with the molecular mass predicted from rabbit Kv2.1 (95 kDa) and Kv2.2 (102 kDa), respectively, in the stably transfected cells (middle lanes), but not the vector-transfected HEK cells (left lanes). This immunoreactivity was decreased following preincubation of anti-Kv2.1 and anti-Kv2.2 antibodies with excess antigens, respectively (right lanes).
To compare the biophysical and pharmacological properties of the native Kv current with currents in HEKKv2.1 and HEKKv2.2 cells, we used the ruptured patch configuration of the patch-clamp technique. As a control, I-V relationships were determined from nontransfected HEK cells to measure the amplitude of endogenous currents. In three cells the mean amplitude of currents evoked by a depolarizing step to +60 mV was +380 ± 126 pA, suggesting that the endogenous currents were unlikely to contaminate our recordings significantly.
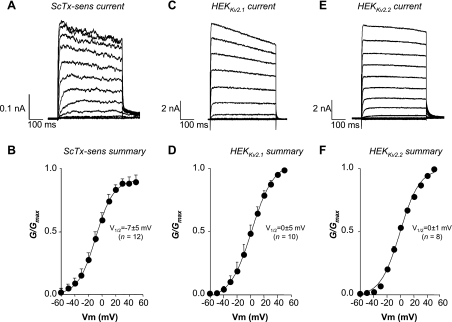
Figure 6 shows that HEKKv2.1, HEKKv2.2, and RUSMC Kv currents had similar kinetics and voltage-dependent activation. However, a much slower tail current was observed in the native RUSMC (Fig. 6A) in response to a repolarizing step to −40 mV, compared with the HEKKv2.1 and HEKKv2.2 cells. Figure 6, A and B, shows typical currents and summary activation curves, respectively, of the ScTx-sensitive (100 nM) difference currents obtained in freshly dispersed RUSMC in which the mean activation V1/2 was −7 ± 5 mV (n = 12). This was not significantly different from the activation V1/2 obtained from HEKKv2.1 (0 ± 5 mV, n = 10, Fig. 6D) or HEKKv2.2 cells (0 ± 1 mV, n = 8, Fig. 6F).
Fig. 6.
Comparison of RUSMC ScTx-sensitive Kv current with currents from HEK cells stably transfected with Kv2.1 and Kv2.2 channels. A: typical family of ScTx-sensitive difference currents obtained by digitally subtracting the current in the presence of ScTx from the control currents. B: mean activation data obtained from the ScTx-sensitive difference currents from 12 RUSMC. C and D: typical family of Kv2.1 currents and the associated activation curve, respectively. E and F: typical Kv2.2 currents and the summary activation curve, respectively. The solid lines in B, D, and F show the Boltzmann fits of the mean data ± SE. Gmax, maximal conductance; V1/2, voltage at half-maximal activation.
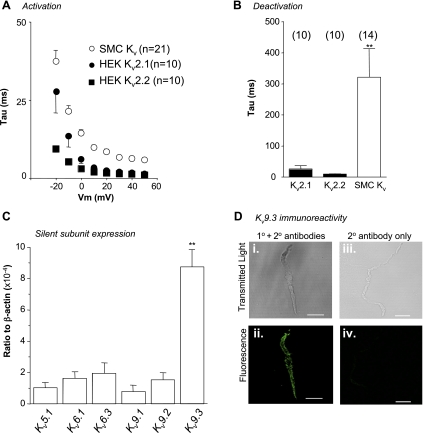
To examine the kinetics of the currents in more detail, we first measured the activation time constants (τ) of the RUSMC ScTx-sensitive currents and compared these with the HEKKv2.1 and HEKKv2.2 currents. As Fig. 7A suggests, the activation time constants of all three currents decreased with depolarization. The HEKKv2.1 currents (filled circles, n = 10) had slower activation time constants than HEKKv2.2 (filled squares, n = 10) at potentials negative to 0 mV. However, at positive potentials, the activation time constants of the currents in HEKKv2.1 and HEKKv2.2 cells were indistinguishable from each other, and both were significantly different from the RUSMC (P < 0.05, ANOVA). Similarly, as shown in Fig. 7B, the deactivation time constants in HEKKv2.1 (26 ± 14 ms, n = 10, range 6–122 ms), and HEKKv2.2 cells (9 ± 1 ms, n = 10, range 7–14 ms) were not significantly different, although there was more variation in the HEKKv2.1 currents. A much more slowly deactivating tail current was evident in the RUSMC (Fig. 7B, τ = 322 ± 91 ms, n = 14, P < 0.05, ANOVA). There was considerable variation in the rate of deactivation of the RUSMC Kv current, and the time constant in these cells ranged from 66 ms to 1,300 ms. These data suggest that there may be some heterogeneity in the ion channel expression perhaps caused by the variable expression of silent Kv subunits.
Fig. 7.
Evidence that RUSMC express silent Kv subunits. A: time constant of activation is plotted against voltage for native cells (○) and HEK cells expressing Kv2.1 (●) and Kv2.2 (■). B: deactivation time constant measured following a repolarizing step to −40 mV from 30 mV in native cells (n = 14) and HEK cells stably expressing Kv2.1 (n = 10) and Kv2.2 (n = 10). **P < 0.01. C: q-PCR data comparing the transcriptional expression of silent Kv subunits in the rabbit urethra. **P < 0.01. D: transmitted light and fluorescent images obtained from freshly dispersed RUSMC and incubated with anti-Kv9.3 primary and secondary (Di and Dii) antibodies, or with secondary antibody alone (Diii and Div).
To assess whether the slow tail current deactivation in RUSMC was due to the presence of silent Kv subunits in RUSMC, we next compared the quantitative transcriptional expression of a number of silent family members. As Fig. 7C suggests, transcriptional expression of Kv9.3 was highest of all the members tested. To check whether the isolated RUSMC showed functional expression of this modulatory subunit, we used immunocytochemistry with specific anti-Kv9.3 antibodies. As Fig. 7D shows, membrane limited staining was obtained only when primary and secondary antibodies (Fig. 7Dii) raised against Kv9.3 were present, suggesting that this regulatory Kv subunit was present in RUSMC.
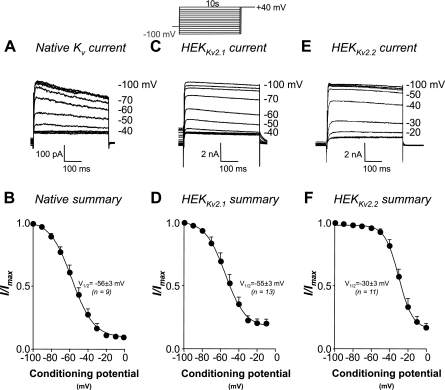
We next examined the voltage dependence of steady-state inactivation of the three currents using a standard double pulse protocol. Cells were subjected to 10-s conditioning steps from −100 mV to 0 mV in 10-mV increments before stepping to a test potential of +40 mV for 500 ms to maximally activate the Kv current. Figure 8, A, C, and E, shows typical recordings of the currents obtained by the step to +40 mV following the preceding conditioning potentials in RUSMC, HEKKv2.1, and HEKKv2.2 cells, respectively. When these data were normalized, plotted, and fitted with the Boltzmann equation, inactivation V1/2 values of −56 ± 3, −55 ± 3, and −30 ± 3 mV were obtained for the native RUSMC (Fig. 8B, n = 9), Kv2.1 (Fig. 8D, n = 13), and Kv2.2 (Fig. 8F, n = 11) currents, respectively. There was no significant difference in the inactivation V1/2 between the native RUSMC current and the HEKKv2.1 current, but both were significantly different from the HEKKv2.2 current (P < 0.05, ANOVA). These data suggest that the steady-state inactivation properties of the native RUSMC Kv currents are more similar to HEKKv2.1 than HEKKv2.2 currents.
Fig. 8.
Steady-state inactivation of the native Kv current is similar to Kv2.1, but not Kv2.2, channels stably expressed in HEK cells. Standard double pulse protocols, shown in the inlay, were used to examine the steady-state voltage-dependent inactivation of Kv currents in RUSMC (A), Kv2.1 (C), and Kv2.2 channels (E) stably expressed in HEK cells. Summary inactivation curves for native Kv in RUSMC (B, n = 9), Kv2.1 (D, n = 13), and Kv2.2 channels (F, n = 11) expressed in HEK cells are shown. The solid lines represent the Boltzmann fit to the data, and the mean inactivation V1/2 is shown. Imax, maximum current.
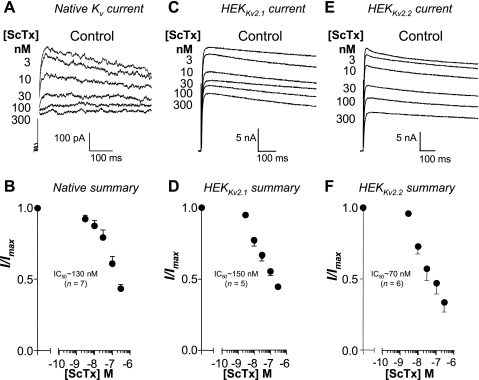
To establish the sensitivity of the currents to ScTx, we examined the effects of increasing concentrations on currents evoked by a step to +40 mV. Figure 9, A, C, and E, shows typical currents obtained in the absence and presence of increasing concentrations of ScTx in RUSMC, HEKKv2.1, and HEKKv2.2 cells, respectively. Unfortunately, we did not use sufficiently high concentrations of ScTx to permit the construction of full concentration-effect curves, but the data show that ScTx caused a concentration-dependent reduction of the currents. When the summary data were plotted for RUSMC (Fig. 9B), HEKKv2.1 (Fig. 9D), and HEKKv2.2 currents (Fig. 9F), we estimated the IC50 to be ∼130, ∼150, and ∼70 nM, respectively.
Fig. 9.
Comparison of ScTx effect on native RUSMC Kv current compared with Kv2.1 and Kv2.2 channels stably expressed in HEK cells. ScTx produced a concentration-dependent inhibition of native Kv currents (A), Kv2.1 (B), and Kv2.2 (C) currents stably expressed in HEK cells. When summary data were normalized and plotted against increasing concentrations of ScTx, there was little difference in the estimated IC50 for ScTx on the native current (B, n = 7), Kv2.1 (D, n = 5), or Kv2.2 (F, n = 6) stably expressed in HEK cells.
Contribution of the ScTx-Sensitive Current to Evoked Action Potentials in Rabbit Urethral Myocytes
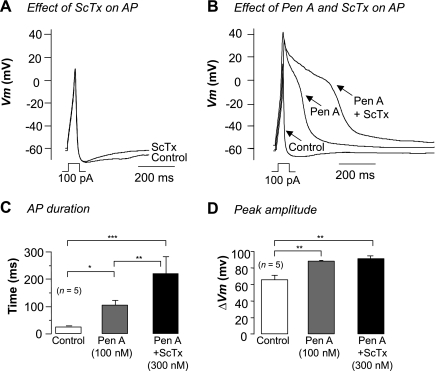
Having established that the majority of the Kv current in RUSMC was ScTx sensitive and likely to be due to Kv2.1 subunits, we next assessed its contribution to electrical activity by examining the effects of ScTx on evoked action potentials (AP). In these experiments the perforated patch configuration of the patch-clamp technique was used and a small hyperpolarizing current was continually injected to bring the membrane potential to approximately −60 mV. Figure 10A shows the results of a typical current-clamp experiment in which an AP was evoked by injecting 100 pA current for 40 ms into a RUSMC. This elicited an AP that consisted of a rapid upstroke, a rapid repolarization, and an afterhyperpolarization. When ScTx (300 nM) was applied and the AP was evoked (Fig. 10A), neither the amplitude nor the duration of the AP or afterhyperpolarization was significantly altered.
Fig. 10.
Kv2 blockade prolongs action potential (AP) duration when BK channels are blocked. A: current injection evoked a brief AP (control line) that was unaffected by ScTx application (300 nM). B: APs evoked in control, Pen A, and ScTx plus Pen A. C: mean AP duration in control (white bar, 23.7 ± 3 ms), 100 nM Pen A (gray bar, 104.8 ± 17 ms), and ScTx plus pen A (black bar, 220.1 ± 61 ms, n = 5). D: average peak change in voltage for evoked AP in control (white bar, 65.3 ± 5 mV), pen A (100 nM, gray bar, 87.8 ± 1 mV), and Pen A plus ScTx (300 nM, black bar, 90.8 ± 3 mV, n = 5). *P < 0.05, **P < 0.01, ***P < 0.001.
One explanation for this lack of effect could be due to differences in the amplitude and activation kinetics of the BK and Kv current. For example, a depolarizing step to 0 mV evokes a transient BK current of ∼800 pA in amplitude in RUSMC, and this current reaches peak amplitude in <20 ms. In contrast, depolarization evokes a Kv current in these cells that is ∼250 pA in amplitude at 0 mV (Fig. 1F) and takes ∼100 ms to fully activate. Thus, at the peak of the AP, the Kv current would only reach ∼25% of its peak amplitude, owing to the slow time course of its activation. We might therefore expect that the contribution of the Kv current is only observed when the BK current is absent. To test this directly, we first blocked the BK current with Pen A and then observed the effects of ScTx application on the AP. Figure 10B shows a typical example of such an experiment where Pen A (100 nM) increased the amplitude and duration of the AP. Subsequent application of ScTx (300 nM) further prolonged the AP. Figure 10C shows summary data from five cells in which the duration of the AP was recorded under control conditions (open bars), in the presence of Pen A (100 nM, gray bar), and in the presence of Pen A and ScTx (300 nM, black bar). Pen A significantly increased the mean duration of the AP from 24 ± 3 ms to 104 ± 17 ms (P < 0.05), and this was further increased to 220 ± 61 ms (P < 0.01) following ScTx application. Although ScTx prolonged the AP, it had very little effect on its peak amplitude (Fig. 10D).
Contribution of the ScTx-Sensitive Current to Contractile Activity in Strips of Rabbit Urethra
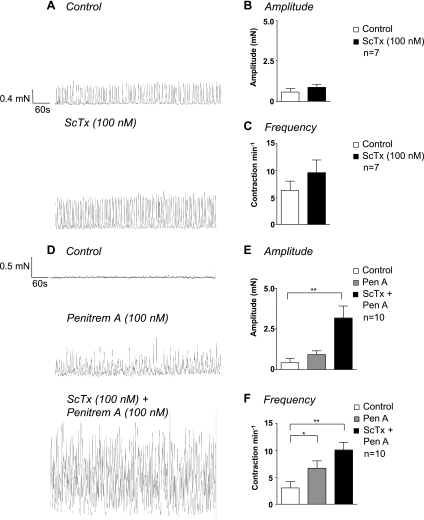
To examine the contribution of Kv2 currents to spontaneous mechanical activity, we recorded isometric tension from strips of urethra smooth muscle and examined the effects of ScTx (100 nM). All experiments were carried out in the presence of atropine (1 μM), guanethidine (1 μM) and NO-ARG (100 μM) to block any contribution from neurotransmitters. In seventeen strips taken from 8 animals, small spontaneous contractions (mean amplitude 0.48 ± 0.18 mN, range 0.1–2.8 mN) occurred at a mean frequency of 4.4 ± 1.1 min−1 (range 0–14.2 min−1). Figure 11A shows an example of spontaneous mechanical activity in the absence (top) and presence of 100 nM ScTx (bottom), where there was a small increase in the amplitude and frequency of contractions following ScTx application for 30 min. Figure 11, B and C, shows summary data for seven similar experiments in which the mean contraction amplitude and frequency, respectively, were measured in the absence (open bars) and presence (closed bars) of ScTx (100 nM) for up to 30 min. Neither contraction amplitude nor frequency was significantly altered in the presence of ScTx (P > 0.05, paired t-test).
Fig. 11.
Kv2 blockade enhances contractions when BK channels are blocked. A: under control conditions, the urethra produced small-amplitude contractions that were little affected by application of ScTx (100 nM). Summary data from seven experiments are shown in which contraction amplitude (B) and contraction frequency (C) were compared before (open bars) and during ScTx (filled bars). D: application of Pen A itself increased contraction frequency and amplitude, and ScTx further enhanced this effect. Summary data from seven experiments in which contraction amplitude (E) and contraction frequency (F) were compared in the absence of any drugs (open bars), after Pen A application (gray bars), and during Pen A and ScTx application (black bars). *P < 0.05, **P < 0.01.
We next compared the effect of ScTx on contractility in the presence of Pen A (100 nM, Fig. 11D). Application of Pen A by itself increased the amplitude of contraction from 0.42 ± 0.3 mN to 0.93 ± 0.2 mN and the contraction frequency from 3 ± 1.2 min−1 to 6.7 ± 1.3 min−1 (n = 10, P < 0.05, ANOVA).
Subsequent application of ScTx in the continued presence of Pen A (Fig. 11D, bottom) significantly increased contraction amplitude and frequency, demonstrating that blockade of Kv2 channels under these conditions dramatically affects urethral contractility. Summary data for 10 experiments, shown in Fig. 11, E and F, demonstrate that application of Pen A and ScTx significantly enhanced contraction amplitude to 3.2 ± 0.7 mN and frequency to 10.1 ± 1.4 min−1 (black bars, P < 0.05, ANOVA).
DISCUSSION
The aim of this study was to characterize the Kv current in rabbit urethral smooth muscle cells, examine its molecular identity, and assess its contribution to the action potential and spontaneous contractile activity. We found that ∼30% of the net outward current at 40 mV was carried via an IbTx and Pen A-insensitive current that activated and inactivated slowly at physiological potentials. Our results suggest that the Kv current shares a number of features with Kv2.1 channels cloned from this tissue and demonstrate that its blockade can significantly prolong the action potential, but only when the transient BK current is blocked.
Although Kv1 channels have been shown to play an important role in a variety of smooth muscles (1, 3, 4, 8, 14, 16, 38), it appears unlikely that they contribute significantly to the Kv current in RUSMC, since they were unaffected by a variety of Kv1-specific toxins. The current was insensitive to margatoxin, κ-dendrotoxin, and α-dendrotoxin, which have been shown previously to block Kv1 family members (15, 16, 29) at much lower concentrations than those used in this study.
The data presented here suggest that Kv2 channels are likely to contribute significantly to the Kv current in urethral smooth muscle. Thus, transcriptional expression for both Kv2.1 and Kv2.2 was detected in whole urethral strips, and immunocytochemical data suggest that both Kv2.1 and Kv2.2 channels are located in the membranes of freshly dispersed RUSMC. Furthermore, the native Kv current in the present study was reduced in a concentration-dependent manner by the Kv2 gating modifier ScTx (2, 10, 41) with an IC50 of ∼130 nM, consistent with the idea that Kv2 subunits underlie the Kv current in these cells. However, it is important to note that ScTx can also block some Kv4 family members (10), but we feel that these effects were unlikely to account for our results given that the Kv current in RUSMC did not share any of the biophysical properties of the “A” type currents encoded by Kv4 family members (12). It is possible that other Kv channel subtypes may also contribute to the delayed rectifier current in RUSMC, but we have not examined this in the present study since ∼70% of the Kv current was abolished at physiological potentials by ScTx.
When we examined the biophysical properties of the Kv current in RUSMC, we found that the currents activated with a V1/2 of −7 mV, which is similar to those obtained in native cells and heterologous expression systems expressing either Kv2.1 channels (4, 20–22, 25, 37, 39, 41) or Kv2.2 channels (19). Interestingly, the inactivation V1/2 for the Kv current in RUSMC was −56 ± 3 mV and although this value is similar to that shown for Kv2.1 in native pyramidal neurons [−62 mV (11)] and bladder SMCs [−61 mV (37)], it is 25 to 35 mV more negative than that recorded from Kv2 channels in various expression systems (20, 22, 25, 27, 30). The observed differences in the V1/2 of inactivation of Kv2 channels recorded in native cells and heterologous expression systems have been well documented and are thought to be due to the presence of additional electrically silent Kv subunits in native cells (23, 26, 41) or differences in the phosphorylation status of the channel (21, 22). The silent Kv subunits comprise the Kv5, Kv6, Kv8, and Kv9 families, which cannot form functional ion channels when expressed alone, but can modify the biophysical properties when coexpressed with the other pore-forming Kv subunits (26, 27, 30, 31, 39, 41, 42). Thus, coexpression of Kv2.1 with the silent subunit Kv9.3 has been shown to slow deactivation, shift the activation V1/2 by approximately −20 mV, and alter the inactivation V1/2 by approximately −15 mV (26, 41). Similarly, coexpression of Kv2.1 with either Kv5.1 or Kv6.1 shifted the inactivation V1/2 by −30 mV to −57 mV and −66 mV, respectively (20, 23, 27, 31). The presence of these silent subunits accounts for the negative inactivation V1/2 of Kv2.1 observed in mouse urinary bladder smooth muscle cells (37), pyramidal neurones (11), and cerebral arterial myocytes (41) and may also be responsible for the negative inactivation V1/2 observed in RUSMC. Indeed, when we compared the transcriptional expression of the silent Kv subunits in RUSMC, we found that Kv9.3 message was approximately fourfold higher than that of the other silent subunits tested and that isolated RUSMC were immunopositive to anti-Kv9.3 antibodies.
It is important to note that although there was no significant difference in the time constant of deactivation between the HEKKv2.1 and HEKKv2.2 cells currents, there was more variation in the deactivation time constants recorded from the HEKKv2.1 cells. Whether this is caused by an upregulation in silent Kv subunit expression in some of these stably transfected cells has not been determined but is worthy of further investigation.
Another possibility for the difference in inactivation V1/2 between the rabbit Kv2.1 and other homologues may be due to the phosphorylation state of the channel. A number of studies have demonstrated that steady-state inactivation of Kv2.1 channels is significantly shifted by up to 35 mV in the negative direction by dephosphorylation (21, 22). Indeed, the very negative inactivation V1/2 obtained in the native cells and the Kv2.1 channels expressed in HEK cells in the present study are consistent with the idea that RUSMC Kv2.1 channels are in a hypophosphorylated state. Whether this is a feature of rabbit Kv2.1 channels or specific to rabbit urethral smooth muscle cells is unknown. The fact that the Kv2.1 protein identified with Western blotting was close to the predicted size supports the idea that urethral Kv2 channels, when expressed in HEK cells at least, are unlikely to be highly phosphorylated.
It is also important to note that we detected transcript for Kv2.2 in urethral smooth muscle and some membrane-bound staining for Kv2.2 in isolated RUSMC. Therefore, we cannot exclude the possibility that these channels, as homomers or heteromers with Kv2.1, may also contribute to the Kv current in RUSMC.
Role of Kv2 Current in the Urethra
To assess the contribution of the Kv2 current to the electrical activity of the RUSMC, we examined the effects of ScTx on resting membrane potential (RMP) and on APs evoked by brief current injections, as shown in Fig. 10. Given that little Kv current is activated at −60 mV (see Fig. 3D), it was not surprising that blockade of Kv2 channels had little effect on RMP and suggests that these channels contribute little to setting the RMP. We were initially surprised to find that ScTx, even at a concentration of 300 nM (which should block the current by >50%), had little effect on the AP. Although Fig. 10A suggests that the duration of the AP afterhyperpolarization was decreased in the presence of ScTx, this effect was not found to be statistically significant. However, when the activation kinetics of the transient BK current and the Kv2.1 current are compared, it is apparent that the Kv2.1 current activates sufficiently slowly that it, in contrast to the transient BK current, is unlikely to contribute to the brief AP. However, when the BK current was inhibited with Pen A, application of ScTx further increased the duration the AP, suggesting that, under these conditions at least, the Kv2 current contributes to the repolarization phase of the AP. The prolongation of the AP after Kv2 blockade would presumably increase Ca2+ influx and enhance spontaneous contractions of the urethra. Indeed, when we examined ScTx on spontaneous contractions, we observed that it alone had little effect on the amplitude spontaneous contractions. However, when the BK channels were first blocked with Pen A, inhibition of Kv2 current increased the amplitude of the contractions approximately threefold.
In summary, the results of this study suggest that the Kv current in RUSMCs is likely to be carried through Kv2.1 channels and that inhibition of this current prolongs the AP and enhances contractile activity of the urethra, but only when the transient BK current is inhibited. We have previously shown that norepinephrine can broaden the evoked AP by inhibiting the transient BK current (40). It is possible that part of this effect may also be mediated through regulation of Kv2 channels in these cells. Future studies are needed to examine whether these currents are regulated by excitatory and inhibitory neurotransmitters in the urethra.
GRANTS
The authors acknowledge National Institutes of Health (National Institute of Diabetes and Digestive and Kidney Diseases Grant R01 DK-68565) for funding this study. B. Kyle was in receipt of a Ph.D. studentship from the Council of Directors, Ireland. This work was also supported by a grant from Takeda Science Foundation (to S. Ohya), Science Foundation Ireland, and the Health Research Board.
DISCLOSURES
No conflicts of interest, financial or otherwise, are declared by the author(s).
REFERENCES
- 1. Albarwani S, Nemetz LT, Madden JA, Tobin AA, England SK, Pratt PF, Rusch NJ. Voltage-gated K+ channels in rat small cerebral arteries: molecular identity of the functional channels. J Physiol 551: 751–763, 2003 [DOI] [PMC free article] [PubMed] [Google Scholar]
- 2. Amberg GC, Santana LF. Kv2 channels oppose myogenic constriction of rat cerebral arteries. Am J Physiol Cell Physiol 291: C348–C356, 2006 [DOI] [PubMed] [Google Scholar]
- 3. Amberg GC, Baker SA, Koh SD, Hatton WJ, Murray KJ, Horowitz B, Sanders KM. Characterisation of the A-type potassium current in mouse gastric antrum. J Physiol 544: 417–428, 2002 [DOI] [PMC free article] [PubMed] [Google Scholar]
- 4. Archer SL, Souil E, Dinh-Xuan AT, Schremmer B, Mercier JC, El Yaagoubi A, Nguyen-Huu L, Reeve HL, Hampl V. Molecular identification of the role of voltage-gated K+ channels, Kv1.5 and Kv2.1, in hypoxic pulmonary vasoconstriction and control of resting membrane potential in rat pulmonary artery myocytes. J Clin Invest 101: 2319–2330, 1998 [DOI] [PMC free article] [PubMed] [Google Scholar]
- 5. Brading AF. Spontaneous activity of lower urinary tract smooth muscles: correlation between ion channels and tissue function. J Physiol 570: 13–22, 2006 [DOI] [PMC free article] [PubMed] [Google Scholar]
- 6. Bradley JE, Anderson UA, Woolsey SM, Thornbury KD, McHale NG, Hollywood MA. Characterization of T-type calcium current and its contribution to electrical activity in rabbit urethra. Am J Physiol Cell Physiol 286: C1078–C1088, 2004 [DOI] [PubMed] [Google Scholar]
- 7. Chen M, Kellett WF, Petkov GV. Voltage-gated K+ channels sensitive to stromatoxin-1 regulate myogenic and neurogenic contractions of rat urinary bladder smooth muscle. Am J Physiol Regul Integr Comp Physiol 299: R177–R184, 2010 [DOI] [PMC free article] [PubMed] [Google Scholar]
- 8. Cole WC, Clement-Chomienne O. Properties, regulation and role of potassium channels in smooth muscle. In: Advances in Organ Biology, edited by Barr L, Christ GJ. Stamford, CT: JAI Press, 2000, vol. 8, p. 247–317 [Google Scholar]
- 9. Cotton KD, Hollywood MA, McHale NG, Thornbury KD. Ca2+ current and Ca2+-activated chloride current in isolated smooth muscle cells of the sheep urethra. J Physiol 505: 121–131, 1997 [DOI] [PMC free article] [PubMed] [Google Scholar]
- 10. Escoubas P, Diochot S, Celerier ML, Nakajima T, Lazdunski M. Novel tarantula toxins for subtypes of voltage-dependent potassium channels in the Kv2 and Kv4 subfamilies. Mol Pharmacol 62: 48–57, 2002 [DOI] [PubMed] [Google Scholar]
- 11. Guan D, Tkatch T, Surmeier DJ, Armstrong WE, Foehring RC. Kv2 subunits underlie slowly inactivating potassium current in rat neocortical pyramidal neurons. J Physiol 581: 941–960, 2007 [DOI] [PMC free article] [PubMed] [Google Scholar]
- 12. Gutman GA, Chandy KG, Grissmer S, Lazdunski M, McKinnon D, Pardo LA, Robertson GA, Rudy B, Sanguinetti MC, Stuhmer W, Wang X. International Union of Pharmacology. LIII. Nomenclature and molecular relationships of voltage-gated potassium channels. Pharmacol Rev 57: 473–508, 2005 [DOI] [PubMed] [Google Scholar]
- 13. Hamill OP, Marty A, Neher E, Sakmann B, Sigworth FJ. Improved patch-clamp techniques for high-resolution current recording from cells and cell-free membrane patches. Pflügers Arch 391: 85–100, 1981 [DOI] [PubMed] [Google Scholar]
- 14. Hart PJ, Overturf KE, Russell SN, Carl A, Hume JR, Sanders KM, Horowitz B. Cloning and expression of a Kv1.2 class delayed rectifier K+ channel from canine colonic smooth muscle. Proc Natl Acad Sci USA 90: 9659–9663, 1993 [DOI] [PMC free article] [PubMed] [Google Scholar]
- 15. Harvey AL. Twenty years of dendrotoxins. Toxicon 39: 15–26, 2001 [DOI] [PubMed] [Google Scholar]
- 16. Hatton WJ, Mason HS, Carl A, Doherty P, Latten MJ, Kenyon JL, Sanders KM, Horowitz B. Functional and molecular expression of a voltage-dependent K(+) channel (Kv1.1) in interstitial cells of Cajal. J Physiol 533: 315–327, 2001 [DOI] [PMC free article] [PubMed] [Google Scholar]
- 17. Hollywood MA, McCloskey KD, McHale NG, Thornbury KD. Characterization of outward K+ currents in isolated smooth muscle cells from sheep urethra. Am J Physiol Cell Physiol 279: C420–C428, 2000 [DOI] [PubMed] [Google Scholar]
- 18. Hollywood MA, Woolsey S, Walsh IK, Keane PF, McHale NG, Thornbury KD. T- and L-type Ca2+ currents in freshly dispersed smooth muscle cells from the human proximal urethra. J Physiol 550: 753–764, 2003 [DOI] [PMC free article] [PubMed] [Google Scholar]
- 19. Johnston J, Griffin SJ, Baker C, Skrzypiec A, Chernova T, Forsythe ID. Initial segment Kv2.2 channels mediate a slow delayed rectifier and maintain high frequency action potential firing in medial nucleus of the trapezoid body neurons. J Physiol 586: 3493–3509, 2008 [DOI] [PMC free article] [PubMed] [Google Scholar]
- 20. Kramer JW, Post MA, Brown AM, Kirsch GE. Modulation of potassium channel gating by coexpression of Kv2.1 with regulatory Kv5.1 or Kv6.1 α-subunits. Am J Physiol Cell Physiol 274: C1501–C1510, 1998 [DOI] [PubMed] [Google Scholar]
- 21. Misonou H, Mohapatra DP, Park EW, Leung V, Zhen D, Misonou K, Anderson AE, Trimmer JS. Regulation of ion channel localization and phosphorylation by neuronal activity. Nat Neurosci 7: 711–718, 2004 [DOI] [PubMed] [Google Scholar]
- 22. Mohapatra DP, Trimmer JS. The Kv2.1 C terminus can autonomously transfer Kv2.1-like phosphorylation-dependent localization, voltage-dependent gating, and muscarinic modulation to diverse Kv channels. J Neurosci 26: 685–695, 2006 [DOI] [PMC free article] [PubMed] [Google Scholar]
- 23. Moreno-Domínguez A, Cidad P, Miguel-Velado E, López-López JR, Pérez-García MT. De novo expression of Kv6.3 contributes to changes in vascular smooth muscle cell excitability in a hypertensive mice strain. J Physiol 587: 625–640, 2009 [DOI] [PMC free article] [PubMed] [Google Scholar]
- 24. Ohya S, Tanaka M, Watanable M, Imaizumi Y. Diverse expression of delayed rectifier K+ channel subtype transcripts in several types of smooth muscles of the rat. J Smooth Muscle Res 36: 101–115, 2000 [DOI] [PubMed] [Google Scholar]
- 25. Ottschytsch N, Raes A, Van Hoorick D, Snyders DJ. Obligatory heterotetramerization of three previously uncharacterized Kv channel alpha-subunits identified in the human genome. Proc Natl Acad Sci USA 99: 7986–7991, 2002 [DOI] [PMC free article] [PubMed] [Google Scholar]
- 26. Patel AJ, Lazdunski M, Honore E. Kv2.1/Kv9.3, a novel ATP-dependent delayed-rectifier K+ channel in oxygen-sensitive pulmonary artery myocytes. EMBO J 16: 6615–6625, 1997 [DOI] [PMC free article] [PubMed] [Google Scholar]
- 27. Post MA, Kirsch GE, Brown AM. Kv2.1 and electrically silent Kv6.1 potassium channel subunits combine and express a novel current. FEBS Lett 399: 177–182, 1996 [DOI] [PubMed] [Google Scholar]
- 28. Rae J, Cooper K, Gates P, Watsky M. Low access resistance perforated patch recordings using amphotericin B. J Neurosci Methods 37: 15–26, 1991 [DOI] [PubMed] [Google Scholar]
- 29. Robertson B, Owen D, Stow J, Butler C, Newland C. Novel effects of dendrotoxin homologues on subtypes of mammalian Kv1 potassium channels expressed in Xenopus oocytes. FEBS Lett 383: 26–30, 1996 [DOI] [PubMed] [Google Scholar]
- 30. Salinas M, Duprat F, Heurteaux C, Hugnot JP, Lazdunski M. New modulatory a subunits for mammalian Shab K+ channels. J Biol Chem 272: 24371–24379, 1997 [DOI] [PubMed] [Google Scholar]
- 31. Sano Y, Mochizuki S, Miyake A, Kitada C, Inamura K, Yokoi H, Nozawa K, Matsushime H, Furuichi K. Molecular cloning and characterization of Kv6.3, a novel modulatory subunit for voltage-gated K+ channel Kv2.1. FEBS Lett 512: 230–234, 2002 [DOI] [PubMed] [Google Scholar]
- 32. Schmalz F, Kinsella J, Koh SD, Vogalis F, Schneider A, Flynn ER, Kenyon JL, Horowitz B. Molecular identification of a component of delayed rectifier current in gastrointestinal smooth muscles. Am J Physiol Gastrointest Liver Physiol 274: G901–G911, 1998 [DOI] [PubMed] [Google Scholar]
- 33. Sergeant GP, Hollywood MA, McCloskey KD, Thornbury KD, McHale NG. Specialised pacemaking cells in the rabbit urethra. J Physiol 526: 359–366, 2000 [DOI] [PMC free article] [PubMed] [Google Scholar]
- 34. Teramoto N, Brading AF. Activation by levcromakalim and metabolic inhibition of glibenclamide-sensitive K channels in smooth muscle cells of pig proximal urethra. Br J Pharmacol 118: 635–642, 1996 [DOI] [PMC free article] [PubMed] [Google Scholar]
- 35. Teramoto N, Brading AF. The effects of nifedipine and other calcium antagonists on the glibenclamide-sensitive K+ currents in smooth muscle cells from pig urethra. Br J Pharmacol 123: 1601–1608, 1998 [DOI] [PMC free article] [PubMed] [Google Scholar]
- 36. Teramoto N, Creed KE, Brading AF. Activity of glibenclamide-sensitive K+ channels under unstimulated conditions in smooth muscle cells of pig proximal urethra. Naunyn Schmiedebergs Arch Pharmacol 356: 418–424, 1997 [DOI] [PubMed] [Google Scholar]
- 37. Thorneloe KS, Nelson MT. Properties and molecular basis of the mouse urinary bladder voltage-gated K+ current. J Physiol 549: 65–74, 2003 [DOI] [PMC free article] [PubMed] [Google Scholar]
- 38. Tobin AA, Joseph BK, Albarwani S, Al-Kindi HN, Madden JA, Nemetz LT, Rusch NJ, Rhee SW. Loss of cerebrovascular Shaker-type K+ channels: a shared vasodilator defect of genetic and renal hypertensive rats. Am J Physiol Heart Circ Physiol 297: H293–H303, 2009 [DOI] [PMC free article] [PubMed] [Google Scholar]
- 39. Vega-Saenz de Miera EC. Modification of Kv2.1. K+ currents by the silent Kv10 subunits. Brain Res Mol Brain Res 123: 91–103, 2004 [DOI] [PubMed] [Google Scholar]
- 40. Woolsey S, Thornbury KD, McHale NG, Hollywood MA. Effects of noradrenaline on transient BK current in freshly dispersed smooth muscle cells from the rabbit urethra. J Physiol 543P S154, 2002 [Google Scholar]
- 41. Zhong XZ, Abd-Elrahman KS, Liao CH, El-Yazbi AF, Walsh EJ, Walsh MP, Cole WC. Stromatoxin-sensitive, heteromultimeric Kv2.1/Kv9.3 channels contribute to myogenic control of cerebral arterial diameter. J Physiol 588: 4519–4537, 2010 [DOI] [PMC free article] [PubMed] [Google Scholar]
- 42. Zhu XR, Netzer R, Bohlke K, Liu Q, Pongs O. Structural and functional characterization of Kv6.2 a new g-subunit of voltage-gated potassium channel. Receptors Channels 6: 337–350, 1999 [PubMed] [Google Scholar]


