Abstract
Central pattern generators (CPGs) pace and pattern many rhythmic activities. We have uncovered a new module in the heartbeat CPG of leeches that creates a regional difference in this segmentally distributed motor pattern. The core CPG consists of seven identified pairs and one unidentified pair of heart interneurons of which 5 pairs are premotor and inhibit 16 pairs of heart motor neurons. The heartbeat CPG produces a side-to-side asymmetric pattern of activity of the premotor heart interneurons corresponding to an asymmetric fictive motor pattern and an asymmetric constriction pattern of the hearts with regular switches between the two sides. The premotor pattern progresses from rear to front on one side and nearly synchronously on the other; the motor pattern shows corresponding intersegmental coordination, but only from segment 15 forward. In the rearmost segments the fictive motor pattern and the constriction pattern progress from front to rear on both sides and converge in phase. Modeling studies suggested that the known inhibitory inputs to the rearmost heart motor neurons were insufficient to account for this activity. We therefore reexamined the constriction pattern of intact leeches. We also identified electrophysiologically two additional pairs of heart interneurons in the rear. These new heart interneurons make inhibitory connections with the rear heart motor neurons, are coordinated with the core heartbeat CPG, and are dye-coupled to their contralateral homologs. Their strong inhibitory connections with the rearmost heart motor neurons and the small side-to-side phase difference of their bursting contribute to the different motor and beating pattern observed in the animal's rear.
Keywords: central pattern generator, fictive motor pattern, heartbeat, constriction pattern, leech
ensembles of neurons called central pattern generators (CPGs) control rhythmic episodic motor patterns like locomotion and continuous motor activities like breathing even in the absence of sensory feedback or other timing cues (Marder et al. 2005; Marder and Calabrese 1996). CPGs typically consist of interneurons, which produce rhythmic activity to time and pattern motor output. In this report we address the question of how motor patterns are patterned. The crustacean stomatogastric system, for example, which controls food processing with both episodic and ongoing activity, produces an array of different patterns. Here, the CPG is reconfigured temporarily through neuromodulation (see review, Marder et al. 2005). Different patterns also may be achieved by temporarily recruiting additional higher order interneurons as has been shown for food processing in the sea slug, Aplysia, where the radula performs two opposing motor patterns, ingestion and egestion. Stimulating one interneuron is sufficient to generate egestion; it takes two additional interneurons to produce ingestion. Thus, depending on which interneurons are activated, either one of the motor patterns is realized by using the same underlying circuitry (Morgan et al. 2002; Rosen et al. 1991). Sensory feedback is especially important in patterning locomotion. Stick insects rely on sensory feedback to coordinate the individual CPGs controlling the leg joints and the CPGs of the thorax to produce the different patterns needed to navigate varying terrains (see reviews, Büschges 2005; Büschges et al. 2008). To enrich a motor pattern permanently, networks may gain new neurons and modules during evolution. In mammals, separate CPGs for each of the four limbs yield individual limb patterns, but these are coordinated by the trunk-based spinal network for locomotion and for other tasks: a cat may push an object around with one leg, but it uses all four legs to jump and walk (Grillner and Jessell 2009). The scratch motor rhythm in turtles produces goal-directed hindlimb movements, and different motor patterns are evoked depending on the site of a tactile stimulus (see recent review, Stein 2008).
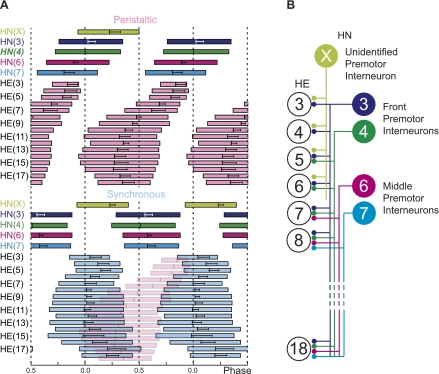
Leech heartbeat, the focus of this study, is an ongoing, segmentally distributed motor pattern driven by a modular CPG dedicated to this single behavior (see recent reviews, Calabrese 2010; Kristan et al. 2005). The limited number of neurons and easy access for recording their electrical activity typical of invertebrate CPGs makes a quantitative analysis of these systems possible, which is instrumental for understanding general principles of pattern generation (Marder and Calabrese 1996). Two tubular hearts, one on each body side, propel blood through the closed circulatory system (Boroffka and Hamp 1969). While one heart generates high systolic pressure through a front-directed peristaltic wave of constriction in heart segments, the other generates low systolic pressure through a rear-directed wave of constrictions in heart segments. After 20–40 beats, the hearts switch roles (Krahl and Zerbst-Boroffka 1983; Wenning et al. 2004a; Wenning and Meyer 2007). The hearts of midbody segments 3 to 18 are entrained in each segment by the ipsilateral member of a single bilateral pair of heart excitatory (HE) motor neurons (16 segmental pairs in all) (Maranto and Calabrese 1984; Thompson and Stent 1976a). The resulting fictive motor pattern progresses from rear to front on one side (peristaltic coordination) and shows near synchrony on the other side (synchronous coordination mode) (Fig. 1A) (Norris et al. 2007a; Thompson and Stent 1976a; Wenning et al. 2004b). The HE motor neurons in turn are driven by the heartbeat CPG. The core consists of seven identified pairs and one unidentified pair of heart (HN) interneurons located in the first seven midbody segmental ganglia. Five pairs of heart interneurons are premotor and make inhibitory synapses of different strengths to the heart motor neurons in a staggered fashion (Norris et al. 2007a, 2011) (Fig. 1B). The timing pattern delivered from the premotor heart interneurons to the heart motor neurons is also bilaterally asymmetric in that the premotor heart interneurons fire in a rear-to-front progression in the peristaltic mode and nearly synchronously in the synchronous mode (Norris et al. 2006; Weaver et al. 2010) (Fig. 1A). Thus all component neurons are bilaterally symmetric, but the heart constriction pattern, the fictive motor pattern, and the timing pattern of the premotor heart interneurons are side-to-side asymmetric (right peristaltic/left synchronous and left peristaltic/right synchronous) with regular and precipitous switches.
Fig. 1.
Bilateral phase diagram of the timing pattern (A) and hemilateral circuit diagram of the premotor heart (HN) interneurons of the leech heartbeat central pattern generator (CPG) and the postsynaptic heart (HE) motor neurons (B). HE motor neurons and HN interneurons are indexed by the body side and the midbody ganglion number they reside in (see also methods). Standard colors are used for the HN interneurons (see Terminology and color code in methods). A: bilateral phase diagram of the premotor HN interneurons and the entire HE motor neuron ensemble for the peristaltic (top) and synchronous (bottom) coordination mode. Each box represents the average duty cycle of a neuron's activity with the vertical line in the center representing the middle spike (±SD), the left edge the first spike, and the right edge the last spike, respectively (error bars omitted for clarity). Phase reference is the middle spike of the peristaltic HN(4) interneuron and is assigned 0 phase. To illustrate the side-to-side phase relations of the HE motor neurons, the diagram of the peristaltic mode was copied into the diagram of the synchronous mode (translucent pink boxes, no error bars). Note that HE motor neurons come together in phase in both the front and rear segments. B: HE motor neurons of segments 3 to 18 receive staggered input from ipsilateral premotor HN interneurons: from the HN(3) and HN(4) (front premotor HN interneurons), from the HN(6) and HN(7) (middle premotor HN interneurons), and from the unidentified HN(X) interneuron. Large colored circles are cell bodies (indexed by midbody segment number), lines indicate cell processes, and small circles indicate inhibitory chemical synapses. [Adapted from Norris et al. 2007b.]
A computational model of the heart motor neuron ensemble and their inputs was created to determine the congruence of the experimentally determined input pattern (timing pattern and synaptic strengths) and the fictive motor pattern observed in the living system (García et al. 2008). The model captured the general features of the fictive motor pattern, but the known inhibitory inputs to the rearmost heart motor neurons were insufficient to shape their activity into bursts with appropriate phasing. This discrepancy prompted our search for additional input to the rear heart motor neurons. Moreover, previous work on the constriction pattern had revealed an apparent change of course in the rear heart segments in that heart constrictions progress from front to rear in both coordination modes and converge in phase (Wenning et al. 2004a). In this report we describe two additional pairs of premotor heart interneuron of the heartbeat CPG that appear to pattern this regional difference.
We reexamined the constriction pattern of the hearts in intact juvenile leeches using higher resolution imaging technology and our own custom-made software. We electrophysiologically searched, and we discovered a new module of the CPG: two new pairs of heart interneurons located in midbody ganglia 15 and 16. We show that they have typical heart interneuron morphology, that contralateral homologs are dye-coupled (unusual among heart interneurons), that they are premotor, that their activity is coordinated with the other identified heart interneurons, that they switch phase relations with the other known premotor interneurons during switches in coordination mode, and that they receive excitatory input from the middle premotor interneurons.
METHODS
Animals and solutions.
Adult leeches (Hirudo sp.) (Siddall et al. 2007) were obtained from commercial suppliers (Leeches USA, Westbury, NY; Biopharm, Charleston, NC). Unfed juvenile leeches (10–40 mg) came from a breeding colony at the University of California at San Diego (courtesy of W. B. Kristan and K. A. French). Leeches were kept in artificial pond water at 16°C. For all preparations, leeches were cold-anesthetized and pinned through both anterior and posterior suckers in a stretched position. Depending on the type of experiment, all ganglia from the head brain to midbody segmental ganglion 20 were taken out. In this report, ganglion and segment number refer to the midbody segments. The preparations were pinned (ventral surface up) in 60-mm petri dishes lined with Sylgard (Dow Corning, http://www.dowcorning.com). Those ganglia in which heart interneurons or heart motor neurons were to be recorded were desheathed with the use of fine scissors or microscalpels. Dissections were completed within 60 min. All preparations were superfused continuously at 1–2 ml/min with normal leech saline containing (in mM) 115 NaCl, 4 KCl, 1.8 CaCl2, 10 glucose, and 10 HEPES buffer, adjusted to pH 7.4 with NaOH. Bath volume was 6–8 ml. Experiments were carried out at room temperature.
Video imaging and analysis of filling and emptying of the hearts.
A juvenile leech was placed in a drop of chilled pond water on a Sylgard disk and covered with a small chunk of ice. After a minute or so, the leech became limp and was pinned, ventral side up, through the anterior and the posterior sucker in a stretched position. The remaining ice was rinsed off with pond water, and the disk was transferred to a glass platform. For better viewing of the hearts, the leech was flattened with a coverslip placed over the entire leech and secured with magnets. A strip of Sylgard between the disk and the coverslip prevented the animal from being crushed. The glass platform with the disk holding the leech was transferred to a vibration isolation table. We used fiber optics to illuminate the leech from the sides and below. A video clip of 5 min in length was taken for each animal, capturing all segments simultaneously, using a Canon Vixia HF200 high-definition camera [PF30 progressive, 30 frames per second (fps), MXP 24 Mbps; http://www.usa.canon.com]. The whole procedure took about 30 min.
For image processing, movies were converted from the AVI Canon specific format (AVCHD extension *.mst) into a standard AVI format readable by Matlab (The MathWorks, http://www.mathworks.com) (extension *.avi) using the Emicson MST Converter (http://www.emicsoft.com). The frame rate was kept at 30 fps, and the final resolution was HD 1920 × 1080 pixels. The rhythmic filling and emptying of the heart with red blood caused oscillatory changes in the intensity of the transmitted light, and these optical signals were used in our analysis of heartbeat. For the present study, we developed our own software (in Matlab) to determine these light intensity changes in user-defined regions of interest (ROIs) drawn around the 32 heart segments in each video clip. The average intensity value of each such ROI in each frame was recorded for further analysis. The intensity value was calculated by using the formula I = (1/n)∑x = 1n Ix, where n is the total number of pixels in the ROI and Ix is the intensity of pixel x. The intensity of a pixel was computed in two different ways, as the gray value and as the green value in the RGB color space, and we chose the filter that gave the best signal-to-noise ratio (usually the green filter). The intensity values for each ROI from each video frame were plotted versus the frame number in the sequence. The absolute values of the digitized signals depend on the size of the analysis windows and on the signal-to-noise ratio of the optical signal obtained in a given heart segment and therefore are not comparable between different preparations or even between different heart segments of the same preparation (see Wenning et al. 2004a).
A previously developed Matlab code was used to analyze the digitized optical signals and find the times corresponding to the start of each systole and to full diastole in every heart segment (described in detail in Wenning et al. 2004a). Full diastole corresponds to the trough of the optical signal. The start of systole corresponds to the point halfway between the fastest change in time (i.e., peak of the first derivative of the optical signal) and full diastole. Start of systole of the heart is the phase marker for each heart beat. The analysis program calculated the cycle period and the intersegmental phase difference between a given heart segment and our chosen reference, the heart segment 14 on the peristaltic side (14p). The cycle period of segment i was defined as the interval (Ti) between occurrences of the phase markers (i.e., start of systole) in two consecutive heartbeat cycles of the optical signal obtained from segment i. The phase (ϕ14p-i) of a given heart segment i was determined on a cycle-by-cycle basis [ϕ14p-i = −(ϕi-14p)] and was defined as the difference between the time of occurrence of the phase marker of segment i (ti) and the time of occurrence of the phase marker of the reference segment (t14p) in the same cycle divided by the reference cycle period (T14p), expressed as ϕ14p-i = (ti − t14p)/T14p. We used movies from 13 juvenile leeches in which 7–25 individual heartbeats of at least two consecutive switch cycles were analyzed: right peristaltic/left synchronous and left peristaltic/right synchronous.
Electrical recordings and data acquisition.
All electrodes were pulled on a Flaming/Brown micropipette puller (P-97; Sutter Instruments http://www.sutter.com) from borosilicate glass (1-mm OD, 0.75-mm ID; A–M Systems, http://www.a-msystems.com). For extracellular recordings, suction electrodes were filled with normal saline and placed in a suction electrode holder (E series; Warner Instruments; http://www.warneronline.com). To ensure a tight fit between the cell and the electrode, electrode tips were drawn to approximately the diameter of heart interneuron (20 μm) and motor neuron somata (30 μm). The electrode tip was brought in contact with the cell body, and light suction was applied with the use of a syringe until the entire cell body was inside the electrode. Extracellular signals were monitored with a differential AC amplifier (model 1700; A–M Systems) at a gain of 1,000 with the low- and high-frequency cutoffs set at 100 and 1,000 Hz, respectively. Noise was reduced with a 60-Hz notch filter. A second amplifier (model 410; Brownlee Precision, http://www.brownleeprecision.com) amplified the signal appropriately for digitization. For intracellular voltage and voltage-clamp recordings from heart interneurons and motor neurons, we used sharp microelectrodes (20–30 MΩ when filled with 2 M K-acetate, 20 mM KCl). Recordings were performed using an Axoclamp-2A amplifier (Molecular Devices, http://www.moleculardevices.com) operating in discontinuous current-clamp or discontinuous single-electrode voltage-clamp mode with a sample rate of 2.5–2.8 kHz. The electrode potential was monitored to ensure that it settled during each sample cycle. Output bandwidth was 0.3 kHz. Voltage-clamp gain was 0.8–2.0 nA/mV. The voltage-clamp holding potential for recording spontaneous inhibitory postsynaptic currents (IPSCs) in motor neurons was adjusted to minimize escape spiking while maximizing IPSC amplitude and was between −35 and −50 mV. At the end of each experiment the electrode was withdrawn from the motor neuron, and only data for which the electrode potential was within ±5 mV of ground were included. Thus holding potentials were accurate within ±5 mV. Data were digitized (sampling rate >5 kHz) using a digitizing board (Digi-Data 1200 Series Interface; Molecular Devices) and acquired using pCLAMP software (Molecular Devices) on a personal computer.
Double labeling of the rear heart interneurons in ganglia 15 and 16.
Chains of ganglia of segments 2 to at least 16 were isolated and pinned ventral side up. A single cell, either a HN(15) or a HN(16) interneuron, was injected with dye per preparation. According to the protocol of Fan et al. (2005), sharp microelectrodes were used to deliver a mixture of 5% tetramethylrhodamine dextran (3,000 MW; Invitrogen, http://www.invitrogen.com) and 2.5% Neurobiotin (Vector Laboratories, http://www.vectorlabs.com) in 0.2 M K-acetate and 20 mM KCl by using a long depolarizing pulse (600 ms) followed by a short hyperpolarizing pulse (50 ms) at 1 Hz for up to 30 min.
Leech saline was replaced by culture medium (L-15, 90% strength; Sigma-Aldrich, http://www.sigmaaldrich.com/united-states.html), and preparations were left undisturbed for 1–2 h at 16°C. Ganglia posterior to 13 were fixed in 4% paraformaldehyde in 0.1 M phosphate buffer (PB; 1–2 h at room temperature or overnight at 6°C) and rinsed in PB (6 × 10 min). Pins were removed during the final rinses, and the ganglia chains were preincubated in a mixture of PB and 0.3% Triton X-100 (PBX; Sigma-Aldrich) for 1–2 h. Preparations were then incubated in PBX with streptavidin Alexa Fluor 488 (Invitrogen; 2 μg/ml) for either 6–8 h at room temperature or for 10–22 h at 16°C. Preparations were rinsed in PB (6 × 10 min) and mounted in either Vectashield (Vector Laboratories) or a mixture of 80% glycerol and 20 mM NaHCO3. All solutions were adjusted to pH 7.4.
To visualize injected neurons and those dye-coupled to them, mounted ganglia were visualized with a ×10 (NA 0.75) objective attached to a Bio-Rad MRC 1024 laser scanning confocal system coupled with a Zeiss Axioskop (Carl Zeiss MicroImaging, Thornwood, NY). Specimens were illuminated with a krypton-argon laser. Scanning proceeded from the dorsal surface through the ganglion in 5.4-μm steps using two filter sets, one for rhodamine dextran (excitation: 568 nm, emission: 605 nm) and one for Alexa 488 (excitation: 522 nm, emission: 488 nm). Acquired frames (z stack) were reconstructed as two-dimensional pictures, separate for each dye, by collapsing the z stack using ImageJ software (http://rsbweb.nih.gov/ij/).
Determining the strength and conduction delays of synaptic connections from the rear heart interneurons to segmental heart motor neurons.
A series of heart motor neurons [HE(15) to HE(18) motor neurons], ipsilateral to a rear HN interneuron recorded extracellularly, were recorded intracellularly and then voltage clamped, one after the other. Spontaneous IPSCs were recorded for several interneuron burst cycles in each motor neuron. Spike and IPSC detection/averaging were performed off-line using custom-made Matlab software (for a detailed description see Norris et al. 2006). The average strength of a synaptic connection was defined as the amplitude (measured from the preceding baseline current) of the largest peak of the spike-triggered average IPSC from all presynaptic heart interneuron spikes in a burst except the first there spikes and the last spike. The latency was defined as the time between the triggering spike and this same peak. To determine the spike-triggered average, we used 17.5 ± 5.9 (range 10–29) heart interneuron bursts per heart motor neuron. In four experiments, we recorded a front heart interneuron [HN(4) interneuron, n = 3; HN(3) interneuron, n = 1] and either one of the rear premotor interneurons to identify the coordination mode. Data from the two coordination modes were analyzed separately in these preparations. Ultimately, because no significant differences were noted between coordination modes in synaptic connectivity and strength, averages were taken in both coordination modes to increase the number of presynaptic spikes used and thus increase signal to noise in spike-triggered averages. In all, we examined 54 synaptic connections in 22 preparations. Inhibitory synaptic currents were converted to conductances using a reversal potential of −62 mV (Angstadt and Calabrese 1991).
Determining the phase relations between rear, middle, and front heart interneurons.
We used chains of ganglia (head brain to segment 20 or the tail brain) to record extracellularly from the HN(4) and either HN(6) or HN(7) interneurons to assess the coordination mode, and additionally from the rear HN(15) and/or HN(16) interneurons (ipsi- and/or contralateral). Spike detection was carried out using custom-made Matlab software (for a detailed description see Norris et al. 2007a). For analysis of burst characteristics, period, duty cycle, and intraburst spike frequency, spikes were grouped into bursts using an interburst interval of ≥1 s. To eliminate the effects of occasional stray spikes, groups of fewer than five spikes were not considered as bursts. We then calculated burst period (T), phase (ϕ), duty cycle (D), and intraburst spike frequencies (see below) for each recorded cell. In all, we used 22 preparations and analyzed an average of 18.7 bursts (range 12–26) per coordination mode in each preparation.
To represent the burst period of the entire central pattern generator, the burst period of the HN(4) interneuron was determined. We defined burst period as the interval in seconds from middle spike to middle spike of consecutive bursts. The mean burst period (Ti) was then determined for each cell i (ganglion index for an interneuron). The unilateral (or relative) middle spike phase (generally referred to below as just phase) of a given heart interneuron was defined on a cycle-by-cycle basis as the time (t) difference between the middle spike of its burst (ti) and the middle spike of the preceding ipsilateral HN(4) interneuron's burst (t4; ipsilateral phase reference cell). The time difference was then normalized to the burst period of the ipsilateral phase reference cell and expressed as a decimal number (between 0 and 1): Δ(ti − t4)/T4. To unify phase calculations in the two different modes or in bilateral recordings, the unilateral (relative) phase calculated in the synchronous coordination mode was offset by 0.511 (Norris et al. 2006). All phases were expressed modulo 1. This adjustment allowed a complete bilateral assessment of heart neuron phase with respect to the HN(4) interneurons (absolute phase). Phases calculated for individual experiments were then averaged across preparations to obtain a mean phase.
To calculate the duty cycle and for the purpose of phase box plots, we also calculated the mean absolute phase of the first and the last spikes of the bursts, as described for the middle spike. The mean duty cycle (D) was then determined by calculating the difference between the mean first and the mean last spike phase, adding 1, and taking the value modulo 1. If this number was negative, 1 was added. Duty cycle was thus calculated without SD and represents the fraction of the burst period occupied by the burst. The mean duty cycle for each interneuron neuron was then displayed as a box plot in the bilateral phase diagrams subsequently described. A vertical line that bisects each phase box near its midpoint indicates the middle spike phase for each heart interneuron. The beginning and end of each box indicate the average time of the first and last spikes, respectively, in a series of bursts relative to the middle spike time of the absolute phase reference cell. Error bars indicate the SD around the mean first, middle, and last spike in a burst. Each interspike interval in a burst was converted to a frequency (reciprocal), and the averages of these frequencies were then averaged across bursts and reported as mean spike frequency (F).
Actograms illustrate the phase relationship between neuron bursts over time and were based on raster presentations similar to those used to display circadian activity patterns (Peterson and Calabrese 1982; Pittendrigh 1974). Each symbol represents the time of the middle spike of a burst in a heart interneuron or motor neuron. The reference period of the actogram was chosen to be the mean period of an arbitrary stretch of record. This record was then broken into a series of segments of this length that were arranged sequentially, one below the other. Periods equal to the reference period result in symbols that fall into a vertical line, whereas shorter periods cause a drift to the left and longer periods drift to the right. For visual clarity, a duplicate copy of each segment is displayed to the right and shifted up one row.
Connections between the rear heart interneurons and to other heart interneurons.
Simultaneous extracellular recordings were made from one of the front heart interneurons [HN(4) or HN(3)], from one of the middle heart interneurons [HN(6) or HN(7)], or from the switch interneuron [HN(5)], and from one or both of the rear premotor heart interneurons [HN(15) or (16)]. One of the rear HN interneurons was then voltage clamped to record spontaneous postsynaptic potentials (PSCs) for several burst cycles. Subsequently, if possible, the other rear heart interneuron in the adjacent ganglion was voltage clamped. Thus, in a given experiment, multiple synaptic connections were tested. We recorded from 72 heart interneurons using 52 preparations and examined 136 synaptic connections (Table 1). To determine the spike-triggered average, we used between 6 and 43 heart interneuron bursts (mean ± SD: 14.7 ± 9). Spike and IPSC detection/averaging were performed as outlined above for synaptic connections between the rear HN interneurons and HE motor neurons.
Table 1.
Burst characteristics of the rear premotor HN(15) and HN(16) interneurons
| HN(15) | HN(16) | |
|---|---|---|
| No. of neurons | 23 | 15 |
| Mean spike phase | ||
| Synchronous | 0.63 ± 0.09 | 0.62 ± 0.08 |
| Peristaltic | 0.76 ± 0.06† | 0.77 ± 0.11† |
| Duty cycle | ||
| Synchronous | 0.42 ± 0.08 | 0.46 ± 0.12 |
| Peristaltic | 0.46 ± 0.12 | 0.48 ± 0.12 |
| Mean spike frequency, Hz | ||
| Synchronous | 4.9 ± 1.8 | 4.4 ± 1.6 |
| Peristaltic | 5.1 ± 1.7* | 4.1 ± 1.2 |
| Average no. of spikes per burst | ||
| Synchronous | 14.2 ± 5.1 | 12.5 ± 5.6 |
| Peristaltic | 15.0 ± 5.9 | 12.7 ± 5.3 |
P ≤ 0.05, HN(15) vs. HN(16) interneuron (unpaired t-test).
P ≤ 0.005, synchronous vs. peristaltic mode in the same neuron (paired t-test).
Statistics.
Data are means ± SD. We used the two-tailed Student's test (paired or unpaired) to assess statistical differences with P < 0.05 as the criterion for significance. The imaging data were subjected to a one-way ANOVA test to assess differences between the heart segments on one side and to a two-way ANOVA test to assess side-to-side phase differences. Post hoc testing was done with Tukey's honestly significant difference test. We used the MATLAB multcompare function for a multiple comparisons pairwise test.
Terminology and color code.
HE motor neurons and HN interneurons are indexed by body side and the midbody ganglion number they reside in. For example, the HE(L,5) motor neuron resides in midbody segment 5 on the left body side; the HN(R,3) interneuron resides in midbody segment 3 on the right side. Specific colors and symbols of the same color are used in traces, graphs, and diagrams to represent heart interneurons from specific ganglia: dark blue, HN(3) interneuron; green, HN(4) interneuron; orange, HN(5) interneuron; magenta, HN(6) interneuron; cyan, HN(7) interneuron; lime green, HN(X) interneuron; burgundy, HN(15) interneuron; and teal, HN(16) interneuron.
RESULTS
Fictive motor pattern and constriction pattern in posterior segments.
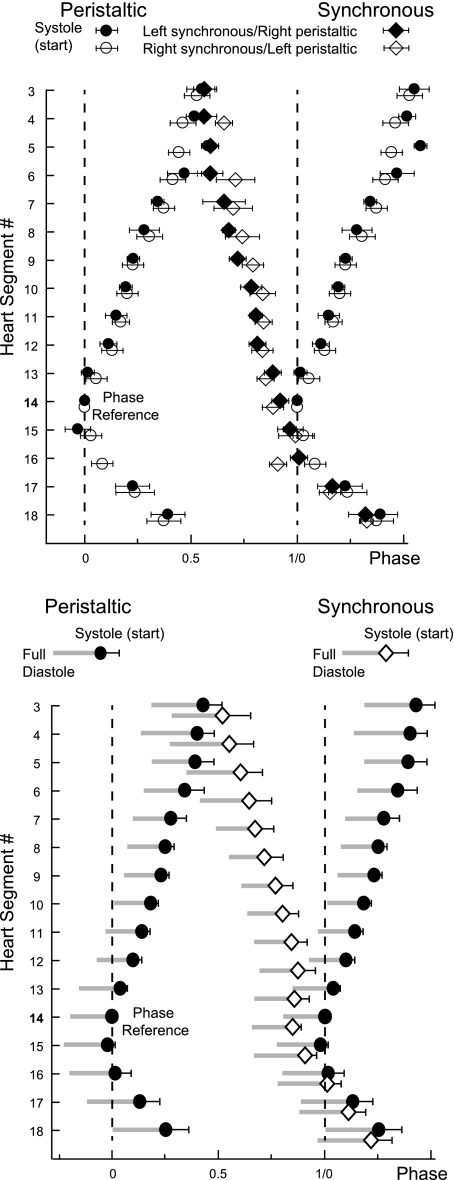
The leech heart motor neurons produce a fictive motor pattern that consists of two modes, a rear-to-front peristaltic mode and a near-synchronous mode (Fig. 1A). However, the heart motor neurons' activity in rear segments 15 to 18 progress from front to rear in the peristaltic mode and in the synchronous coordination mode (Norris et al. 2007b; Wenning et al. 2004c) (Fig. 1A). Video recordings of contractions in leech hearts showed that systolic phase also seemed to progress from front to rear in rear heart segments 17 and 18 in both modes (Wenning et al. 2004a). Variability was high in these videos, in part because of the methods employed. We had to concatenate the data of five to seven movies to analyze all heart segments and therefore needed several intermediate phase references to create the phase diagram of the systolic pattern, which added variability. Second, the phase diagram was constructed with averages across many switch cycles (we refer to a switch cycle as the number of heart beats per coordination mode), which added more variability. For this study we imaged and analyzed all heart segments on both sides at once in individual (juvenile) leeches over two consecutive switch cycles (left peristaltic/right synchronous and right peristaltic/left synchronous) (Fig. 2, top). To create the phase diagram of the constriction patterns shown in Fig. 2, we used the start of systole (or systole in short) in each heartbeat of each heart segment. We had established previously that the start of systole falls within the first one-third of the duty cycle of the corresponding heart motor neuron (Wenning et al. 2004a). Within the limitations of our optical recordings, the systolic pattern corresponds to the pattern of constrictions of the individual heart segments. In addition, for the constriction diagram of Fig. 2, bottom, we show the point where the heart segments are in full diastole (see Video imaging and analysis of filling and emptying of the hearts in methods; Wenning et al. 2004a).
Fig. 2.
Phase diagrams of the constriction patterns of heart segments 3 to 18 from an individual, intact leech (top) and of the average from 13 different preparations (bottom). Vertical dashed lines are provided to facilitate observation of relative phasing. Both phase diagrams show the start of systole (±SD; systole in short) in the peristaltic (circles) and in the synchronous mode (diamonds). Phase reference is heart segment 14 on the peristaltic side, and its systole is assigned 0 phase. To illustrate the intersegmental phase differences in the rear, the peristaltic side is duplicated and shifted by 1. Top: mean phase (±SD) of systole of 9–19 heart beats was determined in an individual juvenile leech. Filled symbols represent 1 switch cycle (left synchronous/right peristaltic); open symbols represent another switch cycle (right synchronous/left peristaltic). Phases could not always be determined in all 32 segments in both switch cycles; for example, segment 16 in the peristaltic mode was obtained once in this animal. Note that patterns are similar on both body sides. Cycle period: 4.1 s. The number of beats per switch cycle was 20 and 21, respectively. Bottom: average of the start of systole and additionally that of full diastole (left edge of gray bars) is shown. Note that heart segments in the front and in the rear converge in phase and that rear heart segments 16 to 18 on both sides fill (diastole) and empty (systole) from front to rear. Graph shows the average (±SD) of the average of the 2 switch cycles analyzed per preparation. Mean cycle period: 3.9 ± 0.45 s.
On average (n = 13; Fig. 2, bottom), full diastole and systole progressed from rear to front between heart segments 15 and 3 on the peristaltic side. On the synchronous side, they progressed from front to rear in heart segments 3 to 11 while heart segments 11 to 14 filled and emptied at the same time. Posterior to segment 15, phase progression of full diastole and systole was from front to rear on both sides with very small side-to-side phase differences (Fig. 2). This change of course in the rear of the animal encouraged us to search for additional inhibitory input to the rear HE motor neurons. Previous analysis of the computer model of the leech heart motor neuron ensemble had also suggested the existence of additional rear inputs (García et al. 2008).
Search for and identification of additional heart interneurons.
We employed two strategies for identifying additional heart interneurons. In a previous study, we determined whether the HE(8), HE(10), and HE(12) motor neurons received inhibitory inputs other than from the already identified premotor interneurons of segments 3, 4, 6, and 7 (Norris et al. 2011). With this technique, we were able to account for 98% of the IPSCs in those motor neurons. On the basis of these results, it seems unlikely that midbody ganglia 8 to 11 have premotor HN interneurons, because the identified HN premotor interneurons make connections to all HE motor neurons posterior to their home segment [with the notable exception of the HN(3), which also synapses onto the HE motor neuron in its home ganglion (Fig. 1B)].
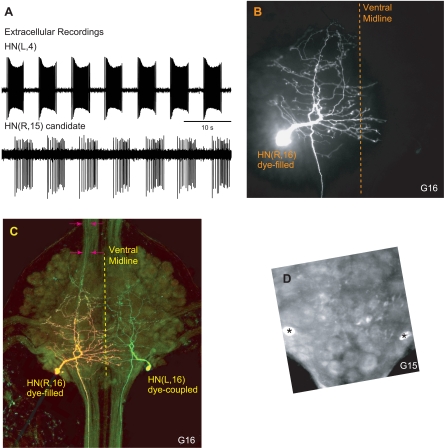
In the current study, we systematically searched for heart interneurons in ganglia 8 and posterior using 19 preparations. We assumed that the activity of any additional heart interneurons would be phase-locked to the timing oscillator. We also assumed that additional heart interneurons would be located in a similar position to the other identified heart interneurons, namely, in the posterior lateral packet on the ventral side of a segmental ganglion. In isolated chains of ganglia from segment 1 to 19, we recorded extracellularly from the HN(4) heart interneuron (as a monitor for the heartbeat-timing network) and searched, with a second extracellular electrode, for likely candidates. We found two pairs of neurons, one in segment 15 and one in segment 16, that showed bursting activity phase locked to the HN(4) interneuron. Figure 3A shows a recording from the HN(L,4) interneuron and from a heart interneuron candidate [labeled HN(R,15) candidate] with the bursting activity of these two neurons phase-locked. These neurons were tentatively identified as heart interneurons HN(15) and HN(16). We did not find neurons with activity coordinated with the HN(4) interneuron in segments 8 (n = 7), 12 (n = 2), 13 (n = 12), 14 (n = 12), 17 (n = 12), 18 (n = 5), and 19 (n = 4). We cannot exclude the possibility of segmental homologs in these other midbody ganglia, but these neurons were not active in time with the heartbeat CPG.
Fig. 3.
Identification and neuroanatomy of additional HN interneurons. A: extracellular recordings from the HN(L,4) interneuron and from a neuron in segment 15 on the contralateral side [HN(R,15) candidate]. Note that burst activity in these 2 neurons is time-locked. B and C: ventral aspect of a dye-injected HN(R,16) interneuron. Anterior is up. B: the confocal image shows rhodamine dextran in the injected cell. The HN(R,16) interneuron has a main neurite that loops and gives rise to many secondary neurites. The main neurite tapers in diameter to form a rearward-going axon leaving the ganglion. The anterior-going neurites do not leave the ganglion. Note that some processes cross the ventral midline. C: superimposed confocal image shows both rhodamine dextran (red fluorescence) and the Alexa fluorophore coupled to Neurobiotin (green fluorescence). The color combination makes the injected cell appear yellow because it contains both rhodamine dextran and Neurobiotin. Its contralateral homolog, the HN(L,16) interneuron, appears green due to dye coupling. Note the 2 neurites in the anterior right connective (arrows). D: same preparation, ganglion 15. Two cell bodies in the position of the HN(15) interneurons (posterior lateral packet) are labeled with Neurobiotin (asterisks).
Neuroanatomy.
Initially, we used Lucifer yellow or rhodamine dextran in the recording electrode to quickly assess the morphology of the putative HN(15) and HN(16) heart interneurons. These early dye fills showed that the newly identified neurons in segments 15 and 16 are indeed interneurons with the typical morphology of heart interneurons: the primary neurite has a characteristic loop that gives off many secondary neurites, necks down in diameter to form a rearward-going axon, and has no anterior-going axon (Shafer and Calabrese 1981) (Fig. 3B).
Injecting a HN(15) or HN(16) interneuron with Lucifer yellow revealed dye coupling to its contralateral homolog, a feature not seen in the previously identified heart interneurons. To examine dye coupling further, a single HN(15) or HN(16) interneuron per preparation was labeled with a mixture of rhodamine dextran (which does not pass through gap junctions) and Neurobiotin (which is known to pass through some gap junctions) (Fan et al. 2005). We double-labeled one of the HN(15) interneurons in two preparations and one of the HN(16) interneurons in four preparations, all of which showed dye coupling to their contralateral homologs. In the example shown in Fig. 3, B and C, a HN(R,16) interneuron had been injected. The use of confocal laser microscopy with a rhodamine-specific filter (see Double labeling of the rear heart interneurons in ganglia 15 and 16 in methods for details) revealed the morphology of the injected HN(16) interneuron: a brightly labeled axon projecting posteriorly but no axon or other projections entering the anterior connective. Several secondary neurites crossed the ventral midline (Fig. 3B). Visualizing the Alexa Fluor 488 (the fluorophore coupled to Neurobiotin) and superimposing the two confocal image stacks (Fig. 3C; detailed in methods) confirmed dye coupling between the injected cell and its contralateral homolog. The injected cell is yellow because it contains both rhodamine dextran (red fluorescence) and Neurobiotin (green fluorescence), whereas the contralateral homolog appears green due to dye coupling between these posterior interneurons. Note the two faintly stained axons (arrows) in the anterior connective on the injected (right) side in the Alexa Fluor 488 (Neurobiotin) image (Fig. 3C). Conspicuously, in the ganglion of segment 15 (same preparation), two cells in the position of heart interneurons (although we could not identify them as such because we did not use confocal microscopy on the adjacent ganglion) were also weakly labeled with Neurobiotin (Fig. 3D, asterisks).
These results show that the HN(15) and HN(16) interneurons have heart interneuron morphology. This observation, coupled with their phase-locked activity to the heartbeat CPG, led us to conclude that they are indeed heart interneurons. In contrast to all other identified heart interneurons, however, they are dye-coupled to their contralateral homologs and maybe to the other pair of heart interneurons in the adjacent ganglion.
The HN(15) and HN(16) interneurons are premotor: strength of inhibitory synapses to heart motor neurons.
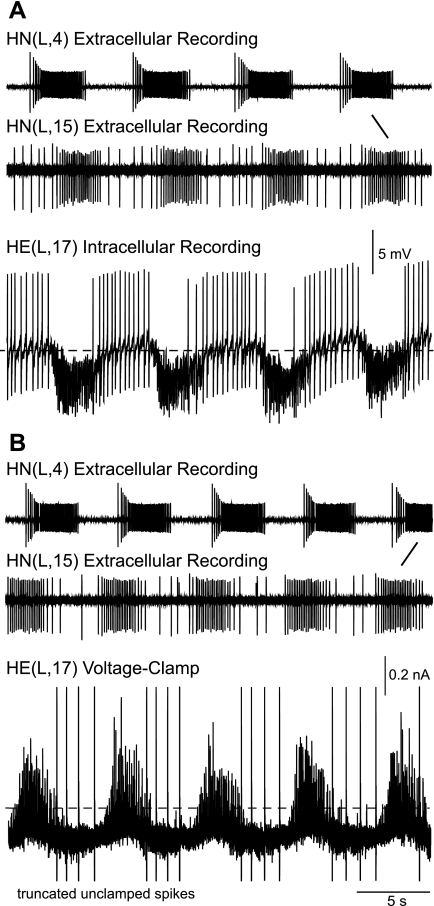
To determine whether the newly identified HN(15) and HN(16) interneurons were premotor, we recorded extracellularly from one HN(15) or HN(16) interneuron and intracellularly from heart motor neurons using chains of ganglia (segments 2 to 18). Because neither the HN(15) nor the HN(16) interneurons had an axon in the anterior connective, we focused on connections to the ipsilateral HE motor neurons of segments 15 to 18. We also recorded from the previously identified anterior HN interneuron [HN(4)] to monitor the heartbeat CPG. In the example of Fig. 4, we recorded extracellularly from the HN(L,4) and the HN(L,15) interneurons and intracellularly from the HE(L,17) motor neuron, first in current clamp (A) and then in voltage clamp (B). The inhibitory postsynaptic potentials and currents (IPSCs) recorded in the motor neuron coincided with the bursts of the HN(L,15) interneuron, suggesting a potential connection.
Fig. 4.
Bursting activity of the rear HN(L,15) interneuron is time-locked with the front premotor HN(L,4) interneuron and coincides with postsynaptic events in the rear HE(L,17) motor neuron as illustrated in simultaneous extracellular recordings from the HN interneurons during intracellular recording from the HE motor neuron. Inhibitory postsynaptic potentials (IPSPs) in the HE(L,17) motor neuron (A) and inhibitory postsynaptic currents (IPSCs) in the subsequent single-electrode voltage-clamp recording (B) coincide with bursts of action potentials in the HN(15) interneuron. Note that burst activity in the HN(15) interneuron is time-locked and, as seen by comparing A and B, switches phase relations with the HN(4) interneuron (slanted lines). Dotted lines in the HE motor neuron recording refer to −40-mV membrane potential (A) and 0-nA holding current (B). Holding potential: −45 mV (B).
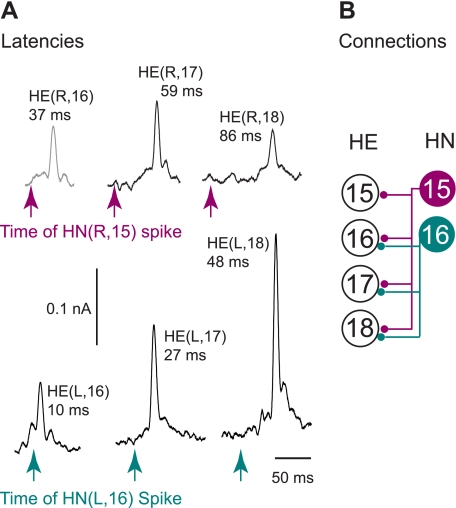
In the same set of experiments, we used spike-triggered averaging to determine whether the inhibitory postsynaptic events seen in the motor neurons had indeed fixed latencies with spikes recorded in the rear HN interneurons. Figure 5A shows the data from a single experiment where we recorded extracellularly from the HN(15) interneuron and intracellularly from the HE(16) to HE(18) motor neurons on the right side and extracellularly from the HN(16) interneuron and intracellularly from the HE(16) to HE(18) motor neurons on the left side. The IPSCs recorded in the HE(R,16), HE(R,17), and HE(R,18) motor neurons were time-locked with spikes from the HN(R,15) interneuron, whereas the IPSCs recorded in the HE(L,16), HE(L,17), and HE(L,18) motor neurons were time-locked with spikes from the HN(L,16) interneuron. Peak latencies between the triggering spike recorded in the soma of a rear HN interneuron and the averaged IPSC recorded in the series of HE motor neurons increased with increasing distance between the two recording sites. We examined 54 synaptic connections in 22 preparations and found that the HN(15) interneuron makes inhibitory synaptic connections with ipsilateral heart motor neurons of segments 15 to 18, and the HN(16) interneuron with ipsilateral motor neurons of segments 16 to 18, respectively (Fig. 5B). We conclude from these experiments that the HN(15) and HN(16) interneurons are indeed premotor and refer to them as rear premotor HN interneurons. Both make synaptic connections with the heart motor neurons in their home segment, a feature they share with the front premotor HN(3) interneuron (Norris et al. 2007a).
Fig. 5.
Synaptic connections between the rear HN interneurons and the HE motor neurons. A: spikes from several bursts from a rear HN(R,15) interneuron (burgundy) were used to generate spike-triggered averages to determine the size of the IPSCs elicited in ipsilateral heart motor neurons of midbody segments 16, 17, and 18 (top). Spikes from the rear HN(L,16) interneuron (teal) were used to generate spike-triggered averages to determine the size of the IPSCs elicited in ipsilateral heart motor neurons of midbody segments 16, 17, and 18 (bottom). Recordings are from the same experiment. Arrows mark the time of the triggering spike. Latencies (in ms) of the peak average IPSC from the triggering event are noted for each heart motor neuron. The holding potentials were −45 and −40 mV in the HE(R,16) motor neuron (gray trace). B: the hemilateral circuit diagram shows the connections identified between the rear HN interneurons and the rear HE motor neurons. Symbols are as defined in Fig. 1.
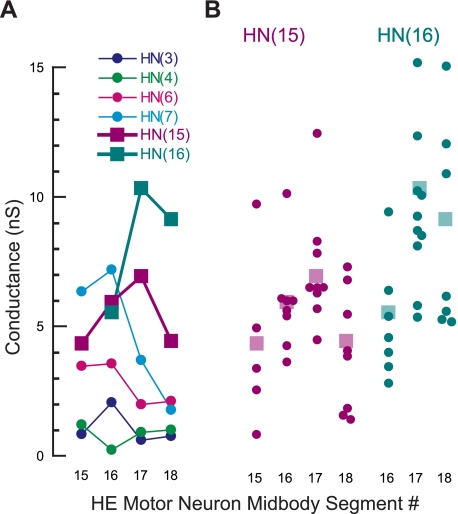
Finally, in this same data set, we compared synaptic strength among the different HE motor neurons. The holding potential in the heart motor neurons was usually −45 mV but was sometimes adjusted, as for example in the HE(R,16) motor neuron (Fig. 5A; gray trace), where it was −40 mV. To compare synaptic strength across different HE motor neurons despite different holding potentials, we converted current into conductance using −62 mV as a reversal potential for the IPSCs (Angstadt and Calabrese 1991). On average, the HN(15) interneuron formed its weakest synaptic connection with the HE(15) motor neuron, increased synaptic strength to the HE(16) motor neuron, most strongly inhibited the HE(17) motor neuron, and then decreased its synaptic strength to HE(18). The HN(16) interneuron had its weakest synapse with the HE(16) motor neuron, increased synaptic strength dramatically to the HE(17) motor neuron, and decreased slightly to the HE(18) motor neuron. Figure 6A includes the synaptic weights from the front and middle premotor HN interneurons onto the rear HE motor neurons for comparison (Norris et al. 2007a). The average synaptic strength of the front premotor HN(3) and HN(4) interneurons was close to zero in these rear segments. In the HE(15) and HE(16) motor neurons, average synaptic strength from middle premotor HN(7) interneuron was greater than the input from the rear HN interneurons [HN(15) and HN(16)], whereas the middle premotor HN(6) interneuron formed weaker synaptic connections than the rear premotor interneurons. In the HE(17) and HE(18) motor neurons, the average synaptic strengths for the middle premotor interneurons fell off sharply, and the largest inputs for both motor neurons were from the two rear premotor HN interneurons. The variability of synaptic strength across preparations was high for any given HE motor neuron (Fig. 6B) and similar to that observed in the front and middle premotor HN interneurons (Norris et al. 2007a, 2011). Thus the heart motor neurons in segment 15 receive inhibitory input of different strengths from five, and those of segments 16 to 18 from six, heart premotor interneurons. After having established the activity pattern and the phase relations of the rear HN interneurons with the rest of the heartbeat CPG (as described below), we went back to compare synaptic strength from a given rear HN interneuron to a given HE motor neuron. In four preparations, we also recorded the HN(4) interneuron and could thus establish coordination mode. We did not find a difference in synaptic strength between the two modes (6 HE motor neurons, paired t-test; P ≤ 0.48).
Fig. 6.
Synaptic weight (expressed as conductance; see text for details) of all the premotor HN interneurons connected to the rear HE motor neurons in midbody segments 15 to 18. Data for the front and middle heart premotor interneurons are from Norris et al. (2007a). Standard colors are used for the HN interneurons (see methods). A: on average, synaptic weight from the front premotor HN(3) and HN(4) interneurons was weak in all 4 HE motor neurons. When the synaptic strength profiles of the HE(15) and HE(16) are compared with those of the HE(17) and HE(18) motor neurons, synaptic strengths from the middle premotor HN(6) and HN(7) interneurons fall off sharply, whereas the strengths of the rear premotor HN(15) and HN(16) interneurons increase in the HE(17) and (18) motor neurons. SD are omitted for clarity. B: synaptic weight varies in individual heart motor neurons. Each dot represents the spike-triggered average of 1 connection tested. The transparent squares are the means shown in A.
Activity pattern and phase relationship of the rear heart interneurons to the identified front and middle heart interneurons.
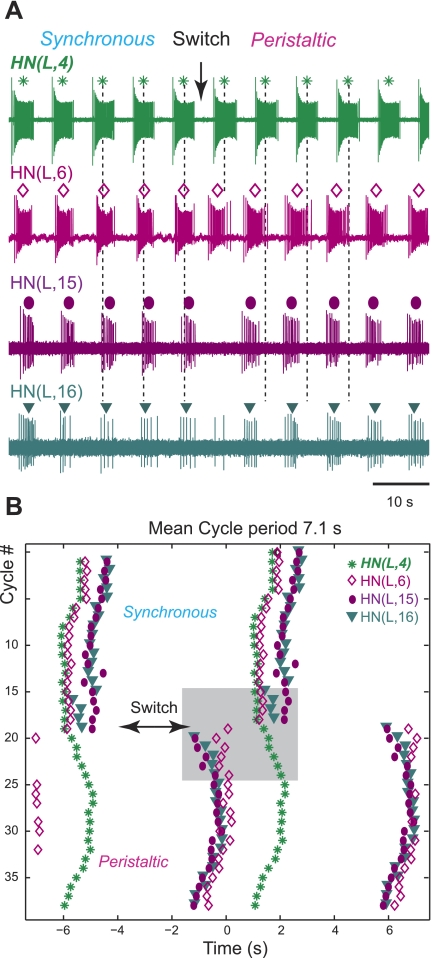
In chains of ganglia (head brain to at least segment 16), we recorded simultaneously from the front premotor HN(4) interneuron as a monitor for the heartbeat-timing network, from a middle premotor HN(6) or HN(7) interneuron as a monitor for the coordination mode (Norris et al. 2006), and from one or both rear HN interneurons. In the example shown in Fig. 7A, the rear HN(L,15) and HN(L,16) interneurons, the HN(L,4) interneuron, and the HN(L,6) interneuron were recorded simultaneously across switches in coordination mode. The recording started with the preparation in synchronous mode with the middle premotor HN(L,6) interneuron firing nearly synchronously with the front HN(L,4) interneuron (the phase reference), followed by the rear premotor HN interneurons. After the switch to the peristaltic coordination mode, the rear premotor HN interneurons fired first, followed closely by the middle HN(L,6) interneuron and then, after a large delay, by the HN(L,4) interneuron. The actogram (Fig. 7B) shows the phase relationships of the middle spike for all recorded HN interneurons over 39 cycles and illustrates their different phase relations in the two coordination modes.
Fig. 7.
Rear premotor interneurons are coordinated with the heartbeat CPG and switch phase relations with the other HN interneurons. A: extracellular recordings from the front premotor HN(L,4) interneuron, middle premotor HN(L,6) interneuron, and both rear premotor HN interneurons, also on the left side. Dashed lines mark the position of the middle spike in the HN(4) (top trace), the reference, and are provided to facilitate observation of relative phasing. Color-coded different symbols above each burst denote the middle spikes of the other interneurons. Standard colors are used for the HN interneurons (see methods). The recording starts in the synchronous mode with the HN(4) interneuron leading, followed by the HN(6) interneuron and then by the HN(15) and HN(16) interneurons. After the switch into the peristaltic mode (arrow), the rear HN(15) and HN(16) interneurons are leading, followed by the HN(6) interneuron and, after a delay, by the HN(4) interneuron. B: the actogram demonstrates the timing relationship for the middle spike of 38 consecutive bursts across the switch between the 2 coordination modes (same symbols as in A). Note that the rear HN interneurons fire nearly in phase in both coordination modes. The shaded box represents the bursts shown in A. Time 0 corresponds to the cycle period (7.1 s).
We quantified the activity pattern (duty cycle, mean spike frequency, and number of spikes per burst) in the rear heart interneurons and determined their phase relations with the front and middle premotor heart interneurons in 22 preparations [including 1 recording without a middle premotor interneuron and 2 recordings where we recorded from the switch HN(5) interneuron] (Table 1). We recorded from the HN(15) interneuron in 15 preparations (in 7 of these, the contralateral homolog was also recorded) and from the HN(16) interneuron in 13 preparations (in 2 of these, the contralateral homologue was also recorded). Data were collected in both coordination modes [except for 1 recording from the HN(16) interneuron where we obtained data only in the peristaltic mode]. The average cycle period in the 22 preparations we used was 7.2 ± 1.5 s.
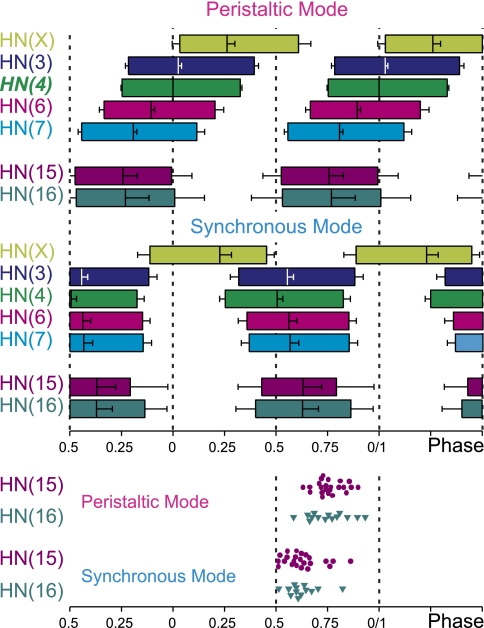
Table 1 and the bilateral phase diagram shown in Fig. 8 summarize these data. The HN(4) interneuron on the peristaltic side is the absolute phase marker (0% phase), and the phases of all other ipsilateral interneurons recorded were calculated with it as reference. The HN(4) interneuron on the synchronous side was assigned an absolute phase of 0.51% (Norris et al. 2006a; see Determining the phase relations between rear, middle, and front heart interneurons in methods). Ipsilateral HN(15) and HN(16) interneurons fired closely together in both coordination modes (i.e., their mean spike phases did not differ from one another). In the synchronous mode, the HN(15) and HN(16) interneurons lagged the middle premotor interneurons and led them slightly in the peristaltic mode (Fig. 8). The duty cycles of the HN(15) and HN(16) interneurons tended to be shorter than those of the other premotor interneurons but were quite variable. The average mean spike frequency of the HN(15) interneuron was higher than that of the HN(16) interneuron in the peristaltic coordination mode (P ≤ 0.05) (Table 1). On average, the rear heart interneurons fired at about one-half the rate and had one-third the number of spikes of the middle premotor interneurons (Figs. 3, 4, and 7A) (Norris et al. 2006).
Fig. 8.
Bilateral phase diagram of all premotor HN interneurons is shown for the peristaltic (top) and synchronous (bottom) coordination mode. Each box represents the average duty cycle of a neuron's activity with the vertical line indicating the middle spike (see Fig. 1 for details). Absolute phase reference (phase 0) is the HN(4) interneuron on the peristaltic side. The HN(15) and HN(16) interneurons fire in phase in both coordination modes. They contribute to the rear-to-front progression in the peristaltic mode and to the front-to-rear progression in the synchronous mode. Standard colors are used for the HN interneurons (see methods). Data for the front and middle heart premotor interneurons and for the HN(X) interneuron are from Norris et al. (2007b). To illustrate the variability in phasing, the middle spike phases of individual rear premotor HN interneurons are shown at bottom. Middle spike phases were determined in both coordination modes for each rear HN interneuron.
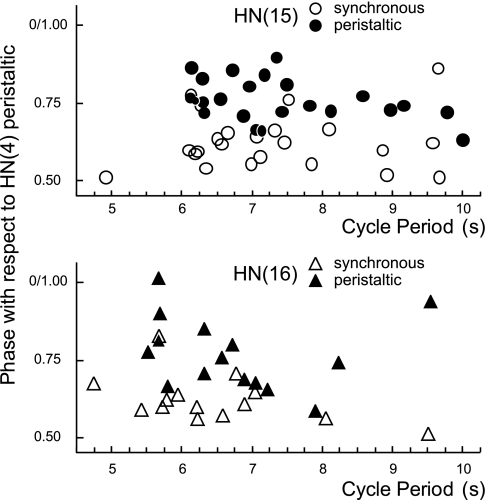
An important property of many CPGs, especially those associated with locomotion, is phase constancy, where phase relations, spike frequency, and duty cycle of activity do not change with burst period. Phase constancy had been shown for the other heart interneurons (Norris et al. 2006). The 22 preparations used in the present study varied across a range of cycle periods from about 5 to 10 s. Phase relations of the newly identified rear heart interneurons were phase-constant over this range (Fig. 9), as were their duty cycles and mean spike frequencies (data not shown).
Fig. 9.
Middle spike phases of the HN(15) (top) and HN(16) (bottom) interneurons are constant over a broad range of periods in the peristaltic and synchronous coordination mode. Phases are relative to the HN(4) interneuron on the peristaltic side (assigned 0 phase). Data are from the same preparations as in Fig. 8.
Connections between the rear heart interneurons and the rest of the heartbeat CPG.
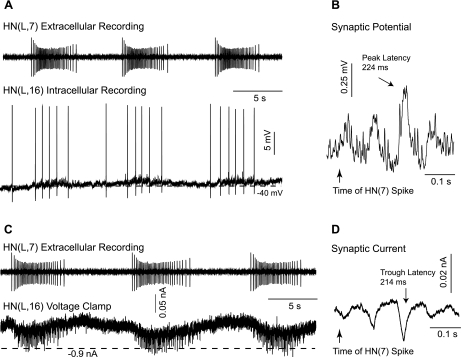
The phase coordination of the rear HN interneurons with the other HN interneurons described above begs the question how this coordination is accomplished. The rear heart interneurons do not have a forward-going axon (Fig. 3), but the front and middle heart interneurons project all the way to ganglion 18 and make connections to the HE motor neurons (Norris et al. 2007a; Thompson and Stent 1976a, 1976b). We therefore examined whether the front and middle heart interneurons provide input to the rear heart interneurons. We recorded extracellularly from front and middle heart interneurons in different combinations and, at the same time, intracellularly from a rear HN interneuron. Figure 10 shows a recording of the middle HN(L,7) interneuron and the rear HN(L,16) interneuron, with the latter first in current clamp (A) and then in voltage clamp (C). The analysis of the spike-triggered average showed that the HN(7) interneuron makes an excitatory connection to the HN(16) (Fig. 10, B and D). The latency of about 220 ms reflects the distance between the recording site of the spikes of the HN(7) interneurons eliciting the postsynaptic responses in the HN(16) interneuron (9 segments).
Fig. 10.
Connections between the rear and the middle premotor HN interneurons. A: extracellular recording from the HN(L,7) interneuron during simultaneous intracellular recording from the rear HN(L,16) interneuron. The barrages of excitatory postsynaptic potentials (EPSPs) seen during bursting in the rear HN interneuron coincide with spikes in the HN(7) interneuron as seen in the spike-triggered averages (B). C: same preparation as in A with the HN(16) now in voltage clamp. Holding potential: −50 mV. The barrages of excitatory postsynaptic currents (EPSCs) in the rear HN interneuron coincide with spikes in the HN(7) interneuron as seen in the spike-triggered averages (D). The long latencies (B and D) reflect the conduction delays over the distance of 9 segments.
We recorded from 72 rear heart interneurons and tested 136 connections in 52 preparations, ipsilateral and contralateral (Table 2). All connections we found were excitatory with one exception [a connection between the HN(4) interneuron and the ipsilateral HN(15) interneuron]. Other than the one exception, no connections were found between the HN(4) interneurons or the switch HN(5) interneurons and the rear premotor interneurons. The connection between the HN(3) interneuron and the HN(15) interneuron was not tested. The connection between the HN(3) interneuron and the HN(16) interneuron was tested twice, and no connection was found. In 6 of 13 cases, we found connections between the HN(6) interneuron and the HN(15) interneuron (4 ipsilateral, 2 contralateral), and in 2 of 13 cases, we found connections between the HN(6) interneuron and the HN(16) interneuron (all ipsilateral). In 20 of 28 cases, we found connections between the HN(7) interneuron and the HN(15) interneuron (16 ipsilateral, 4 contralateral), and in 19 of 27 cases, we found connections between the HN(7) interneuron and the HN(16) interneuron (18 ipsilateral, 1 contralateral). Excitatory postsynaptic potentials ranged from 0.2 to 2.2 mV and the excitatory postsynaptic currents (EPSCs) from 10 to 80 pA, respectively. These results show that both middle heart interneurons make excitatory connections with both rear heart interneurons, with the HN(7) connections being the strongest.
Table 2.
Synaptic connections among the front, middle, and switch heart interneurons and the rear and premotor heart interneurons
| To |
||||
|---|---|---|---|---|
| Ipsilateral |
Contralateral |
|||
| From | HN(15) | HN(16) | HN(15) | HN(16) |
| HN(3) | 0 | 2/0 | 0 | 1/0 |
| HN(4) | 20/1 | 14/0 | 5/0 | 3/0 |
| HN(5) | 5/0 | 4/0 | 0 | 1/0 |
| HN(6) | 11/4 | 9/2 | 2/2 | 4/0 |
| HN(7) | 22/16 | 20/18 | 6/4 | 7/1 |
Data are the number of pairs tested and the number of synaptic connections found from the front [HN(3) and HN(4)], middle [HN(6) and HN(7)], and switch [HN(5)] heart interneurons to the rear [HN(15) and HN(16)] premotor heart interneurons.
Connections among the rear premotor heart interneurons.
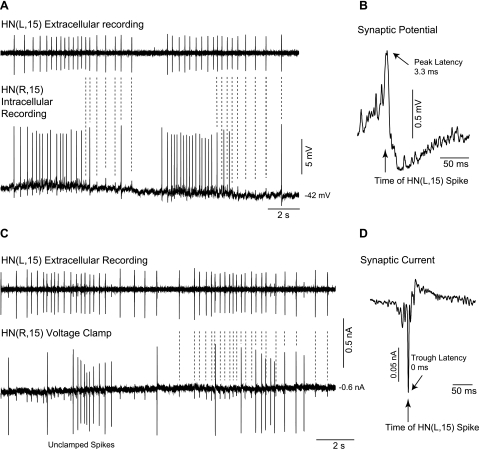
Dye coupling between the rear heart interneurons residing in the same ganglion (Fig. 3) suggests electrical coupling. To test this hypothesis, we recorded extracellularly from one rear HN interneuron and intracellularly from its respective contralateral homolog [HN(15) interneuron, n = 2; HN(16) interneuron, n = 1]. As illustrated in Fig. 11 for a pair of HN(15) interneurons, the spike-triggered average showed an excitatory connection with a short constant latency between the triggering spike in the extracellularly recorded HN(L,15) interneuron and the postsynaptic event in its ipsilateral homolog, the HN(R,15) interneuron (<5 ms to the peak and near 0 ms to its start; Fig. 11A). Similarly, in a different experiment, when the postsynaptic cell [the HN(R,15) interneuron] was voltage clamped (Fig. 11B), the average latency of the spike-triggered EPSCs was close to 0 ms. In the one experiment where we recorded from the rear HN(L,16) interneuron and voltage clamped its contralateral homolog, the HN(R,16) interneuron, the latency of the spike-triggered EPSC was <5 ms to the peak and near 0 ms to the start (not shown). We conclude from these experiments that both rear premotor heart interneurons are probably electrically coupled to their respective contralateral homologs. We were unable to test these connections further because intracellular recordings from the rear HN interneurons were short-lived. We did not explore the firing properties of the rear premotor HN interneurons further in this study.
Fig. 11.
Rear HN interneurons elicit excitatory responses (dashed lines) in their contralateral homologs with a short latency indicative of electrical coupling. A: extracellular recording from the HN(L,15) interneuron during simultaneous intracellular recording from the contralateral HN(R,15) interneuron. Spikes in the HN(L,15) interneuron elicit EPSPs or spikes in the HN(R,15) with short latencies as seen in the spike-triggered averages (B). C: extracellular recording from the HN(L,15) interneuron the contralateral HN(R,15) interneuron is in voltage clamp (different preparation than in A). Holding potential: −45 mV. Spikes in the HN(L,15) interneuron elicit EPSCs or spikes in the HN(R,15), again with short latencies (D). Dashed lines indicate some of the HN(L,15)-mediated postsynaptic responses in the HN(R,15) interneuron.
DISCUSSION
The individual heart segments of the leech circulatory system are instructed by the motor neuron ensemble to move blood forward along the body axis and rearward while serving the segmental circulation, but not at the same time (Wenning et al. 2004b). Although completely bilateral symmetric by design, the pattern of intersegmental coordination is side-to-side asymmetric: left peristaltic/right synchronous and right peristaltic/left synchronous, with regular and precipitous switches between these two modes (Calabrese 2010).
The two new pairs of premotor heart interneurons in midbody ganglia 15 and 16 described in this report provide additional inhibitory input to the heart motor neurons in their home segments and those rearward (Figs. 5 and 6). It is in this region that the fictive motor pattern and the constriction pattern change direction and intersegmental phase progression becomes front-to-rear in both coordination modes (Figs. 1 and 2). This additional heartbeat CPG module, comprising the HN(15) and HN(16) interneurons, might represent the missing input to the rear motor neurons needed to shape their activity into bursts (García et al. 2008) with this regional shift in phasing.
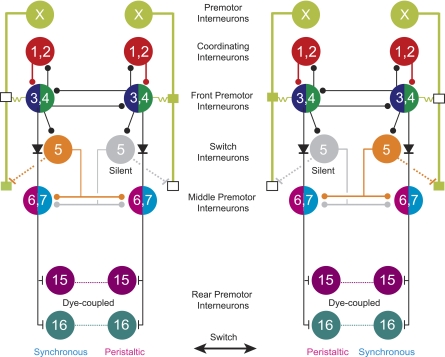
The HN(15) and HN(16) premotor interneurons are coordinated with front members of the CPG but are not connected to the heartbeat-timing network [the HN(1), HN(2), HN(3), and HN(4) interneurons] or to the HN(5) switch interneurons (Table 2, Fig. 12). Rather, the middle premotor HN(6) and HN(7) interneurons control the timing and pattern of the rear HN interneurons via excitatory inputs (Figs. 10 and 12, Table 2). As a consequence, the rear premotor heart interneurons fire nearly in phase with the middle premotor heart interneurons; yet, the side-to-side phase difference of the middle premotor heart interneurons (0.22 to 0.33) is larger than that of the rear premotor heart interneurons (0.13 to 0.15; Fig. 8) (Norris et al. 2006). Strong dye coupling between segmental pairs of rear heart interneurons (Fig. 3) suggests the presence of gap junctions, and the brief delay between pre- and postsynaptic events in segmental pairs of rear HN interneurons is also indicative of electrical coupling (Fig. 11). Coupling synchronizes the firing of the bilateral pairs of the rear heart interneurons and hence shapes the firing of the heart motor neurons in both peristaltic and synchronous coordination modes (Fig. 8).
Fig. 12.
Circuit diagrams show the synaptic connections among all known interneurons of the heartbeat CPG in its 2 coordination modes: left synchronous/right peristaltic and left peristaltic/right synchronous. Standard colors are used for the HN interneurons (see methods). Small vertical lines indicate excitatory synapses, small boxes along the HN(X) interneurons' axons in segments 3 to 6 are spike initiation sites, diodes indicate rectifying electrical synapses, and resistors indicate the electrical connection between the HN(3) and HN(4) interneurons and the anterior spike initiation site of the HN(X) interneuron. For simplicity, cells with similar input and output connections and function are combined. HN(1) and HN(2) interneurons (red circles) coordinate the activity of the HN(3) and (4) interneurons, and together these 4 pairs of interneurons form the beat-timing network. Switches in coordination mode of the CPG are associated with switches in which one HN (5) interneuron (the switch interneuron) is active (orange, synchronous side) and which one is silent (gray, peristaltic side). Dashed processes from the HN(5) interneuron to the posterior initiation site in segment 6 of the HN(X) interneuron indicate an indirect excitatory pathway. The newly identified rear premotor HN(15) and HN(16) interneurons receive excitatory input from both middle premotor interneurons. Diagrams are based on data from Calabrese (1977) and Norris et al. (2007a, 2007b).
Leech heartbeat provides an example of a stereotyped segmental motor pattern that is enriched by regional differences in the intersegmental and side-to-side coordination along the body axis. How is the change in direction of the fictive motor pattern (Figs. 1 and 2) in the rear created? Synaptic strength of the rear premotor interneurons gradually increases toward the rear: disregarding the very weak synaptic input from the front premotor heart interneurons, the HE(15) motor neuron receives relatively strong synaptic input from one rear and both middle premotor interneurons; the HE(16) motor neuron receives input from both rear and both middle premotor interneurons of comparable strength. Finally, the HE(17) and HE(18) motor neurons receive strong inhibitory input from the rear premotor heart interneurons while the strength from the middle premotor heart interneurons becomes relatively weak (Fig. 6A) (Norris et al. 2007a). This gradual increase of synaptic strength from the rear premotor heart interneurons may contribute to the decrease of the side-to-side phase difference in the HE(17) and HE(18) motor neurons and to the observed change in intersegmental coordination in both modes. On the synchronous side, the HE(16), HE(17), and HE(18) motor neurons deviate from firing in phase with their homologs in segments 15 and forward, change direction, and progress from front to rear. Similarly, on the peristaltic side, the HE(17) and HE(18) motor neurons deviate from the rear-to-front progression of the fictive motor pattern observed in segments 15 and forward, change direction, and also progress from front to rear (Fig. 1A). The fictive motor pattern may therefore translate into the constriction pattern observed in these segments (Fig. 2). Small side-to-side phase differences are thought to aid unidirectional blood transfer from the synchronous to the peristaltic side between the dorsal vessel and the hearts through shunts in segments 14 and posterior, the intestinal region (Boroffka and Hamp 1969; Wenning and Meyer 2007). Unidirectional blood transfer requires a small side-to-side phase lead of the synchronous side to prevent flow from the dorsal vessel into the synchronous heart (Wenning and Meyer 2007). Indeed, in the fictive motor pattern, the heart motor neuron bursts on the synchronous side precede those on the peristaltic side, and likewise, the rear heart segments on the synchronous side fill and empty slightly before those on the peristaltic side (Figs. 1A and 2). We did not find differences between juvenile and adult leeches in our previous study on the constriction pattern (see Fig. 8 in Wenning et al. 2004a). However, to definitely rule out possible developmental differences, adult leeches need to be imaged using the better methods described presently.
Intersegmental phase differences of the fictive motor pattern and the constriction pattern are not uniform along the body axis (Figs. 1 and 2). Different modules of the heartbeat CPG control this regional complexity. The front and the middle premotor interneurons govern the fictive motor pattern in segments 7 to 14 (Norris et al. 2007a, 2011). The HN(X) heart interneurons are thought to contribute along with the front premotor heart interneurons to the different intersegmental phases observed in anterior segments 3 to 6 (Figs. 1A and 2) (Calabrese 1977; Norris et al. 2007a). The new rear premotor heart interneurons create the convergence in phase in the rear. The rear premotor heart interneurons receive exclusively excitatory input (Fig. 12). For the rear premotor heart interneurons, the middle premotor interneurons provide the timing and the pattern for both coordination modes. The HN(X) premotor interneurons receive input from different sources for each coordination mode. The peristaltic pattern is provided through electrical synaptic input by an unknown source, and the synchronous pattern is provided by electrical input from the active (ipsilateral) switch HN(5) interneuron (Fig. 12; Calabrese 1977).
These three modules embellish the leech heartbeat motor pattern and in that respect resemble the subordinate CPGs that control individual limb movements in higher vertebrates (Grillner and Jessell 2009; Stein 2008). However, in contrast to these, the modules in the leech heartbeat system never gain independence and are tied to the core timing network at all times.
GRANTS
This work was supported by National Institute of Neurological Disorders and Stroke Grant NS-24072 to R. L. Calabrese.
DISCLOSURES
No conflicts of interest, financial or otherwise, are declared by the author(s).
ACKNOWLEDGMENTS
Drs. K. A. French and W. B. Kristan (University of California, San Diego, CA) kindly provided the juvenile leeches used for video imaging. We thank Zhenya L. Botezat for help with the video analysis.
REFERENCES
- Angstadt JD, Calabrese RL. Calcium currents and graded synaptic transmission between heart interneurons of the leech. J Neurosci 11: 746–759, 1991 [DOI] [PMC free article] [PubMed] [Google Scholar]
- Boroffka I, Hamp R. Topographie des Kreislaufsystems und Zirkulation bei Hirudo medicinalis. Z Morph Ök Tiere 64: 59–76, 1969 [Google Scholar]
- Büschges A. Sensory control and organization of neural networks mediating coordination of multisegmental organs for locomotion. J Neurophysiol 93: 1127–1135, 2005 [DOI] [PubMed] [Google Scholar]
- Büschges A, Akay T, Gabriel JP, Schmidt J. Organizing network action for locomotion: insights from studying insect walking. Brain Res Rev 57: 162–171, 2008 [DOI] [PubMed] [Google Scholar]
- Calabrese RL. The heartbeat neural control system of the leech. In: Handbook of Microcircuits, edited by Shepherd GM, Grillner S. Oxford: Oxford University Press, 2010, p. 450–456 [Google Scholar]
- Calabrese RL. The neural control of alternate heartbeat coordination states in the leech, Hirudo medicinalis. J Comp Physiol 122: 11–143, 1977 [Google Scholar]
- Fan RJ, Marin-Burgin A, French KA, Friesen WO. A dye mixture (Neurobiotin and Alexa 488) reveals extensive dye-coupling among neurons in leeches; physiology confirms the connections. J Comp Physiol A 191: 1157–1171, 2005 [DOI] [PubMed] [Google Scholar]
- García PS, Wright TM, Cunningham IR, Calabrese RL. Using a model to assess the role of the spatiotemporal pattern of inhibitory input and intrasegmental electrical coupling in the intersegmental and side-to-side coordination of motor neurons by the leech heartbeat central pattern generator. J Neurophysiol 100: 1354–1371, 2008 [DOI] [PMC free article] [PubMed] [Google Scholar]
- Grillner S, Jessell TM. Measured motion: searching for simplicity in spinal locomotor networks. Curr Opin Neurobiol 19: 572–586, 2009 [DOI] [PMC free article] [PubMed] [Google Scholar]
- Krahl B, Zerbst-Boroffka I. Blood Pressure in the Leech Hirudo medicinalis. J Exp Biol 107: 163–168, 1983 [Google Scholar]
- Kristan J, William B, Calabrese RL, Friesen WO. Neuronal control of leech behavior. Prog Neurobiol 76: 279–327, 2005 [DOI] [PubMed] [Google Scholar]
- Maranto AR, Calabrese RL. Neural control of the hearts in the leech, Hirudo medicinalis. I. Anatomy, electrical coupling, and innervation of the hearts. J Comp Physiol A 154: 367–380, 1984 [Google Scholar]
- Marder E, Bucher D, Schulz DJ, Taylor AL. Invertebrate central pattern generation moves along. Curr Biol 15: R685–R699, 2005 [DOI] [PubMed] [Google Scholar]
- Marder E, Calabrese RL. Principles of rhythmic motor pattern generation. Physiol Rev 76: 687–717, 1996 [DOI] [PubMed] [Google Scholar]
- Morgan PT, Jing J, Vilim FS, Weiss KR. Interneuronal and peptidergic control of motor pattern switching in Aplysia. J Neurophysiol 87: 49–61, 2002 [DOI] [PubMed] [Google Scholar]
- Norris BJ, Weaver AL, Morris LG, Wenning A, García PA, Calabrese RL. A central pattern generator producing alternative outputs: temporal pattern of premotor activity. J Neurophysiol 96: 309–326, 2006 [DOI] [PubMed] [Google Scholar]
- Norris BJ, Weaver AL, Wenning A, García PS, Calabrese RL. A central pattern generator producing alternative outputs: pattern, strength, and dynamics of premotor synaptic input to leech heart motor neurons. J Neurophysiol 98: 2992–3005, 2007a [DOI] [PubMed] [Google Scholar]
- Norris BJ, Weaver AL, Wenning A, García PS, Calabrese RL. A central pattern generator producing alternative outputs: phase relations of leech heart motor neurons with respect to premotor synaptic input. J Neurophysiol 98: 2983–2991, 2007b [DOI] [PubMed] [Google Scholar]
- Norris BJ, Wenning A, Wright TM, Calabrese RL. Constancy and variability in the output of a central pattern generator. J Neurosci 31: 4663–4674, 2011 [DOI] [PMC free article] [PubMed] [Google Scholar]
- Peterson EL, Calabrese RL. Dynamic analysis of a rhythmic neural circuit in the leech Hirudo medicinalis. J Neurophysiol 47: 256–271, 1982 [DOI] [PubMed] [Google Scholar]
- Pittendrigh CS. Circadian oscillations in cells and the circadian organization of multicellular systems. In: The Neurosciences Third Study Program, edited by Schmitt FO, Worden FG. Cambridge, MA: MIT Press, 1974, p. 437–458 [Google Scholar]
- Rosen SC, Teyke T, Miller MW, Weiss KR, Kupfermann I. Identification and characterization of cerebral-to-buccal interneurons implicated in the control of motor programs associated with feeding in Aplysia. J Neurosci 11: 3630–3655, 1991 [DOI] [PMC free article] [PubMed] [Google Scholar]
- Shafer MR, Calabrese RL. Similarities and differences in the structure of segmentally homologous neurons that control the hearts of the leech, Hirudo medicinalis. Cell Tissue Res 214: 137–153, 1981 [DOI] [PubMed] [Google Scholar]
- Siddall ME, Trontelj P, Utevsky SY, Nkamany M, Macdonald KS. Diverse molecular data demonstrate that commercially available medicinal leeches are not Hirudo medicinalis. Proc Biol Sci 274: 1481–1487, 2007 [DOI] [PMC free article] [PubMed] [Google Scholar]
- Stein PS. Motor pattern deletions and modular organization of turtle spinal cord. Brain Res Rev 57: 118–124, 2008 [DOI] [PMC free article] [PubMed] [Google Scholar]
- Thompson WJ, Stent GS. Neuronal control of heartbeat in the medicinal leech. I. Generation of the vascular constriction rhythm by heart motor neurons. J Comp Physiol 111: 261–279, 1976a [Google Scholar]
- Thompson WJ, Stent GS. Neuronal control of heartbeat in the medicinal leech. II. Intersegmental coordination of heart motor neuron activity by heart interneurons. J Comp Physiol 111: 281–307, 1976b [Google Scholar]
- Weaver AL, Roffman RC, Norris BJ, Calabrese RL. A role for compromise: synaptic inhibition and electrical coupling interact to control phasing in the leech heartbeat CPG. Front Behav Neurosci 4: 2010 [DOI] [PMC free article] [PubMed] [Google Scholar]
- Wenning A, Cymbalyuk GS, Calabrese RL. Heartbeat control in leeches. I. Constriction pattern and neural modulation of blood pressure in intact animals. J Neurophysiol 91: 382–396, 2004a [DOI] [PubMed] [Google Scholar]
- Wenning A, Hill AA, Calabrese RL. Heartbeat control in leeches. II. Fictive motor pattern. J Neurophysiol 91: 397–409, 2004b [DOI] [PubMed] [Google Scholar]
- Wenning A, Meyer EP. Hemodynamics in the leech: blood flow in two hearts switching between two constriction patterns. J Exp Biol 210: 2627–2636, 2007 [DOI] [PubMed] [Google Scholar]


