Abstract
There is little known about the prenatal development of the rostral nucleus of the solitary tract (rNST) neurons in rodents or the factors that influence circuit formation. With morphological and electrophysiological techniques in vitro, we investigated differences in the biophysical properties of rNST neurons in pre- and postnatal rats from embryonic day 14 (E14) through postnatal day 20. Developmental changes in passive membrane and action potential (AP) properties and the emergence and maturation of ion channels important in neuron function were characterized. Morphological maturation of rNST neurons parallels changes in passive membrane properties. Mean soma size, dendritic branch points, neurite endings, and neurite length all increase prenatally. whereas neuron resting membrane potential, input resistance, and time constant decrease. Dendritic spines, on the other hand, develop after birth. AP discharge patterns alter in pre- and postnatal stages. At E14, neurons generated a single TTX-sensitive, voltage-gated Na+ AP when depolarized; a higher discharge rate appeared at older stages. AP amplitude, half-width, and rise and fall times all change during development. Responses to current injection revealed a number of voltage-gated conductances in embryonic rNST, including a hyperpolarization-activated inward current and a low-threshold Ca2+ current that initiated Ca2+ spikes. A hyperpolarization-activated, transient outward potassium current was also present in the developing neurons. Although the properties of these channels change during development, they are present before synapses form and therefore, can contribute to initial establishment of neural circuits, as well as to the changing electrophysiological properties in developing rNST neurons.
Keywords: brain stem, central processing, in vitro recording, taste
the rostral nucleus of the solitary tract (rNST) is the initial integrative relay for multiple sensory inputs from the oral cavity. In rats, the taste system is functional at birth, as demonstrated by stereotypic behaviors to orally applied taste stimuli (Johanson and Shapiro 1986; Moe 1986). Therefore, chemical responses and central connections via rNST neurons to muscles of facial expression, with functional synapses, are present in late fetal and newborn rats.
Despite the fact that the rat has been used for decades to study taste function, there is little information on the prenatal development of rNST in rat or the factors that potentially influence circuit formation. There are data about temporal formation of the solitary tract (ST), the projection for taste nerves into the brain stem. Classic studies by Altman and Bayer (1982) identified afferent fibers projecting into the ST shortly after generation of ganglion neurons in rat. Reportedly, trigeminal nerve (V) fibers appear in the ST, first at embryonic day 12 (E12), followed closely by facial nerve (VII) at E13, and then finally, glossopharyngeal fibers at ∼E15. By E14, V and VII axons are reported to project medially and enter the anlage of the rNST and to increase steadily in density from E15 to E17 (Zhang and Ashwell 2001b). Synapses onto nucleus of the ST (NST) neurons have been identified as early as E17, and by E19, synaptic vesicles were described, suggesting the establishment of synaptic connections (Zhang and Ashwell 2001b).
Compared with initial formation of the ST, much less attention has been given to development of rNST neurons. Presumptive target neurons in the rNST for ST sensory afferents are reportably produced between E11 and E14 in rat, with peak production at E12 (Altman and Bayer 1982). The rNST is clearly visible by E15, individual subnuclei are apparent by E19, and mature expression patterns of acetylcholinesterase activity and a number of other biochemical markers (e.g., tyrosine hydroxylase, substance P, calbindin, and calretinin) have been demonstrated at E19 (Zhang and Ashwell 2001a). However, nothing is known of the cellular origin of these neurons or the development of their intrinsic membrane characteristics.
Early events in gestation can influence establishment of afferent terminations and the nature of neurophysiological responses of second order rNST neurons (Vogt and Hill 1993). Restriction of maternal dietary sodium (0.03% sodium chloride) maintained into adulthood results in a two- and threefold increase in volume of afferent taste nerve terminal fields (May and Hill 2006) and a fourfold increase in the number of synapses made by chorda tympani nerve terminals (May et al. 2007), compared with controls. Importantly, a brief critical period of sodium restriction from E3 to E12 is sufficient to achieve this terminal field expansion (Krimm and Hill 1997; Mangold and Hill 2007).
Understanding how and when rNST neurons begin to function during embryonic development is a necessary first step for any future studies about regulatory factors in taste plasticity. Because a remarkable plasticity is documented in the postnatal taste system, based on prenatal interventions, study of temporal events in development of rNST function is necessary to understand the biological underpinnings and limitations of taste plasticity. In the current study, we investigated the biophysical properties of rNST neurons in prenatal rodents during a broad gestational period. Developmental differences in passive membrane and action potential (AP) properties are demonstrated, with ion current emergence and changes that support these functional characteristics.
METHODS
Preparation of brain stem slices.
Sprague-Dawley rats between E14 and postnatal age 20 days (P20; 39 embryos and 61 postnatal rats) were used. All procedures were conducted under National Institutes of Health- and University of Michigan Animal Care and Use Committee-approved protocols. Embryos were obtained from timed pregnant dams (Charles River Laboratories, Wilmingon, MA) by hysterectomy under halothane anesthesia on the day of experiment. The day on which a vaginal plug was found was designated E0. Postnatal rats were obtained from timed pregnant dams. The day on which pups were born was P0.
Embryos and postnatal rats were decapitated. For postnatal rats, the decapitation was carried out under halothane anesthesia. The brain was rapidly removed and cooled for 5–8 min in an oxygenated physiological saline solution, in which NaCl was replaced with isosmotic sucrose at 4°C (Aghajanian and Rasmussen 1989). The brain stem was transected at the level of the pons and just caudal to the obex and secured onto a Vibratome (Technical Products International, St. Louis, MO) stage with agarose. The brain stem was sectioned horizontally into 200- or 250-μm-thick slices, which were incubated for at least 1 h in an oxygenated artificial cerebrospinal fluid (ACSF) at room temperature before transfer to a recording chamber. ACSF contained (in mM) 124 NaCl, 5 KCl, 2.5 CaCl2, 1.3 MgSO4, 26 NaHCO3, 1.25 NaH2PO4, and 25 dextrose and was gassed with a 95% O2-5% CO2 mixture to achieve a solution pH of 7.4.
Recording.
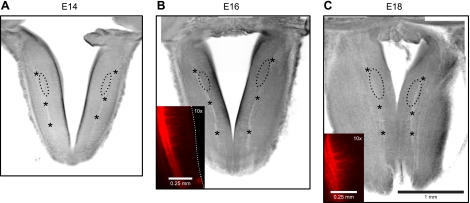
Brain stem slices were transferred to a recording chamber attached to the stage of a microscope (Eclipse E600 FN, Nikon, Japan) and anchored with nylon mesh. During recording, the slice was superfused at 2–2.5 ml/min with oxygenated ACSF. The recording chamber was kept at 32°C by a heating unit. The ST was used as an anatomical landmark to search for rNST (Fig. 1, A–C). Recording sites were ∼1.2, 1.0, and 0.9 mm rostral to the narrowest point of the fourth ventricle in the brain stem slices at E14, E16, and E18, respectively. These recording sites are in an area in which collateral branches were observed in a study of the developing ST (Tsukamoto et al. 2005) (Fig. 1, B and C). At E20 and older, recording sites were in the NST area, which was rostral to the level where the NST abuts the fourth ventricle. Neurons in rNST were observed using infrared-differential interface contrast optics via a charged-coupled device camera (IR-1000, DAGE-MTI, Michigan City, IN). The neurons were recorded in whole-cell mode using a patch-clamp amplifier (Axoclamp-2B, Axon Instruments, Sunnyvale, CA).
Fig. 1.
Horizontal brain stem slices from rat embryos. A–C: brightfield images of brain stem slices at embryonic day 14 (E14), E16, and E18. The trajectory of solitary tract (ST) is indicated by asterisks. Approximate recording sites are circled by dots. B and C inset: 1, 1′-dioctadecyl-3,3,3′,3′-tetramethylindocarbocyanine perchlorate anterograde transport from the geniculate ganglion to illustrate collateral, medially directed branching of the ST.
Signals were recorded through a 2-kHz low-pass filter, digitized at 20–50 kHz (Digidata 1200, Axon Instruments), and stored on a computer hard disk. Data were acquired using a data acquisition module Clampex in pCLAMP 8 software (Axon Instruments). Patch pipettes were made of borosilicate glass capillaries (TW150F-4, World Precision Instruments, Sarasota, FL), using a two-stage puller (PP-83, Narishige, Tokyo, Japan), and filled with a solution that contained (in mM) 130 K-gluconate, 10 HEPES, 10 EGTA, 1 MgCl2, 1 CaCl2, and 2 ATP, buffered to pH 7.2 with KOH. Lucifer Yellow (Sigma-Aldrich, St. Louis, MO) was dissolved in the pipette solution at a concentration of 0.1% to label recorded neurons. Tip resistance of filled pipettes was 6–8 MΩ.
Neuron reconstruction.
After patch-clamp recording, slices were fixed in 4% paraformaldehyde in 0.1 M phosphate buffer for 24 h. Fixed slices were rinsed in the phosphate buffer for 30 min, embedded in 4% agar, and then cut into 100-μm-thick sections on a Vibratome. The sections were mounted on glass slides, dried overnight, and then coverslipped with an antifade medium (ProLong Gold, Molecular Probes, Eugene, OR).
Neurons filled with Lucifer Yellow were scanned, and serial images were captured in 1-μm image stacks using a laser confocal microscope (Nikon C-1 confocal microscope). Projection images were made from the stacked serial images, and neurons were traced on the projection images using a neuroanatomical analysis program (Neurolucida, MBF Bioscience, Williston, VT). Analyses were: soma size, number of primary dendrites, branch points, neurite length, number of neurite endings, and number and density of neurite spines.
Data analysis.
Electrophysiological data were analyzed using a data analysis module Clampfit in pCLAMP 8 (Axon Instruments). The junction potential, due to potassium gluconate (10 mV), was subtracted from the membrane potential (Vm) values. Whole-cell configuration was first established in current-clamp recording mode and resting Vm (Vrest), input resistance (Rinput), and membrane time constant measured. Rinput was calculated from change in Vm evoked by a hyperpolarizing current (10 pA, 2-s long). Membrane time constant was measured by fitting a single exponential function to the data points in the hyperpolarizing phase of the same recording. Membrane capacitance (Cm) was calculated by dividing the time constant by Rinput. APs and afterhyperpolarization (AHP) were evoked by depolarizing currents. During the recording of AP and AHP, baseline Vm was maintained at −55 mV by constant direct current (DC). AP threshold was defined as Vm at the inflection point of the rising phase. AP amplitude was defined as the difference in Vm between the peak and threshold. AHP amplitude was defined as the difference in Vm between the peak AHP and AP threshold. The time to peak of the AHP was defined as elapsed time of the change in Vm from AP threshold to the peak AHP.
Recording mode was switched to voltage clamp to obtain the hyperpolarization-activated, transient outward potassium (IKA) and inward currents (Ih). Holding potential was set at −60 mV.
We evoked the IKA using standard protocols (Tell and Bradley 1994): membrane hyperpolarization to −120 mV for 1 s, followed by depolarization to various Vm between −70 and −10 mV in 10-V steps for 1.2 s total time. Sustained outward current (SUS) was obtained by depolarization steps between −70 and −10 mV (10-mV increment) for 1.2 s without a hyperpolarizing prepulse. IKA was isolated by digital subtraction of the SUS from the transient outward current (TOC). IKA amplitude and decay time constant were measured at membrane depolarization to −30 mV. IKA amplitude was defined as the difference between peak and steady-state values. IKA decay time constant was calculated by fitting a single exponential curve to the data points of the decay phase included in 10–90% of the IKA amplitude. The voltage-dependent inactivation of IKA was observed by depolarizations to −30 mV for 1.2 s following hyperpolarizations to various Vm between −110 and −30 mV (10-mV step) for 1 s.
Ih was evoked by hyperpolarizing steps between −60 mV and −150 mV for 2 s. The amplitude of Ih was defined as the difference between the peak and steady-state values of currents in response to the hyperpolarizing steps. Activation curve for IKA and Ih as well as inactivation curve for IKA were fit with the Boltzmann function using data analysis Origin software (OriginLab, Northampton, MA).
Statistical analysis was conducted using SPSS Statistics 18 (SPSS Software, Armonk, NY). Normality of data was assessed using the Shapiro-Wilk test. When data were normally distributed, statistical differences between groups were tested using ANOVA with a post hoc test. Scheffe and Games-Howell post hoc tests were used in cases of equal and unequal variances of data, respectively. When normal distributions were rejected, statistical differences between groups were tested using the Kruskal-Wallis test, followed by multiple Mann-Whitney tests with the Bonferroni correction. Significance level was set at 0.05. Mean values and the number of observations (n) for all stages and variables are shown in Table 1.
Table 1.
Electrophysiological properties of prenatal and early postnatal neurons in rNST
| E14/16 | n | E18/20 | n | P0-2 | n | P6-8 | n | P14-20 | n | |
|---|---|---|---|---|---|---|---|---|---|---|
| Vrest (mV) | −36 ± 2 | 19 | −49 ± 2 | 18 | −52 ± 2 | 23 | −49 ± 2 | 15 | −56 ± 1 | 36 |
| Rinput (GΩ) | 2.0 ± 0.4 | 19 | 1.9 ± 0.2 | 18 | 1.3 ± 0.2 | 23 | 1.0 ± 0.1 | 15 | 0.7 ± 0.1 | 36 |
| Membrane time constant (ms) | 92 ± 14 | 19 | 75 ± 6 | 22 | 70 ± 9 | 23 | 55 ± 5 | 19 | 41 ± 3 | 36 |
| Cm (pF) | 31 ± 1 | 19 | 37 ± 2 | 18 | 52 ± 3 | 23 | 52 ± 4 | 15 | 56 ± 3 | 36 |
| AP threshold (mV) | −30 ± 2 | 14 | −34 ± 1 | 20 | −36 ± 1 | 25 | −38 ± 2 | 18 | −39 ± 1 | 39 |
| AP height (mV) | 18 ± 2 | 14 | 34 ± 3 | 20 | 43 ± 3 | 25 | 50 ± 3 | 18 | 61 ± 2 | 39 |
| AP peak potential (mV) | −12 ± 2 | 14 | −0.4 ± 3 | 20 | 7 ± 2 | 25 | 12 ± 2 | 18 | 22 ± 1 | 39 |
| AP rising velocity (mV/ms) | 8 ± 1 | 24 | 19 ± 2 | 26 | 34 ± 4 | 29 | 44 ± 5 | 19 | 82 ± 4 | 40 |
| AP falling velocity (mV/ms) | 5 ± 0.3 | 24 | 8 ± 1 | 26 | 16 ± 4 | 29 | 22 ± 2 | 19 | 45 ± 2 | 40 |
| AP half-width (ms) | 12 ± 1 | 14 | 6 ± 1 | 20 | 4 ± 0.3 | 25 | 3 ± 0.3 | 18 | 1.7 ± 0.1 | 39 |
| AHP amplitude (mV) | 5 ± 1 | 14 | 7 ± 1 | 20 | 12 ± 1 | 25 | 15 ± 1 | 18 | 15 ± 1 | 39 |
| AHP peak time (ms) | 20 ± 3 | 14 | 14 ± 2 | 20 | 16 ± 1 | 25 | 16 ± 2 | 18 | 6 ± 1 | 39 |
| AP discharge rate (/s) | 1 ± 3 | 35 | 3 ± 1 | 27 | 8 ± 1 | 30 | 11 ± 2 | 20 | 17 ± 1 | 39 |
| IKA amplitude (pA) | 77 ± 12 | 29 | 143 ± 18 | 23 | 182 ± 30 | 28 | 242 ± 32 | 14 | 247 ± 33 | 25 |
| IKA decay time constant (ms) | 23 ± 2 | 14 | 29 ± 4 | 17 | 44 ± 8 | 20 | 43 ± 12 | 11 | 99 ± 12 | 19 |
| Ih amplitude (pA) | 12 ± 3 | 14 | 17 ± 2 | 18 | 32 ± 5 | 22 | 36 ± 7 | 13 | 29 ± 4 | 27 |
Values are means ± SE. rNST, rostral nucleus of the solitary tract; E, embryonic day; P, postnatal day; Vrest, resting membrane potential; Rinput, input resistance; Cm, membrane capacitance; AP, action potential; AHP, after-hyperpolarization; IKA, transient outward potassium current; Ih, inward current.
RESULTS
Neuron morphology.
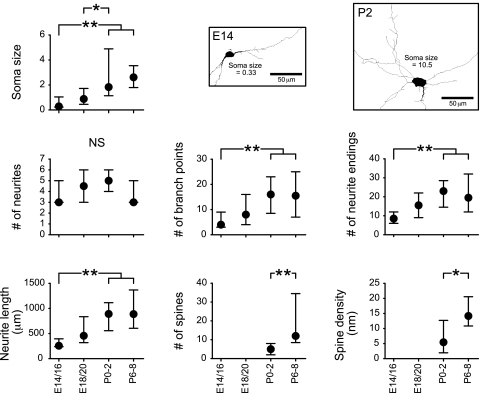
rNST neuron morphology was analyzed at prenatal ages (E14/16, n = 14; E18/20, n = 25) and P0–2 (n = 32) and P6–8 (n = 15). Soma size and neurite parameters increased substantially during the prenatal period (Fig. 2). The mean soma size, number of branch points, neurite endings, and neurite length at E14/16 were all significantly different from values at P0–2 (Fig. 2). Spines were not detected on the prenatal rNST neurons but were obvious after birth. Spine numbers and density increased significantly after birth (Fig. 2).
Fig. 2.
Morphometric analysis of pre- and postnatal neurons in rostral nucleus of the ST (rNST). Developmental increases in all measures are observed, except number of neurites. Spines were not observed in embryonic stages. Neuronal tracings of E14 and postnatal day 2 (P2) rNST neurons are shown in middle and top right panels. Values are medians within the 25th–75th percentile range. Horizontal bars above each graph indicate pairs with significant differences; *P < 0.01 and **P < 0.05, Mann-Whitney test. NS, not significant.
The different rNST neuron morphologies characteristic of the adult rNST (ovoid, fusiform, and multipolar) are not apparent in embryonic neurons, which generally resemble the ovoid neurons described in the adult rNST. The different adult morphologies become apparent in the postnatal animals. Tracings of an E14 and P2 neuron illustrate changes in neuron complexity (Fig. 2).
Passive membrane properties.
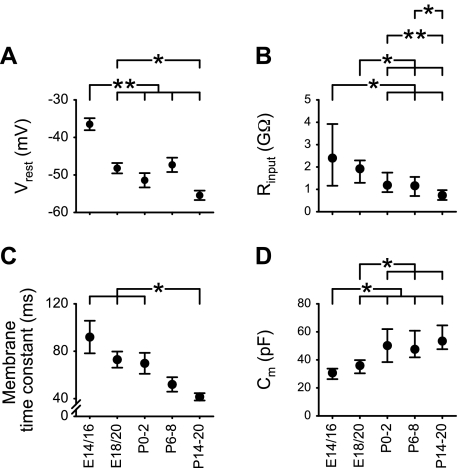
Passive membrane properties of rNST neurons changed significantly during the prenatal period (Table 1). The mean Vrest significantly shifted in a hyperpolarizing direction between E14/16 and E18/20 and then was maintained at the lower level (Fig. 3A). Rinput decreased across embryonic and postnatal stages with a notable decrease in variability between stages (Fig. 3B). Membrane time constant also decreased, and the wide variability observed at embryonic stages was much reduced at P14–20 (Fig. 3C). Cm increased significantly between E14/16 and P0–2 and then stabilized (Fig. 3D). Overall, major differences were observed in membrane characteristics between E14/16 or E18/20 and the earliest postnatal stage.
Fig. 3.
Developmental changes in passive membrane properties. A: resting membrane potential (Vrest). B: input resistance (Rinput). C: membrane time constant. D: membrane capacitance (Cm). Values of Vrest and membrane time constant are means ± SE, and values of Rinput and Cm are medians within the 25th–75th percentile range. Statistical differences in Vrest and membrane time constant between groups were tested using Scheffe and Games-Howell tests, respectively. Statistical differences in Rinput and Cm between groups were tested using Mann-Whitney tests. Horizontal bars above each graph indicate pairs with significant differences; *P < 0.01 and **P < 0.05.
AP.
AP discharge patterns and underlying ion currents were observed in pre- and postnatal rNST neurons. Baseline Vm was maintained at −55 mV with constant DC during recording of APs and AHP.
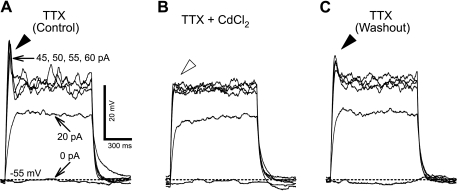
Neurons in rNST generated a single AP in response to a depolarizing current at E14. The transient spikes were suppressed by the voltage-gated Na+ channel blocker TTX (1 μM) in three of five neurons at E14, and all neurons tested at E16 and older (n = 5 each at E16, P0–2, and P6–8), indicating that TTX-sensitive, voltage-gated Na+ channels are functional in rNST neurons as early as E14. In a subset of rNST neurons at E16 and older (n = 10), the Ca2+ channel blocker CdCl2 (200 μM) was applied to determine any contribution of voltage-gated Ca2+ current (ICa) to AP generation. TTX suppressed transient spikes evoked by depolarizing currents, but some spikes were still evoked in the presence of TTX (Fig. 4A). CdCl2 eliminated the remaining spikes (Fig. 4B). These results indicate that Ca2+ channels are also functional and contribute to the AP in rNST neurons as early as E16.
Fig. 4.
Cd2+-sensitive component of action potential (AP) in a neuron at E20. A: membrane depolarization and spikes (filled arrowhead) evoked by depolarizing current steps (0, 20, 45, 50, 55, and 60 pA) in the presence of TTX. B: membrane depolarizations evoked by the same current protocol in the presence of CdCl2 and TTX. The spikes seen in the control recording are eliminated (open arrowhead). C: washout to demonstrate return of spikes. Membrane potential (Vm) was maintained at −55 mV with constant direct current during recording.
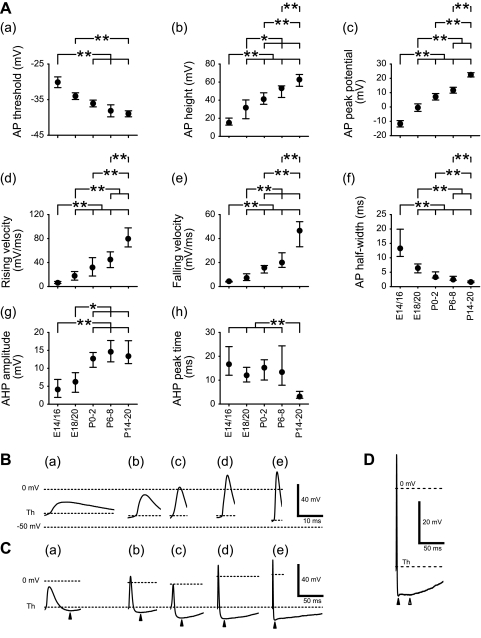
AP properties altered significantly before birth. The threshold for spike initiation shifted in a hyperpolarizing direction between E14/16 and P0–2 (Fig. 5Aa and Table 1). AP amplitude increased steadily between E14/16 and P14–20 (Fig. 5Ab). Only one of 14 neurons tested had overshooting APs at E14/16. Mean value of the AP peak first exceeded 0 mV at P0–2, and all neurons (n = 39) were able to generate overshooting APs at P14–20 (Fig. 5Ac).
Fig. 5.
Developmental changes in electrophysiological properties of AP and after-hyperpolarization (AHP). A: changes in AP (a–f) and AHP (g and h) properties. Values of AP threshold (Th) and AP peak potential are means ± SE, and other values are medians within the 25th–75th percentile range. Statistical differences in AP threshold and AP peak potential between groups were tested using Scheffe and Games-Howell tests, respectively, and the differences in other values between groups were tested using Mann-Whitney tests. Horizontal bars above each graph indicate pairs with significant differences; *P < 0.01 and **P < 0.05. B: representative traces to illustrate AP shape at different ages. C: representative traces showing AHPs at different ages. The peak of AHP is indicated by an arrowhead below each trace. D: peaks of fast (filled arrowhead) and slow (open arrowhead) AHPs in a neuron at P14–20.
AP rising and falling slope velocities (Fig. 5, Ad and Ae) became faster, and duration measured at half-maximal amplitude decreased between E14/16 and P14–20 (Fig. 5Af), resulting in sharper APs. Properties of the AHP also changed. Amplitude increased between E14/16 and P0–2 (Fig. 5Ag), and the time to peak became faster postnatally (between P6–8 and P14–20; Fig. 5Ah).
Examples of APs in each age group are illustrated in Fig. 5Ba–e, demonstrating how changes in AP characteristics influence AP shape. Developmental changes in AHP are illustrated in Fig. 5C. In the younger age groups (E14/16 through P6–8; Fig. 5Ca–d), AHPs have slow kinetics. At P14–20, neurons had AHPs with fast and slow components (Fig. 5D).
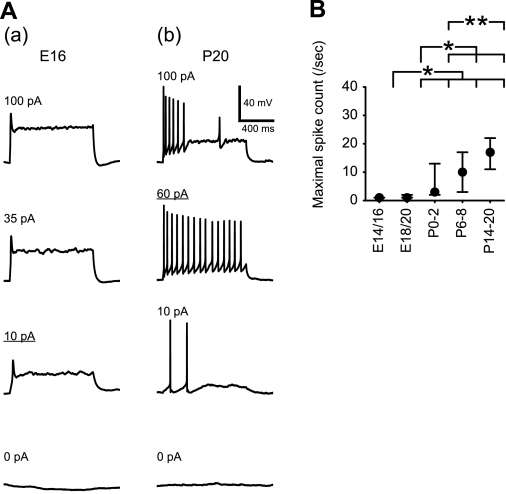
At E14/16, almost all neurons (34 of 35 neurons) generated only a single AP (Fig. 6Aa), although depolarizing currents above rheobase were injected. Neurons with higher discharge rate appeared at older stages (Fig. 6Ab). Thus AP pattern changed, and maximal discharge frequency increased steadily during development (Fig. 6B).
Fig. 6.
AP discharge in response to tonic membrane depolarization. A: AP spikes evoked by depolarizing current steps (1-s duration) in neurons at E16 (a) and P20 (b). The current intensities are indicated in the top left of each trace. Depolarizing currents (10 and 60 pA) resulted in maximal spike counts in the E16 and P20 neurons, respectively. B: developmental change in maximal spike count. Values are medians within the 25th–75th percentile range. Horizontal bars above the graph indicate pairs with significant differences; *P < 0.01 and **P < 0.05, Mann-Whitney test.
Low voltage-activated ICa.
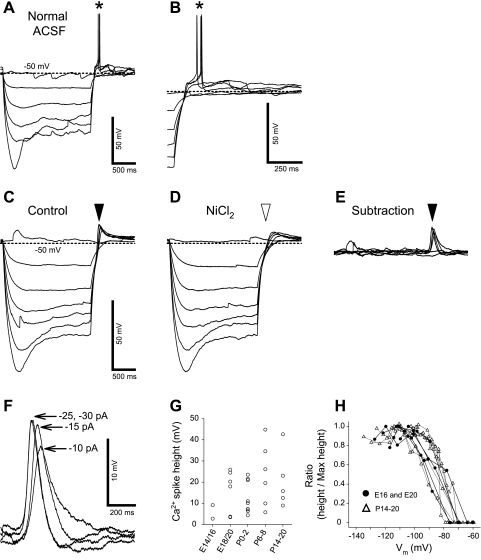
Membrane hyperpolarization induced neuronal excitation via triangular depolarization, referred to as postinhibitory rebound (PIR), which results in an AP (PIR spike) when the amplitude of the transient depolarization exceeds AP threshold (Guido et al. 1998). We obtained PIR spikes immediately after the end of hyperpolarizing current injection pulses, which resulted in a Vm between −100 and −110 mV (Fig. 7, A and B). Approximately 30% of the neurons displayed PIR spikes in prenatal animals (28% or 16 of 57 neurons at E14/16; 28% or 14 of 51 neurons at E18/20). The incidence of PIR spikes was significantly higher at P0–2 (52% or 16 of 31 neurons) and at P6–8 (67% or 10 of 15 neurons). The incidence was 35% at P14–20 (13 of 37 neurons).
Fig. 7.
Postinhibitory rebound (PIR) and low voltage-activated (LVA) Ca2+ spike in a neuron at E18. A: membrane depolarizations and AP spikes (asterisk) induced by PIRs after membrane hyperpolarizations, which were evoked by negative current injection steps (0–30 pA in 5 pA step, 2-s duration). ACSF, artificial cerebrospinal fluid. B: termination of hyperpolarizations of A with expanded time scale. C: membrane depolarizations induced by PIRs in the presence of TTX (filled arrowhead). D: membrane depolarizations in the presence of NiCl2 and TTX. Transient membrane depolarizations were eliminated by NiCl2 (open arrowhead). E: Ni2+-sensitive spikes (filled arrowhead) computed by subtraction of traces in D from those in C, indicating LVA Ca2+ spikes. F: expanded voltage and time scale of traces in E. Intensities of hyperpolarizing currents are indicated on the right of each trace of the Ca2+ spikes. G: relationship between Ca2+-spike amplitudes and different age groups. H: relationships of hyperpolarized Vm with Ca2+-spike amplitude in prenatal (circles) and postnatal (triangles) neurons. The spike amplitudes were normalized to the maximum amplitude.
The major component of PIR is membrane depolarization via low voltage-activated (LVA) ICa in adult rNST neurons (Guido et al. 1998; Tell and Bradley 1994). To characterize the LVA Ca2+ spike, we used NiCl2 to block ICa with a voltage protocol, in which Vm was hyperpolarized between −100 and −110 mV. Baseline Vm was maintained at −55 mV with constant DC during recording of LVA Ca2+ spikes. Membrane hyperpolarization between −100 and −110 mV completely releases LVA ICa from its inactivation state in both embryonic (see plots of the ratio of the amplitude of the maximum PIR and the PIR amplitude at different membrane hyperpolarization; Fig. 7H) and adult rNST neurons (Tell and Bradley 1994). This experiment was performed in the presence of 1 μM TTX to block APs and 5 mM 4-AP to block IKA.
Detectable LVA Ca2+ spikes were obtained at E16 and older (Fig. 7, C, E, and F), and these were suppressed by 200 μM NiCl2 (Fig. 7D). Because a similar concentration of NiCl2 preferably blocks the T-type Ca2+ channel in neurons of various brain areas (reviewed in Perez-Reyes 2003), sensitivity of the Ca2+ spikes to 200 μM NiCl2 suggests that T-type Ca2+ channels are functional in rNST neurons as early as E16. LVA Ca2+ spikes were observed in rNST neurons at all developmental ages. There was no significant difference in amplitude of the Ca2+ spike between E18/20 and P14–20 (Fig. 7G).
Hyperpolarization-activated IKA.
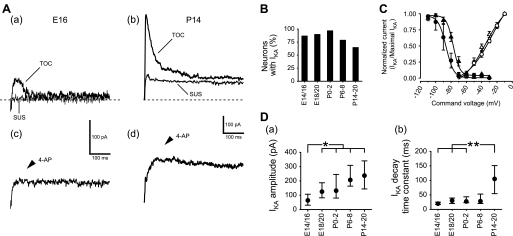
The IKA influences the repetitive firing pattern of adult rNST neurons (Suwabe and Bradley 2009; Tell and Bradley 1994; Uteshev and Smith 2006). We determined prenatal development of IKA in rNST neurons using voltage protocols and 4-AP blocking. Depolarization with a hyperpolarizing prepulse (see methods, Data analysis) evoked an IKA (transient out current; Fig. 8, Aa and Ab), whereas depolarization without a hyperpolarizing prepulse failed to evoke an IKA (sustained outer current; Fig. 8, Aa and Ab). The IKA was suppressed by 5 mM 4-AP (n = 2, E14; 6, E16; 2, E18; 7, P6–8; 5, P14–20; Fig. 8, Ac and Ad). These electrophysiological and pharmacological properties indicate the presence of functional IKA channels in rNST neurons as early as E14. Many neurons exhibited IKA at E14/16 (Fig. 8B). The incidence of IKA was significantly smaller at P14–20 compared with the other ages (P = 0.03 by Fisher's exact test; Fig. 8B).
Fig. 8.
Transient outward potassium currents (IKA) in neurons at E16 and P14. A: transient outward current (TOC) and sustained outward current (SUS) at E16 (a) and P14 (b). The IKA were evoked by hyperpolarization to −120 mV, followed by depolarization to −30 mV. The SUS were evoked by depolarization to −30 mV without the hyperpolarizing prepulse. The TOC were eliminated by 4-AP in the same neurons at E16 (c) and P14 (d). Dashed lines indicate 0 pA level. B: incidence of neurons with IKA at different ages. C: activation and inactivation curves for IKA at E14/16 (filled and open circles) and P14–20 (filled and open triangles). Values are means ± SE. D: developmental changes in amplitude (a) and decay time constant (b) of IKA. Values are medians within the 25th–75th percentile range. Horizontal bars above each graph indicate pairs with significant differences; *P < 0.01 and **P < 0.05, Mann-Whitney test.
Although IKA was detected as early as E14, electrophysiological properties of this current changed during development. When inactivation curves were compared between E14/16 (n = 5; Fig. 8C) and P14–20 neurons (n = 6; Fig. 8C), the curve was shifted in the depolarizing direction postnatally. In contrast, the activation curve did not change significantly between these two ages (Fig. 8C). The size (combination of amplitude with decay time constant) of IKA was too small to suppress AP discharge in some prenatal neurons. The amplitude and decay time constant were larger (Fig. 8Da) and longer (Fig. 8Db) during development, possibly relating to maturation of spike-pattern generation.
Hyperpolarization-activated Ih.
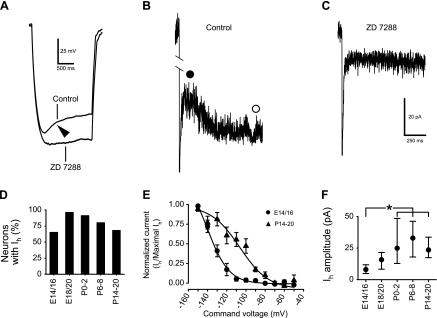
Ih has also been reported in adult rNST neurons (Suwabe and Bradley 2009; Tell and Bradley 1994; Uteshev and Smith 2006) as a subthreshold current. Ih, indicated as a difference between peak and steady-state Vm (voltage sag), was already detectable in current-clamp recording at E14 when 65% of rNST neurons exhibited voltage sag (Fig. 9D). The percentage of neurons with voltage sag was significantly higher in E18/20 neurons (P = 0.007 by Fisher's exact test). Neurons with voltage sag showed a nonohmic current response in voltage-clamp recordings. Ih was confirmed using a specific blocker, ZD 7288 (100 μM). Voltage sag (Fig. 9A) and Ih (Fig. 9B) were eliminated by ZD 7288 (three neurons each at E16, E18, E20, P2, and P20; Fig. 9, A and C). These results demonstrated that Ih is functional in rNST neurons as early as E14.
Fig. 9.
Difference between peak and steady-state Vm (voltage sag) and inward current (Ih) in an E16 neuron. A: voltage sag (arrowhead) evoked by hyperpolarizing current (30 pA) was eliminated by Ih blocker ZD 7288. B: current trace in response to hyperpolarization to −130 mV in control ACSF. Difference between filled and open circles indicates amplitude of Ih. C: current trace in response to hyperpolarization to −130 mV in the presence of ZD 7288. Ih was eliminated by ZD 7288. D: incidence of neurons with Ih at different ages. E: activation curves for Ih at E14/16 (circles) and P14–20 (triangles). F: developmental change in amplitude of Ih. Values are medians within the 25th–75th percentile range. Horizontal bars above the graph indicate pairs with significant differences; *P < 0.05, Mann-Whitney test.
Between E14/16 (n = 6) and P14–20 neurons (n = 7), the Ih activation curve was shifted postnatally in the depolarizing direction (Fig. 9E). The amplitude of Ih increased between E14/16 and P0–2 (Fig. 9F).
DISCUSSION
With studies of developing morphological, intrinsic membrane, AP, and ion channel properties, we have shown that rNST neurons are functional as early as E14. However, there are major developmental differences in neuron morphology and neurophysiology before birth, and changes continue postnatally. Notably, whereas soma size progressively increases, as does neuron complexity, spines are not observed on embryonic rNST neurons but are seen only after birth; threshold to spike decreases, the AP becomes shorter, and there is a steady shift in discharge pattern from one AP in the embryonic neuron to a sustained train in postnatal stages.
Underlying the numerous, detailed changes in passive membrane and AP characteristics are not only basic neuron morphology, but also, importantly, ion channel properties shift remarkably during development. As early as E14–16, there is evidence of Ca2+ and K+ channel function in rNST neurons, but channel properties change in the embryo and continue to alter after birth. As neurons differentiate, voltage-gated Ca2+ channels might regulate neuron death, migration, and proliferation and neurite outgrowth (Spitzer et al. 1994). These channels are important in driving “activity-dependent” development also (Rakic et al. 1994).
In short, we demonstrate very early function in rNST neurons but in turn, show that there are substantial embryonic changes and neurophysiological changes that continue after birth. Thus there is an embryonic emergence of function in rNST before taste buds have appeared, yet changes continue after birth with opportunities to “shape” taste responses by incoming taste input from developing taste buds. The embryonic and early postnatal differences in rNST, which we have documented, provide a clear base for the extreme plasticity of the taste system, widely reported in the field (Hill and May 2006).
The early rNST.
Presumptive rNST neurons are generated in the ventricular zone between E11 and E14 in rat (Altman and Bayer 1980). An identifiable NST is detectable by Nissl staining at E15, and all subnuclei of NST are discernable at E19 (Zhang and Ashwell 2001a). Afferent fibers of ST, which originate in the geniculate ganglion, enter the developing brain stem as early as E13 and run throughout the brain stem by E14 (Tsukamoto et al. 2005). The ST begins to send collateral fibers medially toward the presumptive rNST, at least as early as E16 (Tsukamoto et al. 2005). Synaptic thickenings are apparent in pre- and postsynaptic membranes at E15, although synaptic vesicles were not reported until E19 (Zhang and Ashwell 2001b). The terminal fields of gustatory afferent fibers have been reported to become larger in postnatal rats (Lasiter 1992), but more recent investigations report that the terminal field volume is greater at P15 and P25 than in rats aged P35 and older (Sollars et al. 2006). Detailed data on embryonic terminal fields are not available. However, available neuroanatomical reports, in combination with our electrophysiological data, indicate that newly forming rNST neurons from as early as E14 are able to generate APs, and the afferent ST fibers are within the brain stem and positioned to form connections for early circuit formation.
Development of passive membrane properties and neuron morphology.
Combined intracellular injection of Lucifer Yellow and electrophysiological recordings demonstrate morphological maturation of rNST neurons in parallel with changes in passive membrane properties. Vrest alters substantially in the hyperpolarizing direction before birth. As reported in our previous study (Bao et al. 1995), Vrest is relatively stable postnatally. These findings indicate that cellular mechanisms responsible for Vrest develop well before birth in rodents.
Rinput decreases prenatally, whereas Cm increases only after birth, paralleling the marked changes in total membrane volume and dendritic complexity. This discrepancy in time course also suggests developmental changes in membrane kinetics, as well as a postnatal developmental increase in density of resting channels.
Associated with development of biophysical properties are morphological modifications in rNST neurons. At P0−2, neurons have much increased dendritic trees compared with E14. By P6–8, the neurons are more similar to adult rNST, with a large soma from which two to four dendrites emerge with very few ramifications. Others have reported that dendritic length increases approximately threefold between P8 and P25 (Lasiter et al. 1989), whereas dendritic branching decreses with age (Bao et al. 1995).
Development of AP characteristics.
AP threshold shifts in the hyperpolarizing direction between E14/16 and P0–2 and then stabilizes. This demonstrates that rNST neurons acquire adult-like excitability in terms of threshold to generate a spike by a few days after birth. The amplitude and maximal rising and falling velocities of the AP change with a similar time course. Increased AP amplitude would suggest increased density of voltage-gated Na+ channels. Increases in both maximal rise and fall rates of AP reflect developmental changes in the kinetics of voltage-gated Na+ and K+ channels (Hille 2001). The slow AP kinetics at younger stages may be advantageous for neurons to increase the influx of cations (reviewed in Spitzer 1991). Entry of cations, such as Na+ and Ca2+, is important in establising neural circuits (see discussion in Significance to development of rNST gustatory circuits below).
Both the amplitude and rise time to peak amplitude increase during development of the AHP. Between E14–16 and P6–8, AHPs consist of a single, slow component. At P14–20, neurons have AHPs with slow and fast components, suggesting that at least two types of K+ channels underlie developmental changes in electrophysiological properties of the AHP. In other neurons, the slow AHP is generated by a small-conductance Ca2+-activated K+ channel, and the fast AHP is due to a second voltage-gated K+ channel (Hille 2001). Thus the ion channels responsible for the fast and slow components of the AHP develop at different pre- and postnatal ages in the rodent rNST.
Development of ionic currents.
We identified TTX-sensitive AP components and the membrane currents that influence AP firing patterns—IKA and Ih—as early as E14 in rNST neurons. At this stage, the VII th nerve already enters the brain stem, but few collateral fibers extend toward the presumptive rNST. Our data demonstrate that prenatal rNST neurons are already excitable, and channels for IKA and Ih are functional before formation of synaptic connections. Ca2+ channel-mediated components [high voltage-activated (HVA) and LVA components] were also detectable in current-clamp recordings in the prenatal period, indicating that HVA and LVA ICa together with Na+ current are involved in neural excitation in the developing rNST. However, because voltage-gated ICa, in particular, HVA ICa, shows rapid rundown (Hille 2001), the age when Ca2+ channel-mediated components first appear in patch-clamp recordings could be biased. Thus these components could potentially become functional at an earlier age.
As discussed, intrinsic membrane properties tested in the present study change significantly before birth. Because early collections of cells, which are, apparently, the presumptive taste buds, appear at about the time of birth, and taste buds develop postnatally in rat (Mistretta 1972), our data suggest that the prenatal intrinsic membrane properties develop independently of prenatal taste-bud input. Thus it is unlikely that afferent sensory activity derived from stimulation of taste buds per se contributes to embryonic rNST circuit development. Chemosensory stimulation, by amniotic fluid components, of nerve endings in the lingual epithelium of developing papillae is theoretically possible before birth.
Neurons with slowly decaying IKA emerge at a later stage of development, shown in a statistically significant increase in the decay time constant. There may be several reasons for the change; for example, increase in complexity of neural morphology could amplify electrical errors in voltage-clamp recordings. If new IKA channels were inserted in distal sites from the tip of the recording pipette (e.g., dendritic trees), decay time constant for IKA could be overestimated. Emergence of a new channel subunit for IKA may also account for the increase in the decay time constant. Slowly decaying IKA, which is sensitive to 4-AP, and fast-decaying IKA, which is relatively insensitive to 4-AP, have been reported in rNST (Tell and Bradley 1994) and spinal dorsal horn neurons (Ruscheweyh et al. 2004). Our data indicate that fast-decaying IKA emerges earlier than slowly decaying IKA in developing rNST.
Ih is activated by membrane hyperpolarization. A combination of this characteristic with high Rinput at early stages raises a possibility that the effect of Ih on Vm is enhanced in rNST prenatal neurons. In fact, when the amplitude of voltage sag, induced by a 40-pA hyperpolarizing current, was compared directly between neurons at E14/16 and those at P14–20, the amplitude was significantly larger in neurons at E14/16 (18 ± 3 mV vs. 6 ± 2 mV; P < 0.01, Mann-Whitney test) in association with a more hyperpolarized Vm (−126 ± 7 mV vs. −74 ± 2 mV; P < 0.01, Mann-Whitney test). Our data demonstrate that the amplitude of Ih increases during development, but the effect of Ih on the Vm is large in rNST neurons at young stages.
Channels for LVA ICa, IKA, and Ih need membrane hyperpolarization to deactivate LVA ICa and IKA and activate Ih. One possible source of hyperpolarization (inhibitory input) is inhibitory amino acids such as GABA and glycine from interneurons. Several studies have reported that activation of GABA or glycine receptors causes membrane depolarization in developing neural systems (Nakamura et al. 2008; Yamada et al. 2004). The reversal potential of Cl− in rNST neurons is more negative than Vrest as early as P0–7 (Grabauskas and Bradley 2001), suggesting that activation of the GABA or glycine receptor may cause membrane hyperpolarization and induce LVA ICa, IKA, and Ih in the prenatal period.
Significance to development of rNST gustatory circuits.
Neuronal activity is tightly connected with development of neuronal morphology and neural circuits in the visual system (Shatz and Stryker 1988; Sretavan et al. 1988). Influx of Na+ and/or Na+-dependent APs, confirmed by TTX experiments, plays important roles in segregation of afferent projections in the lateral geniculate nucleus (Shatz and Stryker 1988), axonal arborization of projection neurons in the retinogeniculate (Sretavan et al. 1988), and thalamocortical connections (Catalano and Shatz 1998; Herrmann and Shatz 1995). Furthermore, the influx of Ca2+ through LVA Ca2+ channels, confirmed by NiCl2, plays an important role in activity-dependent cell growth/differentiation (Holliday and Spitzer 1993) and neurotransmitter synthesis (Spitzer et al. 1993). In the present experiments, we found that sodium current and LVA ICa are functional in presumptive rNST neurons, suggesting that these ionic currents could be important in the development of rNST and synaptic connections. These currents act as a form of intrinsic (spontaneous) activity in the visual system. We could not detect spontaneous activity in prenatal and early postnatal rNST. Spontaneous neural activity, similar to that demonstrated in the developing visual system, may occur at an earlier stage, and/or a less-invasive recording method, such as Ca2+ imaging, may be required to preserve native cellular function.
Gustatory information is encoded by a spiking pattern (rate, interspike interval, and synchronicity of spikes) in rNST neurons (reviewed in Hallock and Di Lorenzo 2006). In adult rNST neurons, IKA modulates the patterns of stimulus-driven, repetitive firing (Suwabe and Bradley 2009; Tell and Bradley 1994). Thus IKA would play an important role in gustatory information processing in adult rNST. In the present study, most excitable neurons in rNST fired only one AP in response to depolarizing current injections at E14/16. The basic peripheral gustatory system (i.e., taste buds or synaptic connections between nerve fibers and presumptive taste-bud epithelium) is not established at this age (Mbiene and Farbman 1993; Mbiene and Mistretta 1997). IKA, therefore, is not likely to contribute to gustatory information processing in the early rNST. It has been reported that neural progenitor cells in a rat subventricular zone express IKA prior to the differentiation to neurons, suggesting that IKA supports proliferation of the cells (Smith et al. 2008). IKA may play the same role in the germinal zone for rNST during neurogenesis and later contribute to modulation of gustatory information in rNST. The present work revealed that the amplitude of IKA increases, and the decay becomes slower during development.
The existence of Ih has been reported in adult rNST neurons (Suwabe and Bradley 2009; Tell and Bradley 1994; Uteshev and Smith 2006). We found that almost all neurons (96%) exhibited Ih at E18/20, and there was a trend for the incidence of this current to decrease postnatally. In adult rat rNST, Ih has been reported in only 26% of neurons (Uteshev and Smith 2006). These data suggest that Ih plays an important role in the developing rNST. Numerous studies have reported that Ih sets Vrest, influences the rhythmicity of AP firing, and regulates neuronal excitability (reviewed in Bender and Baram 2008). While the present study could not determine the role of Ih in developing rNST neurons, it is possible that it may regulate the LVA–ICa-induced membrane excitation by reduction of Rinput, which decreases Ca2+ influx.
In conclusion, voltage-gated channels emerge and become functional in rNST neurons before synaptic connections with ST fibers. Thus currents through the channels would contribute to initial establishment of neural circuits. Development of the channels would change the electrophysiological properties of the currents and influence modulation of afferent inputs in rNST neurons.
GRANTS
Support for this study was provided by National Institute on Deafness and Other Communication Disorders, Grant Number DC009982.
DISCLOSURES
No conflicts of interest, financial or otherwise, are declared by the author(s).
AUTHOR CONTRIBUTIONS
Author contributions: R.M.B. conception and design of research; T.S. performed experiments; T.S. analyzed data; T.S., C.M.M., and R.M.B. interpreted results of experiments; T.S. prepared figures; T.S. drafted manuscript; T.S., C.M.M., C.K., and R.M.B. edited and revised manuscript; R.M.B. approved final version of manuscript.
ACKNOWLEDGMENTS
Present address of T. Suwabe: Department of Physiology, Osaka Dental University, Hirakata, Osaka 573-1121, Japan.
REFERENCES
- Aghajanian GK, Rasmussen K. Intracellular studies in the facial nucleus illustrating a simple new method for obtaining viable motoneurons in adult rat brain slices. Synapse 3: 331–338, 1989 [DOI] [PubMed] [Google Scholar]
- Altman J, Bayer SA. Development of the brain stem in the rat. I. Thymidine-radiographic study of the time of origin of neurons of the lower medulla. J Comp Neurol 194: 1–35, 1980 [DOI] [PubMed] [Google Scholar]
- Altman J, Bayer SA. Development of the cranial nerve ganglia and related nuclei in the rat. Adv Anat Embryol Cell Biol 74: 1–90, 1982 [DOI] [PubMed] [Google Scholar]
- Bao H, Bradley RM, Mistretta CM. Development of intrinsic electrophysiological properties in neurons from the gustatory region of rat nucleus of solitary tract. Dev Brain Res 86: 143–154, 1995 [DOI] [PubMed] [Google Scholar]
- Bender RA, Baram TZ. Hyperpolarization activated cyclic-nucleotide gated (HCN) channels in developing neuronal networks. Prog Neurobiol 86: 129–140, 2008 [DOI] [PMC free article] [PubMed] [Google Scholar]
- Catalano SM, Shatz CJ. Activity-dependent cortical target selection by thalamic axons. Science 281: 559–562, 1998 [DOI] [PubMed] [Google Scholar]
- Grabauskas G, Bradley RM. Postnatal development of inhibitory synapatic transmission in the rostral nucleus of the solitary tract. J Neurophysiol 85: 2203–2212, 2001 [DOI] [PubMed] [Google Scholar]
- Guido W, Günhan-Agar E, Erzurumlu RS. Developmental changes in the electrophysiological properties of brain stem trigeminal neurons during pattern (barrelette) formation. J Neurophysiol 79: 1295–1306, 1998 [DOI] [PubMed] [Google Scholar]
- Hallock RM, Di Lorenzo PM. Temporal coding in the gustatory system. Neurosci Biobehav Rev 30: 1145–1160, 2006 [DOI] [PubMed] [Google Scholar]
- Herrmann K, Shatz CJ. Blockade of action potential activity alters initial arborization of thalamic axons within cortical layer 4. Proc Natl Acad Sci USA 92: 11244–11248, 1995 [DOI] [PMC free article] [PubMed] [Google Scholar]
- Hill DL, Bradley RM, Mistretta CM. Development of taste responses in rat nucleus of solitary tract. J Neurophysiol 50: 879–895, 1983 [DOI] [PubMed] [Google Scholar]
- Hill DL, May OL. Development and plasticity of the gustatory portion of nucleus of the solitary tract. In: The Role of the Nucleus of the Solitary Tract in Gustatory Processing, edited by Bradley RM. Boca Raton, FL: CRC, 2006, p. 108–135 [PubMed] [Google Scholar]
- Hille B. Ion Channels of Excitable Membranes. Sunderland, MA: Sinauer Associates, 2001 [Google Scholar]
- Holliday J, Spitzer NC. Calcium regulates neuronal differentiation both directly and via co-cultured myocytes. J Neurobiol 24: 506–514, 1993 [DOI] [PubMed] [Google Scholar]
- Johanson IB, Shapiro EG. Intake and behavioral responsiveness to taste stimuli in infant rats from 1 to 15 days of age. Dev Psychobiol 19: 593–606, 1986 [DOI] [PubMed] [Google Scholar]
- Krimm RF, Hill DL. Early prenatal critical period for chorda tympani nerve terminal field development. J Comp Neurol 378: 254–264, 1997 [PubMed] [Google Scholar]
- Lasiter PS. Postnatal development of gustatory recipient zones within the nucleus of the solitary tract. Brain Res Bull 28: 667–677, 1992 [DOI] [PubMed] [Google Scholar]
- Lasiter PS, Wong DM, Kachele DL. Postnatal development of the rostral solitary nucleus in rat: dendritic morphology and mitochondrial enzyme activity. Brain Res Bull 22: 313–321, 1989 [DOI] [PubMed] [Google Scholar]
- Mangold JE, Hill DL. Extensive reorganization of primary afferent projections into gustatory brainstem induced by feeding a sodium restricted diet during development: less is more. J Neurosci 27: 4650–4662, 2007 [DOI] [PMC free article] [PubMed] [Google Scholar]
- May OL, Erisir A, Hill DL. Ultrastructure of primary afferent terminals and synapses in the rat nucleus of the solitary tract: comparison among the greater superficial petrosal, chorda tympani, and glossopharyngeal nerves. J Comp Neurol 502: 1066–1078, 2007 [DOI] [PMC free article] [PubMed] [Google Scholar]
- May OL, Hill DL. Gustatory terminal field organization and developmental plasticity in the nucleus of the solitary tract revealed through triple-fluorescence labeling. J Comp Neurol 497: 658–669, 2006 [DOI] [PMC free article] [PubMed] [Google Scholar]
- Mbiene JP, Farbman AI. Evidence for stimulus access to taste cells and nerves during development: an electron microscopic study. Microsc Res Tech 26: 94–105, 1993 [DOI] [PubMed] [Google Scholar]
- Mbiene JP, Mistretta CM. Initial innervation of embryonic rat tongue and developing taste papillae: nerves follow distinctive and spatially restricted pathways. Acta Anat (Basel) 160: 139–158, 1997 [DOI] [PubMed] [Google Scholar]
- Mistretta CM. Topographical and histological study of the developing rat tongue palate and taste buds. In: Third Symposium on Oral Sensation and Perception: The Mouth of the Infant, edited by Bosma JF. Springfield, IL: Charles C. Thomas, 1972, p. 163–187 [Google Scholar]
- Moe KE. The ontogeny of salt preference in rats. Dev Psychobiol 19: 185–196, 1986 [DOI] [PubMed] [Google Scholar]
- Nakamura S, Inoue T, Nakajima K, Moritani M, Nakayama K, Tokita K, Yoshida A, Maki K. Synaptic transmission from the supratrigeminal region to jaw-closing and jaw-opening motoneurons in developing rats. J Neurophysiol 100: 1885–1896, 2008 [DOI] [PubMed] [Google Scholar]
- Perez-Reyes E. Molecular physiology of low-voltage-activated T-type calcium channels. Physiol Rev 83: 117–161, 2003 [DOI] [PubMed] [Google Scholar]
- Rakic P, Cameron RS, Kumuro H. Recognition, adhesion, trans-membrane signaling and cell motility in guided neuronal migration. Curr Opin Neurobiol 4: 63–69, 1994 [DOI] [PubMed] [Google Scholar]
- Ruscheweyh R, Ikeda H, Heinke B, Sandkuhler J. Distinctive membrane and discharge properties of rat spinal lamina I projection neurones in vitro. J Physiol 555: 527–543, 2004 [DOI] [PMC free article] [PubMed] [Google Scholar]
- Shatz CJ, Stryker MP. Prenatal tetrodotoxin infusion blocks segregation of retinogeniculate afferents. Science 242: 87–89, 1988 [DOI] [PubMed] [Google Scholar]
- Smith DO, Rosenheimer JL, Kalil RE. Delayed rectifier and A-type potassium channels associated with Kv 2.1 and Kv 43 expression in embryonic rat neural progenitor cells. PLoS One 2: 1–9, 2008 [DOI] [PMC free article] [PubMed] [Google Scholar]
- Sollars SI, Walker BR, Thaw AK, Hill DL. Age-related decrease of the chorda tympani nerve terminal field in the nucleus of the solitary tract is prevented by dietary sodium restriction during development. Neuroscience 13: 1229–1236, 2006 [DOI] [PMC free article] [PubMed] [Google Scholar]
- Spitzer N, Gu X, Olson E. Action potentials, calcium transients and the control of differentiation of excitable cells. Curr Opin Neurobiol 4: 70–77, 1994 [DOI] [PubMed] [Google Scholar]
- Spitzer NC. A developmental handshake: neuronal control of ionic currents and their control of neuronal differentiation. J Neurobiol 22: 659–673, 1991 [DOI] [PubMed] [Google Scholar]
- Spitzer NC, Debaca RC, Allen KA, Holliday J. Calcium dependence of differentiation of GABA immunoreactivity in spinal neurons. J Comp Neurol 337: 168–175, 1993 [DOI] [PubMed] [Google Scholar]
- Sretavan DW, Shatz CJ, Stryker MP. Modification of retinal ganglion cell axon morphology by prenatal infusion of tetrodotoxin. Nature 336: 468–471, 1988 [DOI] [PubMed] [Google Scholar]
- Suwabe T, Bradley RM. Characteristics of rostral solitary tract nucleus neurons with identified afferent connections that project to the parabrachial nucleus in rats. J Neurophysiol 102: 546–555, 2009 [DOI] [PMC free article] [PubMed] [Google Scholar]
- Tell F, Bradley RM. Whole-cell analysis of ionic currents underlying the firing pattern of neurons in the gustatory zone of the nucleus tractus solitarii. J Neurophysiol 71: 479–492, 1994 [DOI] [PubMed] [Google Scholar]
- Tsukamoto G, Mistretta CM, Bradley RM. Development of geniculate ganglion projections and associated neurons in the medulla of embryonic rat: establishing the solitary tract and nucleus. Abstr Soc Neurosci, 2005 [Google Scholar]
- Uteshev VV, Smith DV. Cholinergic modulation of neurons in the gustatory region of the nucleus of the solitary tract. Brain Res 1084: 38–53, 2006 [DOI] [PubMed] [Google Scholar]
- Vogt MB, Hill DL. Enduring alterations in neurophysiological taste responses after early dietary sodium deprivation. J Neurophysiol 69: 832–841, 1993 [DOI] [PubMed] [Google Scholar]
- Yamada J, Okaba A, Toyoda H, Kilb W, Luhmann HJ, Fukuda A. Cl− uptake promoting depolarizing GABA actions in immature rat neocortical neurons is mediated by NKCC1. J Physiol 557: 829–841, 2004 [DOI] [PMC free article] [PubMed] [Google Scholar]
- Zhang LL, Ashwell KWS. Development of the cyto- and chemoarchitectural organization of the rat nucleus of the solitary tract. Anat Embryol (Berl) 203: 265–282, 2001a [DOI] [PubMed] [Google Scholar]
- Zhang LL, Ashwell KWS. The development of cranial nerve and visceral afferents to the nucleus of the solitary tract in the rat. Anat Embryol (Berl) 204: 135–151, 2001b [DOI] [PubMed] [Google Scholar]


