

Abstract
BACKGROUND:
Adiponectin is an adipocyte secreted protein with important biological functions Hypoadiponectinemia is associated with obesity, insulin resistance, and type II diabetes This study aimed to evaluate serum adiponectin level in obese subjects with type II diabetes and its correlation with metabolic parameters
METHODS:
This cross-sectional study was performed on 40 obese subjects with type II diabetes and 40 non-diabetic obese control subjects Fasting lipid profile was measured by the enzymatic methods The NycoCard HbA1c protocol was used to measure HbAlc The Serum adiponectin, insulin and glucose levels were measured using an enzyme immunoassay and glucose oxidase methods respectively
RESULTS:
Type II diabetes was associated with hypoadiponectinemia, in both men and women Serum adiponectin level in non-diabetic subjects (6.44 ± 2.47 μg/ml) was significantly higher than diabetics (4.55 ± 1.88 μg/ml) Furthermore, serum adiponectin concentration in females was significantly higher than males in non-diabetics (7.18 ± 2.68 vs 5.61 ± 0.57) and diabetic groups (5.18 ± 2.08 vs 3.99 ± 1.5) There was a negative and significant correlation between serum adiponectin level with waist (r = -0.451, p = 0.003), waist to hip ratio (r = -0.404, p = 0.01) and BMI (r = - 0.322, p = 0.042) and a positive correlation with HDL (r = 0.337, p = 0.034) in non-diabetic group In diabetic group, there was only found a negative correlation between adiponectin and waist size (r = -0.317, p = 0.046)
CONCLUSIONS:
Obesity and type II diabetes are associated with low serum adiponectin concentration
Keywords: Adiponectin, Type II diabetes, Obese, BMI
Obesity and its association with type II diabetes are two major health problems in all the nations. Type II diabetes mellitus (T2DM) is results from defects in insulin action and insulin secretion.1 Azizi reported diabetes prevalence as 3.5 million adults in Iran,2 which approximately is estimated to be increased to 5.1 million by 2025.3 Although, overweight and obesity are well-recognized risk factors for type II diabetes and depending upon the ethnic background, from 50-80% of patients with diabetes in the world are obese.4 However, the pathophysiology linking obesity to type II diabetes is not completely understood, but adiopcytokines are thought to be involved.5
Nowadays, adipose tissue considered as an endocrine organ that synthesizes and secretes an even increasing number of bioactive molecules which are collectively named “Adipokines or Adipocytokines”. Adiponectin is a novel adipocytokine produced exclusively and abundantly by adipocyte and exists in relatively high concentrations in human serum, and counting for up to 0.05% of total serum protein.6 Serum adiponectin levels are decreased in obesity7 insulin resistance8 T2DM9,10 and dyslipidemia11 and are particularly low in patients with coronary artery disease.12,13 Plasma concentrations of adiponectin have been positively associated with age and have generally been shown sex dimorphism i.e. higher in women than men14. It has been proposed that adiponectin may be a link between markers of inflammation, endothelial dysfunction, obesity and risk factors of type II diabetes mellitus.15
Due to interactions of genetic factors including single nucleotide polymorphisms (SNPs) of adiponectin gene and environmental factors, hypoadiponectinemia causes obesity, resulting in insulin resistance, metabolic syndrome and increasing the risk of type II diabetes mellitus.16 Furthermore, hypoadiponectinemia may be a novel and important risk factor for coronary heart disease (CHD) and hypertension.17,18 Adiponectin concentration has been shown negatively associated with plasma triglyceride, low-density lipoprotein-cholestrol (LDL)14,19 and positively associated with high-density lipoprotein (HDL) cholesterol.14,19 Considring that other studies have reported differences in adiponectin levels between diabetic and non-diabetic subjects, this study aimed to investigate serum adiponectin level in obese subjects with type II diabetes and its correlation with anthropometric and metabolic parameters in men and women separately.
Methods
Study Samples
Forty middle-aged obese Iranian individuals with type II diabetes (19 females and 21 males, aged 44.80 ± 6.04 years, body mass index (BMI) 34.15 ± 3.89 kg/m2), who consecutively visited the outpatient clinics for diabetes mellitus in Sina University Hospital from September 2008 to January 2009, were enrolled for the present study. Past medical history and clinical data were collected by trained medical worker of the hospital who was supervised by Dr. Amir Bahrami. Anthropometric indices including height, weight, hip and waist circumference were taken while subjects were in the standing position and wearing light clothing without shoes. Body weight was measured in kilogram nearest to 0.5 kg. Height was measured in centimeter nearest to 0.5 cm. The waist circumference was taken to the smallest standing horizontal circumference between the lower rib cage and the iliac crest; the hip circumference was taken as the largest standing horizontal circumference of the buttocks. These parameters were measured by well-trained dietitians. Waist-hip ratio (WHR) was calculated as waist circumference divided by hip circumference. Blood pressure was measured using random mercury sphygmomanometer. Average of two consecutive readings taken 10 min separately was recorded. The subjects underwent a detailed examination by the medical office to assess the health status. The study was reviewed and approved by the institutional Ethics Committee of Tabriz University of Medical Sciences and written informed consent was obtained from all of the subjects after the procedure had been explained to them.
Study Design
A venous blood sample (5ml) was drawn from all of the subjects who referred after 12-hour overnight fasting. Type II diabetes was defined based on history of patients taking oral hypoglycemic drugs or according to the last American Diabetes Association's classification in which diabetes is defined as a fasting glucose of more than 126 mg/dl.20 The diabetic patients were treated with oral hypoglycemic agents (metformin, n=30; glibenclamide; n=ll). No patients had received insulin therapy. None of the subjects had significant renal, hepatic or cardiovascular diseases. The duration of diabetes was 1 to 5years (mean, 2.80 ± 2.34 years). Patients did not consume alcohol or perform heavy exercises for at least 1 week before the study.
The non-diabetic control group consisted of 40 middle-aged non-diabetic obese individuals (21 women and 19 men; aged 43.02 ± 9.00 years; (BMI) 35.25 ± 4.10 kg/m2) who had received an annual health check-up. To select the non-diabetic control individuals, the following criteria were used: 1) No diabetes in their first degree relatives. 2) Fasting plasma glucose concentration less than 110mg/dl. 3) Hemoglobin A1C concentration less than 5.8%. Non-diabetic subjects with endocrine disease, significant renal or hepatic diseases, and those receiving medications that control glucose metabolism, hypertension or hyperlipidemia, were excluded from the study.
Biochemical Analysis
Plasma glucose was measured by the glucose oxidase method. Total cholesterol, triglycerides and high-density lipoprotein-Cholesterol (HDL-C) were also measured. Low-density lipoprotein-Cholesterol (LDL-C) was estimated indirectly using the Friedewald formula for subjects with a serum TG concentration of less than 400 mg/ml. Fasting serum insulin was measured by enzyme immunoassay using human ELISA kit (Q-1-DiaPlus, USA) after the serum samples were thawed at room temperature. This assay had a sensitivity margin of 0.5 μIU/ml. Intra and inter-assay coefficients of variation were 6.45 and 6.45%, respectively. Hemoglobin Aie was measured according to boronate affinity assay by Nyco-Card HbAlc protocol (Norway, with the coefficient of variation (CV) below 5%) from whole blood immediately after obtaining the samples. According to the percentage of HbAlc, diabetic group was sub grouped into the well controlled (the patients who had HbAlc below 8%, n = 25) and poorly controlled (the patients who had HbAlc above 8%, n = 15). Serum adiponectin concentration was measured by enzyme-linked-immuno sorbent assay (ELISA), using a commercially available kit, Human adiponectin ELISA kit (Bio Vendor Laboratory Medicine, Inc, GmbH) using specific human adiponectin antibody. The intra-assay and inter-assay coefficients of variation were 4.4 and 5.7, respectively. Before the assay, quality controls and all sera were diluted 300 times with dilution buffer, preferably in two steps.
Calculations and Data Analysis
Body mass index (BMI) was calculated as weight (kilogram) divided by height squared (in square meters). Body fat content was calculated according to the method of Lean et al21 which have been shown to correlate very well with the percentage of body fat measured by underwater weighting13 using the following formula:
Body fat % (men) = [(0.567 × waist circumference in cm) + (0.101 × age in years)] - 31.8 Body fat % (women) = [(0.438 × waist circumference in cm) + (0.221 × age in years)] - 9.4 Serum adiponectin levels have been correlated to body fat percent calculated by this formula.22 Insulin resistance and □ cell function were derived using the HOMA method23 throuhg the following formulae:
Insulin resistance (HOMA-IR) = [fasting insulin (□IU/ml) × fasting glucose (mmol/1) / 22.5]
□ cell function (HOMA-β %) = [20 × fasting insulin (□/ml) / fasting glucose (mmol/1) - 3.5]
Insulin sensitivity was estimated using the quantitative insulin sensitivity check iondex (QUICKI) determined based on the following equation:
QUICKI= 1/ [log insulin (μIU/ml) + log glucose (mg/dl)].24
Low QUICKI indicates low insulin sensitivity, while high QUICKI indicates high insulin sensitivity.
Statistical Analysis
All continuous data were expressed as Mean ± SD. Data analysis were performed using Software SPSS for windows version 14. Group means were compared using one way ANOVA or unpaired t-test. Univariate and linear regression analysis were done for determining the relationship between serum adiponectin and other variables and Pearson Correlation Coefficient was obtained.
Data were also analyzed by stepwise linear regression using adiponectin as the dependent variable. Independent variables including BMI, body fat percent, insulin, hip, fasting glucose, HOMA-BF, HOMA-IR and waist were forced into the model. For all statically assessments, a value of p < 0.05 was statistically accepted as significant.
Results
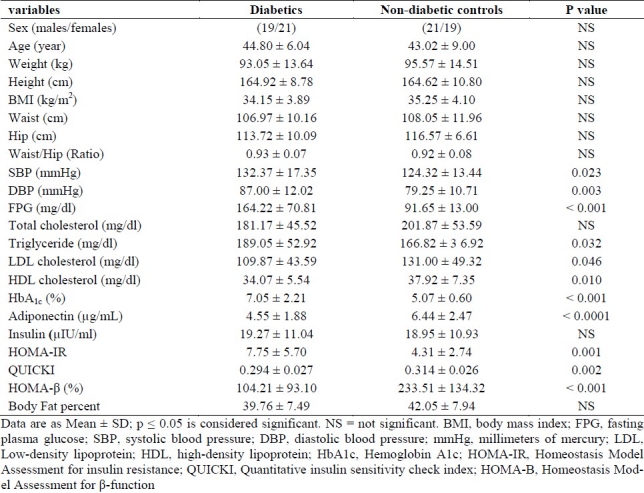
Table 1 summarized the anthropometric, metabolic and clinical characteristics of non-diabetics and type II diabetes mellitus subjects. The mean age of diabetic group was 44.80 ± 6.04 years and non-diabetic group was 43.02 ± 9.00 years. The mean of BMI for diabetic and no-diabetic groups was 34.15 ± 3.89 kg/m2 and 35.25 ± 4.10 kg/m2, respectively (p > 0.05). When we compared diabetic and no-diabetic groups regarding age, BMI, height, weight, WHR, waist, total cholesterol and insulin, no difference was observed (Table 1). However, the mean concentration of HDL-C, adiponectin, HOMA-□ percent and QUICKI index in control group were significantly higher than diabetic group (p < 0.05). On the other hand, the mean concentrations of fasting blood glucose, triglyceride, LDL-C, HbAlc, systolic and diastolic blood pressure and HOMA-IR index in diabetic group was significantly higher than control group (p < 0.05)(Table 1).
Table 1.
Anthropometric and metabolic parameters of diabetic and non-diabetic groups
In all of the study subjects, mean basal adiponectin concentration was 5.49 ± 2.38 (range 2.10-14.01 μg/ml). Mean (±SD) serum adiponectin concentration was significantly lower in subjects with T2DM compare to non-diabetic control group (4.55 ± 1.88 vs. 6.44 ± 2.47 (μg/ml) (P < 0.0001). This was observed both in males (p = 0.006) and females (p = 0.013) of subjects with type II diabetes compare to males and females in the control group.
Serum adiponectin levels of non-diabetic control subjects ranged from 3.18 to 14.01 □g/ml. Men had a mean serum adiponectin level of 4.76 ± 1.91 μg/ml (Table 1). Despite no difference in mean BMI (all the females, 35.29 ± 4.23 kg/m2; all the males, 34.11 ± 3.74 kg/m2) mean plasma concentrations of women were almost 1.5 compared with men (all the females, 6.23 ± 2.59 (μg/ml ;all the males, 4.76 ± 1.91 μg/ml). Moreover, in sex adjusted analysis, the mean concentration of serum adiponectin in diabetic group (5.18 ± 2.08 vs. 3.99 ± 1.570 μg/ml) and non-diabetic group (7.18 ± 2.68 vs. 5.61 ± 0.57 μg/ml) females was significantly higher than males in the both groups (p < 0.05). This increase in women was also seen when the levels were normalized based on BMI When expressed in terms of adiponectin / BF percent, the increase in women was less pronounced (1.07-times that of men compared to 1.28-times seen in adiponectin / BMI).
We have calculated body fat content (%) based on the method of Lean et al using the formula involving age and waist circumference. The body fat percent of non-diabetic and diabetic subjects was 42.05 ± 7.94% and 39.76 ± 7.49%, respectively. Body fat percent of women was about 1.5-times higher than that of men in diabetic and non-diabetic groups. As expected, HOMA calculations showed that type II diabetic subjects had a significant increase in insulin resistance (p = 0.001, age and BMI adjusted data) and impaired □ cell function (p < 0.001). Furthermore, HOMA-□ cell function was lower in the poorly-controlled diabetic (68.54 ± 41.46) than well-controlled (125.61 ± 74.50) subgroup (P = 0.05). It was suggested that this subgroup had a more severe deterioration of their □ cell function than the other subgroup. HOMA-□ cell function was also lower in male compared to female in diabetic group (85.03 ± 42.65 vs. 126.19 ± 87.23).
Figure 1. (A) Represents the relationship between serum adiponectin levels and HDL-C in all the study subjects. Adiponectin was positively correlated with HDL-C (r = 0.385, p = 0.001) in all the subjects including males (r = 0.379; p =0.016) and females (r = 0.412; p = 0.002). On the other hand, adiponectin was negatively correlated with waist-hip ratio(r = -0.338; p = 0.002) only in the total subjects as represented in figure 1 (B). Adiponectin showed a correlation with waist circumference only in females (r = -0.455; p = 0.002) as seen in Figure 1 (C).
Figure 1.
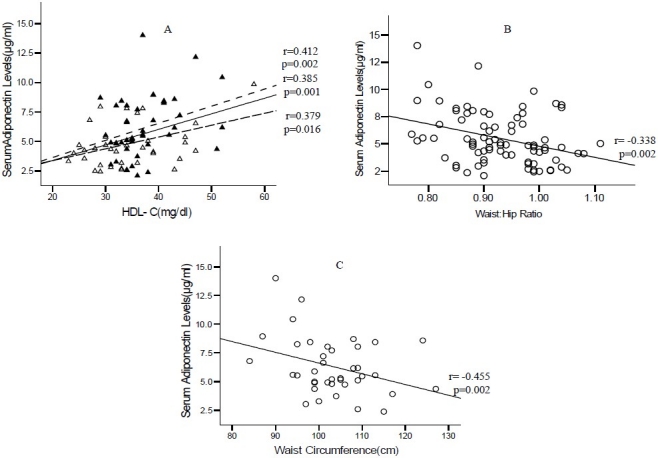
A. Relationship between serum adiponectin levels and HDL-C. Fasting serum adiponectin levels of normal women (filled triangles) upper dashed line andnormal men (empty triangles), lower dashed line and total subjects middle solid line, were plotted against HDL-C. The "r" values represent correlation coefficient in linear regression analysis. B. Relationship between serum adiponectin levels and waist to hip ratio in all subjects. C. Relationship between serum adiponectin levels and waist circumference in women.
Serum adiponectin levels of women were reduced approximately as 50% in poorly-controlled diabetics (from 7.18 ± 2.68 to 3.95. ± 1.69 μg/ml, p = 0.010). Among the males, serum adiponectin levels were lower as 50% (from 5.61 ± 1.96 to 2.90 ± 0.63 μg/mL p = 0.001) in poorly-controlled diabetics men compared to non-diabetic control males. There was no significant change in serum adiponectin in well-controlled diabetic women and men compared to non-diabetic control subjects.
Figure 2 represents data on serum adiponectin levels normalized to BMI. Serum adiponectin exhibited approximately 40% reduction in poorly-controlled diabetic women (from 0.21 ± 0.09 to 0.12 ± 0.04 μg/unit BMI; p < 0.001) compared to normal women; while there was no significant change in well-controlled diabetic men. In the males, serum adiponectin levels were lower as 50% in poorly-controlled group (from 0.16 ± 0.06 to 0.09 ± 0.03 μg/unit BMI).
Figure 2.
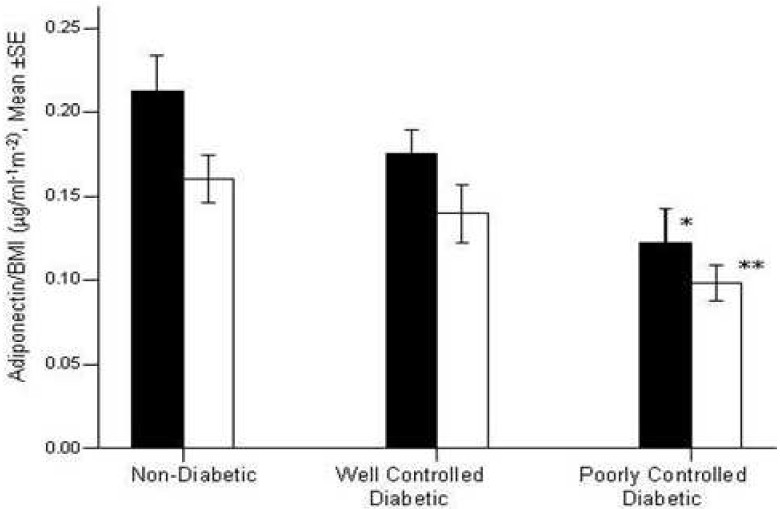
Serum Adiponectin levels normalized to BMI in the all subjects. Adiponectin levels were represented for men (empty bar) and for women (filled bar). Adiponectin levels were significantly reduced in well (p=0.02) and poorly controlled diabetic compared to control group, (p<00001). Among women, adiponectin levels were significantly reduced in poorly controlled diabetic compared to control women (*p=0.010). Among men adiponectin levels normalized to BMI were significantly reduced in poorly controlled diabetic compared to control men (**p=0.001). “in all the subjects”-“level” “(p = 0.001)”
In univariate analysis using adiponectin as the dependent variable in total study subjects, HbAlc, gender, glucose, waist size, waist-hip ratio, DBP, HbAlc, TG, HDL-C and QUICKI predicted the variability in adiponectin significantly (P < 0. 05). In total number of the subjects (80), simple linear regression analysis yielded highest correlation of serum adiponectin to HDL-C (r = 0.375; p = 0.001), waist circumference (r = -0.345; r = 0. 001) and lastly to HbAlc (r = -0.245; p = 0.028). In the diabetic subjects gender (r = -0.399; p = 0.011) and waist (r = -0.317; p = 0.046) was related to adiponectin. On the other hand, in non-diabetic subjects, HDL-C (r= 0.337; p=0.034) and QUICKI (r = 0.312; p = 0.05) were related to adiponectin in addition to waist (r = -0.451; p=0.003) and gender, (r = -0.320; p = 0.044). Therefore, the main differences due to diabetic status were not a significant relationship between adiponectin and good profile lipid (HDL-C and OUICKI). Thus, serum adiponectin levels negatively dependent upon gender and waist size as a central obesity factor in the two groups. These results suggested that adiponectin levels of non-diabetics were influenced differently from the diabetic groups. In non-diabetic group, adiponectin levels were partly contributed by increased HDL-C and QUICKI as an insulin sensitivity marker.
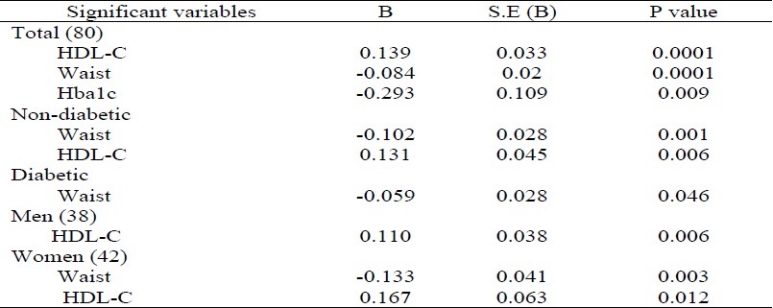
Table 2 represents the results of linear regression analysis carried out using serum adiponectin as the dependent variable. In this analysis, only those variables were considered which had a significant correlation in the linear regression analysis. In all the total subjects, serum adiponectin levels were contributed by HDL-C, waist size and HbAlc. In addition, in non-diabetic subjects, HDL-C and waist were the predictor of adiponectin levels. On the other hand, in diabetic subjects, serum adiponectin levels were also predicted by waist size. Gender-specific regression analysis revealed that in women, changes in adiponectin levels were explained by waist (r = -0.455; p=0.002) and HDL-C (r = 0.412; p = 0.002) while in men, adiponectin levels were explained only by HDL-C (r = 0.379; p = 0.016). These results suggested that men's adiponectin levels were influenced differently from women. In women, adiponectin levels were partly contributed by increased waist circumference, an indicator of abdominal obesity, which in turn influenced adiponectin levels. This was a novel finding in our study.
Table 2.
Linear regression analysis using adiponectin as the dependent variable
Discussion
While other studies have reported differences in leptin and adiponectin levels between diabetic and non-diabetic subjects25,26 we decided to investigate the difference in adiponectin levels in obese diabetic and non-diabetic subjects matched for age, gender, and BML There was a significant difference in serum adiponectin concentrations according to gender and presence of diabetes. Gender differences in leptin levels were well recognized;26 however, a few studies (not all of them) have re-ported gender differences in adiponectin leVels.27,28
This study revealed two important findings. First; it confirmed previous findings that obesity and type II diabetes were associated with low serum adiponectin concentrations. Second, our results showed that the serum adiponectin concentration was more closely related to obesity than to insulin sensitivity and fasting insulinemia, which suggested that hypoadiponectinemia in subjects with obesity and type II diabetes was in at least attributable to obesity indices. Furthermore, our data showed that, in addition to overall obesity, central obesity was an independent negative predictor of serum adiponectin and suggested that adiponectin may represent a link between central obesity and type II diabetes
Adiposity (BMI, lipid mass, percentage of fat) has been previously reported to be inversely associated with serum adiponectin in Japanese,28–30 Pima Indians25,31 and Caucasians.14,25 The etiology of the decreased adiponectin mRNA expression in adipose tissue26,32 and the lower serum adiponectin levels had been reported in obese subjects25 is not completely understood. However, adipose tissue-derived cytokines have been suggested that negatively regulate adiponectin synthesis and release. In particular, TNF-α and interleukin-6 have been shown to reduce adiponectin mRNA content and inhibit adiponectin release in 3T3-L1 cells.33,34 Another possibility is a reduction in metabolic function of the adipocyte as it ages or hypertrophies. For example, aged 3T3L1 cells contain more triglycerides and are not only more insulin resistant, but also have decreased adiponectin gene expression compared to young adipocytes.35
In addition to confirming the association between some of the obesity indices and adiponectin, we found that central obesity was an independent negative predictor of serum adiponectin level. The relationship of adiponectin with WHR, and waist appeared to be stronger than other obesity indices or BMI, indicating that central fat distribution is a better determinant of circulating adiponectin than total fat mass. Similar to our findings, Cnop et al14 have reported recently that intra-abdominal fat (but not BMI) was significantly and independently associated with adiponectin, whereas a Japanese study36 has reported an inverse association between adiponectin and WHR in morbidly obese patients but not in overweight and moderately obese patients.
We confirmed that adiponectin levels are related to triglyceride levels and there was a positive and strong correlation between serum adiponectin and HDL-cholesterol in the two groups, as previously reported in Japanese subjects.18,28 Matsbara et al29 have reported a strong positive correlation between adiponectin and HDL-c independently from visceral AT, explaining 37% of the variance in HDL cholesterol. Our results are also in accordance with the previous study that has shown a strong correlation between plasma adiponectin levels and HDL cholesterol independently of age, gender, BMI, and fasting insulin concentration.37 In that study, adiponectin appeared to predict HDL cholesterol level in patients with type II diabetes, independent from common metabolic risk factors.37 Thus, it is possible that adiponectin, like HDL cholesterol, could eventually be considered as an independent protective cardiovascular risk factor.37 Such a strong correlation between adiponectin and HDL cholesterol levels may likely be explained by the activation of peroxisome proliferator-activated receptor-α which influences the expression of genes encoding for proteins involved in HDL metabolism.36 For instance, adiponectin has been reported to increase peroxisome proliferator-activated receptor-□ ligand activities both in skeletal muscle and liver33 leading to an increased synthesis of HDL cholesterol.
Our observations, regarding the impact of sex, suggested that adiponectin concentration was also related to factors independent of obesity indices. At any obesity indices, adiponectin concentrations are greater in women than in men. Furthermore, in men and women pair-matched for age, and BMI adiponectin concentrations were greater in women in non-diabetic and diabetic groups. Earlier reports have revealed the sexual dimorphism of adiponectin, with females having significantly higher circulating levels of total adiponectin than males in both humans and rodents.27 Xu et al,38 showed that the sexual dimorphism of adiponectin is mainly due to the difference in its HMW (High Molecular Weight) form in both human and rodents, whereas females and males have comparable levels of the MMW (Medium Molecular Weight) and LMW (Low Molecular Weight) forms. In line with this result, the recent study using velocity ultra-centrifugation also observed that the percentage composition of HMW adiponectin in female mice was significantly higher than male mice.39 Clinical studies have found that decreased ratios of HMW/total adiponectin were closely associated with the development of diabetes and cardiovascular diseases.40,41 Given the important role of HMW adiponectin in increasing insulin sensitivity and in preventing atherosclerosis, the sexual difference in HMW adiponectin might partly explain the fact that men have a higher incidence of atherosclerosis and are more susceptible to insulin resistance than women.38 In addition, in line with another study42 in our study, neither HOMA-IR and HOMA-β cell function nor QUICKI were significantly different between males and females in the two groups. In brief, we speculated that low serum adiponectin levels in obese type II diabetes and even lower levels in subjects who had poorly controlled diabetes was likely due to central obesity indices rather than insulin resistance and hyperinsulinemia.
Authors’ Contributions
GM coordinated the study, carried out the design, analyzed the data and prepared the manuscript. NZ provided assistance in the design of the study, coordinated all the experiments and participated in manuscript preparation. All the authors have read and approved the content of the manuscript.
Acknowledgments
This project was supported by the Nutritional Research Center, Tabriz University of Medical Sciences, grant number E222. The authors are grateful to the people located in radio pharmacy lab in Drug Applied Research Center, Tabriz University of Medical Sciences.
Footnotes
Conflict of Interests Authors have no conflict of interests.
References
- 1.Cusi K. The epidemic of type 2 diabetes mellitus: its links to obesity, insulin resistance and lipotoxicity. In: Regensteiner JG, Reusch JE, Stewart KJ, Veves A, editors. Diabetes and Exercise. New York: Springer; 2009. pp. 3–54. [Google Scholar]
- 2.Azizi F. Diabetes care and prevention in Iran. Diabetes Voice. 2005;50(4):15–7. [Google Scholar]
- 3.King H, Aubert RE, Herman WH. Global burden of diabetes, 1995-2025: prevalence, numerical estimates, and projections. Diabetes Care. 1998;21(9):1414–31. doi: 10.2337/diacare.21.9.1414. [DOI] [PubMed] [Google Scholar]
- 4.Ogden CL, Yanovski SZ, Carroll MD, Flegal KM. The epidemiology of obesity. Gastroenterology. 2007;132(6):2087–102. doi: 10.1053/j.gastro.2007.03.052. [DOI] [PubMed] [Google Scholar]
- 5.Cusi K. The role of adipose tissue and lipotoxicity in the pathogenesis of type 2 diabetes. Curr Diab Rep. 2010;10(4):306–15. doi: 10.1007/s11892-010-0122-6. [DOI] [PubMed] [Google Scholar]
- 6.Chandran M, Phillips SA, Ciaraldi T, Henry RR. Adiponectin: more than just another fat cell hormone? Diabetes Care. 2003;26(8):2442–50. doi: 10.2337/diacare.26.8.2442. [DOI] [PubMed] [Google Scholar]
- 7.Kern PA, Di Gregorio GB, Lu T, Rassouli N, Ranganathan G. Adiponectin expression from human adipose tissue: relation to obesity, insulin resistance, and tumor necrosis factor-alpha expression. Diabetes. 2003;52(7):1779–85. doi: 10.2337/diabetes.52.7.1779. [DOI] [PubMed] [Google Scholar]
- 8.Sheng T, Yang K. Adiponectin and its association with insulin resistance and type 2 diabetes. J Genet Genomics. 2008;35(6):321–6. doi: 10.1016/S1673-8527(08)60047-8. [DOI] [PubMed] [Google Scholar]
- 9.Yoon SJ, Lee HS, Lee SW, Yun JE, Kim SY, Cho ER, et al. The association between adiponectin and diabetes in the Korean population. Metabolism. 2008;57(6):853–7. doi: 10.1016/j.metabol.2008.01.031. [DOI] [PubMed] [Google Scholar]
- 10.Jalovaara K, Santaniemi M, Timonen M, Jokelainen J, Kesaniemi YA, Ukkola O, et al. Low serum adiponectin level as a predictor of impaired glucose regulation and type 2 diabetes mellitus in a middle-aged Finnish population. Metabolism. 2008;57(8):1130–4. doi: 10.1016/j.metabol.2008.03.019. [DOI] [PubMed] [Google Scholar]
- 11.Shetty GK, Economides PA, Horton ES, Mantzoros CS, Veves A. Circulating adiponectin and resistin levels in relation to metabolic factors, inflammatory markers, and vascular reactivity in diabetic patients and subjects at risk for diabetes. Diabetes Care. 2004;27(10):2450–7. doi: 10.2337/diacare.27.10.2450. [DOI] [PubMed] [Google Scholar]
- 12.Frystyk J, Berne C, Berglund L, Jensevik K, Flyvbjerg A, Zethelius B. Serum adiponectin is a predictor of coronary heart disease: a population-based 10-year follow-up study in elderly men. J Clin Endocrinol Metab. 2007;92(2):571–6. doi: 10.1210/jc.2006-1067. [DOI] [PubMed] [Google Scholar]
- 13.Sattar N, Wannamethee G, Sarwar N, Tchernova J, Cherry L, Wallace AM, et al. Adiponectin and coronary heart disease: a prospective study and meta-analysis. Circulation. 2006;114(7):623–9. doi: 10.1161/CIRCULATIONAHA.106.618918. [DOI] [PubMed] [Google Scholar]
- 14.Cnop M, Havel PJ, Utzschneider KM, Carr DB, Sinha MK, Boyko EJ, et al. Relationship of adiponectin to body fat distribution, insulin sensitivity and plasma lipoproteins: evidence for independent roles of age and sex. Diabetologia. 2003;46(4):459–69. doi: 10.1007/s00125-003-1074-z. [DOI] [PubMed] [Google Scholar]
- 15.Krakoff J, Funahashi T, Stehouwer CD, Schalkwijk CG, Tanaka S, Matsuzawa Y, et al. Inflammatory markers, adiponectin, and risk of type 2 diabetes in the Pima Indian. Diabetes Care. 2003;26(6):1745–51. doi: 10.2337/diacare.26.6.1745. [DOI] [PubMed] [Google Scholar]
- 16.Kumada M, Kihara S, Sumitsuji S, Kawamoto T, Matsumoto S, Ouchi N, et al. Association of hypoadiponectinemia with coronary artery disease in men. Arterioscler Thromb Vasc Biol. 2003;23(1):85–9. doi: 10.1161/01.atv.0000048856.22331.50. [DOI] [PubMed] [Google Scholar]
- 17.Mallamaci F, Zoccali C, Cuzzola F, Tripepi G, Cutrupi S, Parlongo S, et al. Adiponectin in essential hypertension. J Nephrol. 2002;15(5):507–11. [PubMed] [Google Scholar]
- 18.Matsubara M, Maruoka S, Katayose S. Decreased plasma adiponectin concentrations in women with dyslipidemia. J Clin Endocrinol Metab. 2002;87(6):2764–9. doi: 10.1210/jcem.87.6.8550. [DOI] [PubMed] [Google Scholar]
- 19.Ouchi N, Kihara S, Funahashi T, Nakamura T, Nishida M, Kumada M, et al. Reciprocal association of C-reactive protein with adiponectin in blood stream and adipose tissue. Circulation. 2003;107(5):671–4. doi: 10.1161/01.cir.0000055188.83694.b3. [DOI] [PubMed] [Google Scholar]
- 20.Alberti KG, Zimmet PZ. Definition, diagnosis and classification of diabetes mellitus and its complications.Part 1: diagnosis and classification of diabetes mellitus provisional report of a WHO consultation. Diabet Med. 1998;15(7):539–53. doi: 10.1002/(SICI)1096-9136(199807)15:7<539::AID-DIA668>3.0.CO;2-S. [DOI] [PubMed] [Google Scholar]
- 21.Lean ME, Han TS, Deurenberg P. Predicting body composition by densitometry from simple anthropometric measurements. Am J Clin Nutr. 1996;63(1):4–14. doi: 10.1093/ajcn/63.1.4. [DOI] [PubMed] [Google Scholar]
- 22.Mavri A, Stegnar M, Sabovic M. Do baseline serum leptin levels predict weight regain after dieting in obese women? Diabetes Obes Metab. 2001;3(4):293–6. doi: 10.1046/j.1463-1326.2001.00134.x. [DOI] [PubMed] [Google Scholar]
- 23.Matthews DR, Hosker JP, Rudenski AS, Naylor BA, Treacher DF, Turner RC. Homeostasis model assessment: insulin resistance and beta-cell function from fasting plasma glucose and insulin concentrations in man. Diabetologia. 1985;28(7):412–9. doi: 10.1007/BF00280883. [DOI] [PubMed] [Google Scholar]
- 24.Hrebicek J, Janout V, Malincikova J, Horakova D, Cizek L. Detection of insulin resistance by simple quantitative insulin sensitivity check index QUICKI for epidemiological assessment and prevention. J Clin Endocrinol Metab. 2002;87(1):144–7. doi: 10.1210/jcem.87.1.8292. [DOI] [PubMed] [Google Scholar]
- 25.Weyer C, Funahashi T, Tanaka S, Hotta K, Matsuzawa Y, Pratley RE, et al. Hypoadiponectinemia in obesity and type 2 diabetes: close association with insulin resistance and hyperinsulinemia. J Clin Endocrinol Metab. 2001;86(5):1930–5. doi: 10.1210/jcem.86.5.7463. [DOI] [PubMed] [Google Scholar]
- 26.Fischer S, Hanefeld M, Haffner SM, Fusch C, Schwanebeck U, Kohler C, et al. Insulin-resistant patients with type 2 diabetes mellitus have higher serum leptin levels independently of body fat mass. Acta Diabetol. 2002;39(3):105–10. doi: 10.1007/s005920200027. [DOI] [PubMed] [Google Scholar]
- 27.Nishizawa H, Shimomura I, Kishida K, Maeda N, Kuriyama H, Nagaretani H, et al. Androgens decrease plasma adiponectin, an insulin-sensitizing adipocyte-derived protein. Diabetes. 2002;51(9):2734–41. doi: 10.2337/diabetes.51.9.2734. [DOI] [PubMed] [Google Scholar]
- 28.Yamamoto Y, Hirose H, Saito I, Tomita M, Taniyama M, Matsubara K, et al. Correlation of the adipocyte-derived protein adiponectin with insulin resistance index and serum high-density lipoprotein-cholesterol, independent of body mass index, in the Japanese population. Clin Sci (Lond) 2002;103(2):137–42. doi: 10.1042/cs1030137. [DOI] [PubMed] [Google Scholar]
- 29.Matsubara M, Maruoka S, Katayose S. Inverse relationship between plasma adiponectin and leptin concentrations in normal-weight and obese women. Eur J Endocrinol. 2002;147(2):173–80. doi: 10.1530/eje.0.1470173. [DOI] [PubMed] [Google Scholar]
- 30.Yang WS, Lee WJ, Funahashi T, Tanaka S, Matsuzawa Y, Chao CL, et al. Plasma adiponectin levels in overweight and obese Asians. Obes Res. 2002;10(11):1104–10. doi: 10.1038/oby.2002.150. [DOI] [PubMed] [Google Scholar]
- 31.Lindsay RS, Funahashi T, Hanson RL, Matsuzawa Y, Tanaka S, Tataranni PA, et al. Adiponectin and development of type 2 diabetes in the Pima Indian population. Lancet. 2002;360(9326):57–8. doi: 10.1016/S0140-6736(02)09335-2. [DOI] [PubMed] [Google Scholar]
- 32.Hu E, Liang P, Spiegelman BM. AdipoQ is a novel adipose-specific gene dysregulated in obesity. J Biol Chem. 1996;271(18):10697–703. doi: 10.1074/jbc.271.18.10697. [DOI] [PubMed] [Google Scholar]
- 33.Yu JG, Javorschi S, Hevener AL, Kruszynska YT, Norman RA, Sinha M, et al. The effect of thiazolidinediones on plasma adiponectin levels in normal, obese, and type 2 diabetic subjects. Diabetes. 2002;51(10):2968–74. doi: 10.2337/diabetes.51.10.2968. [DOI] [PubMed] [Google Scholar]
- 34.Fasshauer M, Kralisch S, Klier M, Lossner U, Bluher M, Klein J, et al. Adiponectin gene expression and secretion is inhibited by interleukin-6 in 3T3-L1 adipocytes. Biochem Biophys Res Commun. 2003;301(4):1045–50. doi: 10.1016/s0006-291x(03)00090-1. [DOI] [PubMed] [Google Scholar]
- 35.Yu YH, Zhu H. Chronological changes in metabolism and functions of cultured adipocytes: a hypothesis for cell aging in mature adipocytes. Am J Physiol Endocrinol Metab. 2004;286(3):E402–E410. doi: 10.1152/ajpendo.00247.2003. [DOI] [PubMed] [Google Scholar]
- 36.Statnick MA, Beavers LS, Conner LJ, Corominola H, Johnson D, Hammond CD, et al. Decreased expression of apM1 in omental and subcutaneous adipose tissue of humans with type 2 diabetes. Int J Exp Diabetes Res. 2000;1(2):81–8. doi: 10.1155/EDR.2000.81. [DOI] [PMC free article] [PubMed] [Google Scholar]
- 37.Zietz B, Herfarth H, Paul G, Ehling A, Müller-Ladner U, Scholmerich J, et al. Adiponectin represents an independent cardiovascular risk factor predicting serum HDL-cholesterol levels in type 2 diabetes. Federation of European Biochemical Societies. 2003;545(2):103–4. doi: 10.1016/s0014-5793(03)00568-4. [DOI] [PubMed] [Google Scholar]
- 38.Xu A, Chan KW, Hoo RL, Wang Y, Tan KC, Zhang J, et al. Testosterone selectively reduces the high molecular weight form of adiponectin by inhibiting its secretion from adipocytes. J Biol Chem. 2005;280(18):18073–80. doi: 10.1074/jbc.M414231200. [DOI] [PubMed] [Google Scholar]
- 39.Pajvani UB, Du X, Combs TP, Berg AH, Rajala MW, Schulthess T, et al. Structure-function studies of the adipocyte-secreted hormone Acrp30/adiponectin.Implications fpr metabolic regulation and bioactivity. J Biol Chem. 2003;278(11):9073–85. doi: 10.1074/jbc.M207198200. [DOI] [PubMed] [Google Scholar]
- 40.Pajvani UB, Hawkins M, Combs TP, Rajala MW, Doebber T, Berger JP, et al. Complex distribution, not absolute amount of adiponectin, correlates with thiazolidinedione-mediated improvement in insulin sensitivity. J Biol Chem. 2004;279(13):12152–62. doi: 10.1074/jbc.M311113200. [DOI] [PubMed] [Google Scholar]
- 41.Kobayashi H, Ouchi N, Kihara S, Walsh K, Kumada M, Abe Y, et al. Selective suppression of endothelial cell apoptosis by the high molecular weight form of adiponectin. Circ Res. 2004;94(4):e27–e31. doi: 10.1161/01.RES.0000119921.86460.37. [DOI] [PMC free article] [PubMed] [Google Scholar]
- 42.Frias JP, Macaraeg GB, Ofrecio J, Yu JG, Olefsky JM, Kruszynska YT. Decreased susceptibility to fatty acid-induced peripheral tissue insulin resistance in women. Diabetes. 2001;50(6):1344–50. doi: 10.2337/diabetes.50.6.1344. [DOI] [PubMed] [Google Scholar]