

Abstract
There are no easily obtainable EPR spectral parameters for lipid spin labels that describe profiles of membrane fluidity. The order parameter, which is most often used as a measure of membrane fluidity, describes the amplitude of wobbling motion of alkyl chains relative to the membrane normal and does not contain explicitly time or velocity. Thus, this parameter can be considered as nondynamic. The spin-lattice relaxation rate (T−11) obtained from saturation-recovery EPR measurements of lipid spin labels in deoxygenated samples depends primarily on the rotational correlation time of the nitroxide moiety within the lipid bilayer. Thus, T−11 can be used as a convenient quantitative measure of membrane fluidity that reflects local membrane dynamics. T−11 profiles obtained for 1-palmitoyl-2-(n-doxylstearoyl)phosphatidylcholine (n-PC) spin labels in dimyristoylphosphatidylcholine (DMPC) membranes with and without 50 mol% cholesterol are presented in parallel with profiles of the rotational diffusion coefficient, R⊥, obtained from simulation of EPR spectra using Freed's model. These profiles are compared with profiles of the order parameter obtained directly from EPR spectra and with profiles of the order parameter obtained from simulation of EPR spectra. It is shown that T−11 and R⊥ profiles reveal changes in membrane fluidity that depend on the motional properties of the lipid alkyl chain. We find that cholesterol has a rigidifying effect only to the depth occupied by the rigid steroid ring structure and a fluidizing effect at deeper locations. These effects cannot be differentiated by profiles of the order parameter. All profiles in this study were obtained at X-band (9.5 GHz).
Keywords: Membrane fluidity, Saturation-recovery, Spin-lattice relaxation time, Spin-lattice relaxation rate, Spin labels
1. Introduction
In lipid bilayers, the spin-labeled alkyl chain of 1-palmitoyl-2-(n-doxylstearoyl)phosphatidylcholine (n-PC) spin label or n-doxylstearic acid spin label (n-SASL) (with the nitroxide moiety attached at the Cn position) undergoes rapid anisotropic motion about the long axis of the spin label and also a wobbling motion of the long axis within the confines of a cone imposed by the membrane environment. The anisotropic rotational motion of the spin label gives rise to unique features of the EPR spectra that can be used to calculate the order parameter for the alkyl chain [1,2]. The order parameter is a measure of the amplitude of the wobbling motion of the alkyl chain, with an increase in order parameter indicating a decrease in the angle of the cone. Moreover, as the spin label is moved from the bilayer surface to the membrane interior, deviations in the alkyl-chain-segment direction from the bilayer normal accumulate. Thus, ordering of the alkyl chain close to the membrane surface (induced, for example, by contact with the plate-like portion of cholesterol), also causes an apparent ordering of the distal fragment of the alkyl chain [3]. Although the order parameter indicates an amplitude of wobbling motion of alkyl chains in the lipid bilayer, change in the order parameter is most often described as a change in spin-label mobility, and thus as a change in membrane fluidity. Profiles of the order parameter have been routinely used as a measure of the fluidity of membrane samples [4,5]. With some restrictions, profiles of the dynamic parameter R⊥, which is the rotational diffusion coefficient of the nitroxide moiety around an axis perpendicular to the mean symmetry axis for the rotation, can be also obtained from computer simulation of EPR spectra [6–8].
We propose here an alternative approach in displaying membrane fluidity, namely, profiles of the spin-lattice relaxation rate (T−11). This parameter can be obtained from saturation-recovery (SR) EPR measurements. In deoxygenated samples, this parameter depends primarily on the motion of the nitroxide moiety within the lipid bilayer and thus characterizes the dynamics of the membrane environment at the depth at which the nitroxide moiety is located.
Robinson et al. [9] discuss various mechanisms for spin-lattice relaxation of nitroxide spin labels. For an isotropic rotational correlation time constant, they found good agreement between experiment and a theoretical model that was dominated by the so-called electron-nuclear dipolar (END) mechanism for rotational correlation times from about 10−11 to 10−8 s. In this range, Tend1e ∝ τc, which provides the fundamental basis for the use of the electron spin-lattice relaxation time as a fluidity parameter. In subsequent work, Mailer et al. [10] extended the theoretical framework of Ref. [9] to include anisotropic motion and explicitly considered stearic acid spin labels in lipid bilayers. For data at X-band, fits were not improved. However, for multifrequency T1 data, consideration of anisotropic motion was necessary. Thus, it seems possible that an improved fluidity parameter that reflects anisotropic motion could be developed based on multifrequency saturation recovery measurements.
The T1 values of lipid spin labels (1–10 μs) are much longer than the correlation time for reorientation of the nitroxide group of lipid spin labels as measured using conventional EPR (0.1–10 ns). Because of the short correlation time of different modes of reorientation, motional effects are superimposed and spectral parameters obtained from conventional EPR are affected by these motions in complicated ways. However, because of the long T1 the complicated motional effects should be averaged in SR measurements. Thus, T−11 can be used as a convenient quantitative measure of membrane fluidity that indicates this averaged motion of phospholipid alkyl chains (or nitroxide free radical moieties attached to those chains). If T−11 is measured for n-SASL or n-PC spin labels, a fluidity profile across the lipid bilayer can be obtained that reflects membrane dynamics [11]. In addition, because T−11 can be measured in coexisting membrane domains and membrane phases [12,13], these fluidity profiles can be obtained in coexisting domains and phases without the need for their physical separation.
We previously used SR in dual-probe pulse EPR experiments in which small paramagnetic molecules (e.g., molecular oxygen or paramagnetic metal complexes) were introduced into the membrane and bimolecular collision rates with lipid-analog spin labels determined [14–16]. The rate of bimolecular collision between the nitroxide moiety of a lipid-type spin label placed at a specific location in the membrane and a small paramagnetic probe molecule (like molecular oxygen) is a useful monitor of membrane fluidity that reports on translational diffusion of the small molecule probe, but not on motion of lipid alkyl chains [14]. Those initial experiments were performed at X-band. However, we recently showed that spin-lattice relaxation times of lipid-analog spin labels initially increase when the microwave frequency is increased above X-band, reaching maximum values at Q-band (35 GHz) [17], and then decrease again as the frequency is further increased to W-band (94 GHz) [18,19]. Nonetheless, the observed trend of a decreasing spin-lattice relaxation time for n-SASL or n-PC spin labels with increasing membrane depth was independent of microwave frequency [17,19]. We conclude that the longest values of T1 will generally be found at Q-band, noting that long values are advantageous for measurement of T1-dependent membrane processes. These new capabilities have the potential to be a useful tool for studying membrane dynamics.
In this paper, we present profiles of the spin-lattice relaxation time of phospholipid spin labels for fluid-phase dimyristoylphosphatidylcholine (DMPC) membranes without and with 50 mol% cholesterol obtained at X-band. In parallel, for the same systems, we present profiles of another dynamic parameter—namely, the rotational diffusion coefficient obtained from computer simulation of conventional EPR spectra. We chose the DMPC/cholesterol membranes to demonstrate this new approach for characterizing membrane fluidity because other membrane properties for this system are readily available in the literature, thus allowing our new results to be broadly compared with commonly used parameters.
2. Materials and methods
2.1. Materials
One-palmitoyl-2-(n-doxylstearoyl)phosphatidylcholine(n-PC, n = 5, 7, 10, 12, 14, or 16), dimyristoylphosphatidylcholine (DMPC), and cholesterol were obtained from Avanti Polar Lipids, Inc. (Alabaster, AL). Other chemicals, of at least reagent grade, were purchased from Sigma-Aldrich (St. Louis, MO).
2.2. Sample preparation
The membranes used in this work were multilamellar dispersions of lipids containing 1 mol% n-PC in DMPC or DMPC/cholesterol (1:1 molar ratio), and were prepared as described earlier [20]. The buffer used for measurements was 10 mM PIPES (piperazine-N,N′-bis(2-ethanesulfonic acid) and 150 mM NaCl (pH 7.0). Multilamellar dispersions of lipids were obtained as a loose pellet after centrifugation (12,000g, 15 min, 4 °C) with a final spin-label concentration of 1–3 mM. Structures of the n-PC, together with structures of DMPC and cholesterol, are shown in Fig. 1.
Fig. 1.

Chemical structures of n-PC spin labels, DMPC, and cholesterol. Structures are aligned to illustrate approximate locations of these molecules and nitroxide moieties of spin-labels across the membrane. However, since alkyl chains tend to have many gauche conformations, the chain-length projection to the membrane normal would be shorter than depicted here and the rigid structure of cholesterol would sink somewhat differently in the fluid phase membranes.
2.3. EPR measurements
For EPR measurements, samples were transferred to a capillary made from the gas-permeable methylpenetene plastic, TPX (i.d. 0.6 mm). Samples were equilibrated directly in the resonator with a continuous flow of nitrogen, which was also used for temperature control [21]. All EPR measurements were performed at 27 °C for deoxygenated fluid-phase DMPC membranes, well above the main phase transition of the pure DMPC membranes (phase transition temperature, Tm = 23.6 °C, and the width of transition, ΔT1/2 = 0.2 °C [22]). In the presence of 50 mol% cholesterol, the entire DMPC membrane is in the liquid-ordered phase (see the phase diagram in Ref. [23]). The rigid limit measurements were taken at −165 °C. Conventional, CW EPR spectra for n-PC in DMPC membranes without and with 50 mol% cholesterol were obtained on a Bruker EMX X-band spectrometer and were used to obtain spectral parameters directly from the spectra or through simulation (see Sections 2.5 and 2.6).
2.4. Saturation-recovery data acquisition and processing
Saturation-recovery signals were obtained at X-band on a home-built spectrometer and loop-gap resonator as previously described [3]. The pulse duration was 0.3 μs. For the lipid-analog spin labels used in this study, motion was sufficiently slow that the nitrogen nuclear relaxation rates were greater than the electron values, resulting in strong coupling of the three hyperfine lines [24,25]. The central-field hyperfine line, which is most intense, was observed.
Typically, 106 decays were averaged, half of which were off-resonance and differenced for baseline correction, with 2048 data points per decay. Sampling intervals depended on sample, temperature, and oxygen tension, and were either 10 or 20 ns. Total accumulation time was about 2–5 min. Recovery curves were fitted by single, double, and triple exponentials, and compared. Results indicated that for all of the recovery curves obtained in this work, no substantial improvement in the fitting was observed when the number of exponentials was above one, establishing that these recovery curves could be analyzed as single exponentials (criteria for the goodness of a single exponential fit are described in [26]). Fits were based on a damped linear least-squares method. Decay time constants were determined with accuracy better than ±3%.
2.5. Simulation of EPR spectra
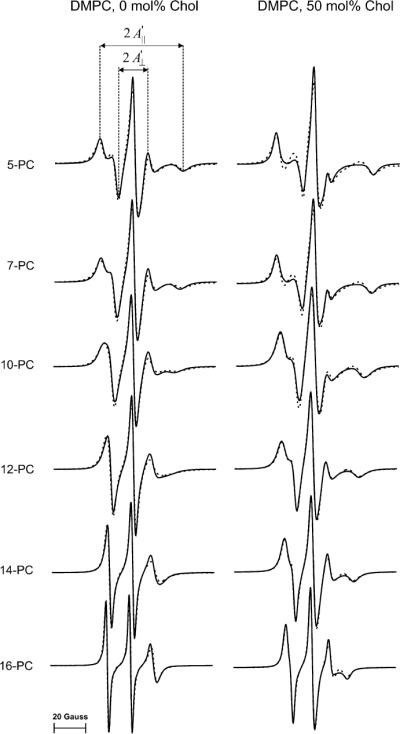
Nonlinear least squares (NLLS) analyses of the CW EPR spectra were performed using the fitting program of Budil et al. [27] based on the stochastic Liouville equation developed by Freed and coworkers [28,29]. The hyperfine A-tensor and the g-tensor components for the n-PC spin labels were obtained from rigid limit spectra (−165 °C) in either DMPC or DMPC/cholesterol. Superimposed experimental and simulated spectra are shown in Fig. 2, and magnetic tensor parameters obtained from the fits are listed in Table 1. Variations in the magnetic tensor components (particularly gxx and Azz) are related to the polarity of the local environment of the nitroxide moiety at different positions on the alkyl chain [30,31]. These results emphasize the need to determine these parameters for each spin label and for each membrane system as an important first step, prior to simulating EPR spectra in fluid phase membranes.
Fig. 2.
Experimental (solid line) and simulated (broken line) X-band EPR spectra of n-PC in DMPC and DMPC/50 mol% cholesterol membranes at 165 °C (rigid-limit conditions).
Table 1.
Magnetic tensor parameters for n-PC spin labels in DMPC and DMPC/Chol (50 mol%) membranes.
| n-PC | gxx | gyy | gzz | Axxa | Ayya | Azza |
|---|---|---|---|---|---|---|
| DMPC | ||||||
| 5 | 2.0086 | 2.0058 | 2.0020 | 4.9 | 4.9 | 34.4 |
| 7 | 2.0087 | 2.0058 | 2.0 | 5.0 | 5.0 | 34.3 |
| 10 | 2.0089 | 2.0059 | 2.0020 | 5.1 | 5.1 | 34.1 |
| 12 | 2.0089 | 2.0058 | 2.0020 | 5.1 | 5.1 | 34.0 |
| 14 | 2.0089 | 2.0059 | 2.0020 | 5.0 | 5.0 | 33.8 |
| 16 | 2.0090 | 2.0059 | 2.0020 | 5.0 | 5.0 | 33.8 |
| DMPC/Chol | ||||||
| 5 | 2.0086 | 2.0057 | 2.0019 | 4.9 | 4.9 | 34.8 |
| 7 | 2.0087 | 2.0058 | 2.0019 | 5.0 | 5.0 | 34.7 |
| 10 | 2.0091 | 2.0058 | 2.0019 | 5.0 | 5.0 | 32.5 |
| 12 | 2.0092 | 2.0059 | 2.0020 | 5.1 | 5.1 | 32.4 |
| 14 | 2.0092 | 2.0058 | 2.0020 | 5.0 | 5.0 | 32.4 |
| 16 | 2.0092 | 2.0058 | 2.0020 | 5.0 | 5.0 | 32.3 |
In unit of Gauss.
Once the magnetic tensor parameters were obtained, they were fixed and used as the input parameters in the simulation of fluid-phase membrane spectra. The spectral simulations for spin labels in multilamellar dispersions of lipids used in the NLLS fittings were obtained using the MOMD (microscopic order and macroscopic disorder) model [29,32,33]. This model describes the dynamic structure of multilamellar dispersions of lipids, and assumes that the lipid molecules are preferentially oriented locally by the structure of the bilayer; however, globally the lipid bilayers are distributed randomly [32,33].
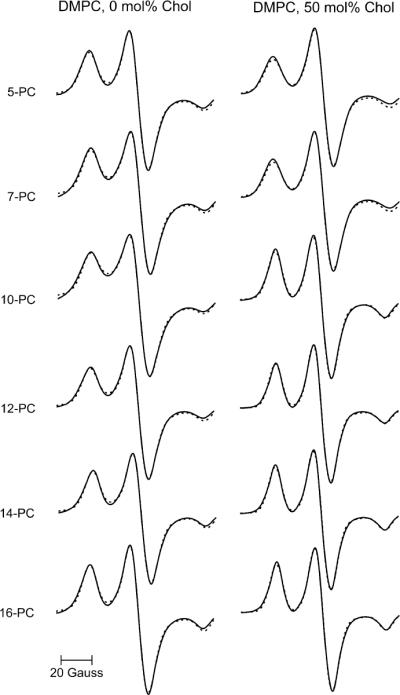
Superimposed experimental and simulated spectra of rapidly rotating n-PC spin labels in DMPC and DMPC/cholesterol membranes are shown in Fig. 3. In the simulations, the motion of the nitroxide moiety attached to the Cn position of the alkyl chain is treated as Brownian diffusion of the (Cn−1, Cn+1) vector within the confines of a cone with a semi-cone angle, θC. The spatial constraints imposed by the membrane (ordering potential) was a square well potential with an infinitely high barrier at θC (as an approximation of a Gaussian restoring potential) [27,33]. The ordering potential is related to the order parameter, So, which measures the angular extent of the rotational diffusion of the nitroxide moiety relative to the membrane normal, and was extracted from the simulation.
Fig. 3.
Experimental (solid line) and simulated (broken line) X-band EPR spectra of n-PC in DMPC and DMPC/50 mol% cholesterol membranes at 27 °C (fluid phase membranes).
In this model, one can consider two independent modes of motion: (1) axial rotation of a n-PC about its long axis (i.e., the n-PC spin label rotates rapidly about its long axis with a rotational diffusion coefficient R∥ irrespective of the orientation of the long axis), and (2) wobbling of the long axis within a cone (i.e., the (Cn−1, Cn+1) vector reorients rapidly with a rotational diffusion coefficient R⊥ within the confines of a cone with a semi-cone angle of θC). Simulation yields a dynamic rotational diffusion parameter (R⊥). However, the NLLS analysis for the n-PC spin labels is found to be insensitive to R⊥ because of the fast rotation about the long axis of the spin label, the axial symmetry of the nitroxide hyperfine tensor (with x- and y-components of the hyperfine tensor Axx ≈ Ayy), and low sensitivity of the EPR spectrum at X-band to the g-factor anisotropy [34]. This insensitivity was demonstrated in many simulations of the n-PC EPR spectra in membranes [6–8].
The fits shown in Fig. 3 are appropriate for fluid phase membranes, where the assumptions of rapid anisotropic motion (described above) are satisfied. Attempts to simulate these spectra without an ordering potential produced poor fits, except for 16-PC in the pure DMPC membrane, which indicates that only in the case of 16-PC can the rotational motion of the nitroxide moiety be treated as isotropic.
2.6. Order parameter
The molecular order parameter for the nth segment of an alkyl chain, Smol, is defined by the following equation [35],
| (1) |
where θn is the instantaneous angle between the nth segmental vector (i.e., the (Cn−1, Cn+1) vector linking n − 1 and n + 1 C atoms in the alkyl chain) and the bilayer normal, and the brackets denote both the ensemble and the time average.
The order parameter can be obtained for all segments of the alkyl chain of the bilayer by molecular dynamics simulation [36,37]. It can be also calculated from the EPR spectra for lipid spin labels oriented in the lipid bilayer. The direction of the z-vector of the >N–O group of the doxyl ring in n-PC spin labels corresponds to the (Cn−1, Cn+1) vector. Therefore, the fast rotational motion about the long axis of the spin-label molecule and the fast wobbling motion of the (Cn−1, Cn+1) vector gives rise to new features of the EPR spectra. Positions of these lines, which are determined by the time-averaged values of the hyperfine and g-tensor components, are independent of the rate of motion (if rate of motion is ≥108 s−1) and are determined solely by the geometrical considerations restricting the anisotropic motion—namely, the cone of the angle to which motion is confined as imposed by the membrane environment. These form the basis of the approach developed by Hubbell and McConnell [35], in which separation of the lines in the EPR spectra, and , which can be measured directly from the spectra (see Fig. 3), are used to calculate the order parameter. The expression of Eq. (2) from Marsh [2] was used here.
| (2) |
In this equation, corrected values for the separation of the lines are used, Eq. (3); see Refs. [2,38,39]:
| (3) |
where A∥, , A⊥, and are in gauss. The order parameter can also be obtained from the EPR spectral simulation using Freed's model [29,40,41], as described in Section 2.5. All modes of motion confined by the ordering potential are included in the simulation. In the present work, we calculated profiles of the order parameter using Eq. (2) and by simulation as described in Section 2.5.
3. Results
3.1. Profiles of the spin-lattice relaxation rate (fluidity profiles)
Representative saturation-recovery curves of 5-PC and 16-PC in fluid-phase DMPC and DMPC/cholesterol membranes are shown in Fig. 4. In all cases the SR signals were satisfactorily fit to a single exponential function (see residuals in Fig. 4). As can be seen, incorporation of cholesterol increases T1 for 5-PC and decreases T1 for 16-PC, indicating that the presence of cholesterol decreases the averaged rate of spin label motion near the bilayer surface while increasing it near the center of the bilayer.
Fig. 4.
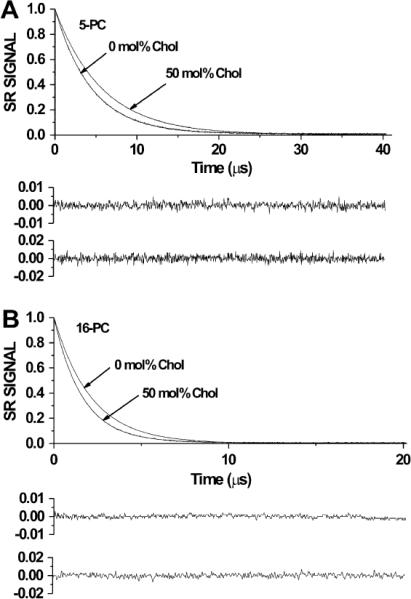
Representative SR signals with fitted curves and the residuals (the experimental signal minus the fitted curve) for 5-PC (A) and 16-PC (B) in DMPC membranes without and with 50 mol% cholesterol at 27 °C. The fits to the single-exponential curves for 5-PC give recovery times of 4.61 μs and 5.73 μs for membranes without and with cholesterol, respectively (A); and recovery times for 16-PC of 2.11 μs and 1.61 μs for membranes without and with cholesterol, respectively (B). All samples were equilibrated with nitrogen. Upper residuals are for membranes without cholesterol and lower residuals are for membranes with cholesterol. These results indicate the opposite effects of cholesterol on spin label dynamics at membrane surface and in the membrane center.
Similar studies were carried out for each of the n-PC spin labels, allowing us to construct fluidity profiles based on as a function of membrane depth for DMPC membranes without and with 50 mol% cholesterol (Fig. 5). As expected, for both systems we observed increasing values of , corresponding to an increase in membrane fluidity (membrane dynamics), as the spin label position was moved progressively deeper into the bilayer. Comparison of profiles for pure DMPC and DMPC/cholesterol indicates that cholesterol decreases membrane fluidity close to the bilayer surface and that membrane fluidity is increased near the membrane center. The transition between the rigidifying and fluidizing effects of cholesterol lies at approximately the C9 position, the depth to which the inflexible cholesterol ring structure is immersed into the bilayer. These studies are in good agreement with our previous work utilizing another dynamic parameter—namely, the oxygen transport parameter—which clearly differentiates between the membrane region occupied by the cholesterol ring structure and the deeper region of the bilayer containing the aliphatic isooctyl chain of cholesterol (see Section 4 and Refs. [13,15,42,43]). In contrast, profiles of the order parameter (see Section 3.3) do not differentiate the effects of cholesterol at different depths, showing ordering effects of cholesterol at all depths.
Fig. 5.
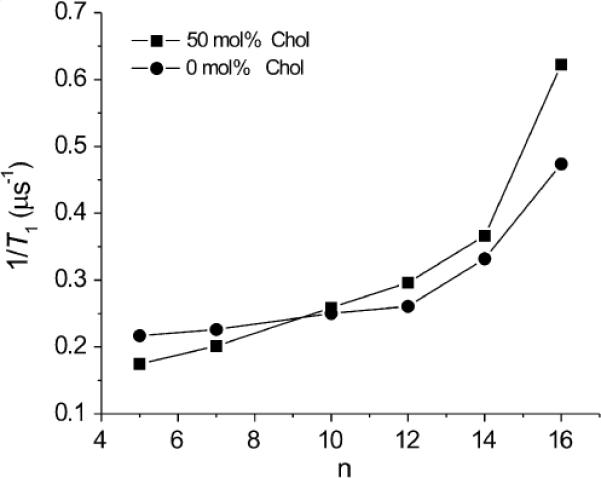
Profiles of T−11 (the spin-lattice relaxation rate) obtained for n-PC spin labels in DMPC membranes without and containing 50 mol% cholesterol as a function of nitroxide moiety position “n” on the alkyl chain.
3.2. Profiles of the rotational diffusion coefficient
Profiles of the rotational diffusion coefficient perpendicular to the bilayer normal, R⊥, obtained from spectral simulations of the conventional EPR spectra for n-PC spin labels in DMPC membranes without and with 50 mol% cholesterol are shown in Fig. 6. In both membranes R⊥, increases with increasing depth in the membrane. However, in the presence of cholesterol R⊥, is substantially decreased near the membrane surface and increased near the membrane center compared with pure DMPC bilayers. Similar effects of cholesterol were observed in the fluidity profiles displayed in Fig. 5 based on measurements. In both displays of membrane dynamics (fluidity) the transition from the rigidifying effect of cholesterol to the fluidizing effect occurs at approximately the same depth, the C9 position, which is the depth to which the rigid ring structure of cholesterol is immersed into the bilayer.
Fig. 6.
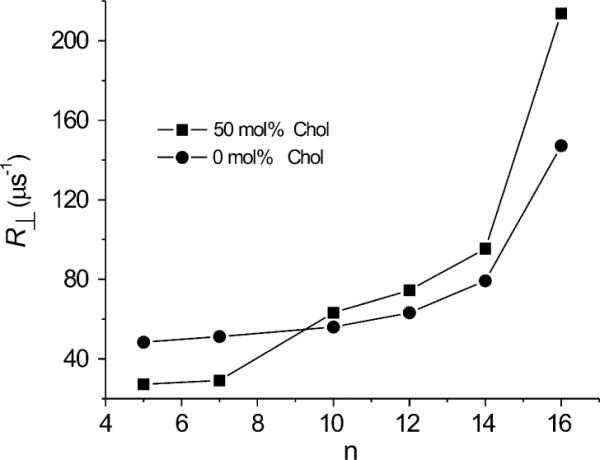
Plots of the best fit values of the rotational diffusion coefficient (R⊥) for n-PC in DMPC membranes without and containing 50 mol% cholesterol as a function of nitroxide moiety position “n” on the alkyl chain.
To the best of our knowledge, this is first time that the fluidizing effect of cholesterol in the membrane center, in distinction to the rigidifying effect close to the membrane surface, has been demonstrated using a T2 method, namely, display of a parameter obtained from spectral simulation. Swamy et al. [6] showed profiles of R⊥, in raft-forming phospholipid mixtures with different amounts of cholesterol. They compared properties of the liquid-disordered domain containing ~7.5 mol% cholesterol within the raft domain containing ~35 mol% cholesterol, and concluded that cholesterol decreases rotational motion of phospholipid spin labels close to the membrane surface (5-PC and 7-PC positions) and does not affect motion in the membrane center (12-PC and 16-PC positions).
The similarity of the profiles presented in Figs. 5 and 6 supports the validity of Freed's model and the spectral simulation process. is a dynamic parameter obtained directly from the SR measurements, which also shows this unusual effect of cholesterol on membrane fluidity. Similar effects can be also observed from spectral simulation by displaying the rotational diffusion coefficient, namely, R⊥. However, the order parameter, as discussed below, shows rigidifying effects of cholesterol at all depths in the membrane.
3.3. Profiles of the order parameter
Profiles of the order parameter, S, for DMPC and DMPC/cholesterol membranes obtained directly from the EPR spectra according to the model described in Eq. (1) and (2) are presented in Fig. 7. Both profiles show a gradual decrease in alkyl chain order with increasing depth in the membrane. Values of the order parameter measured at the same depth are always significantly greater for the DMPC/cholesterol membrane than for the pure DMPC membrane. Thus, an ordering effect of cholesterol in fluid-phase DMPC is observed at all depths from membrane surface to membrane center. Such results have traditionally been used to suggest that cholesterol decreases membrane fluidity throughout the membrane bilayer.
Fig. 7.
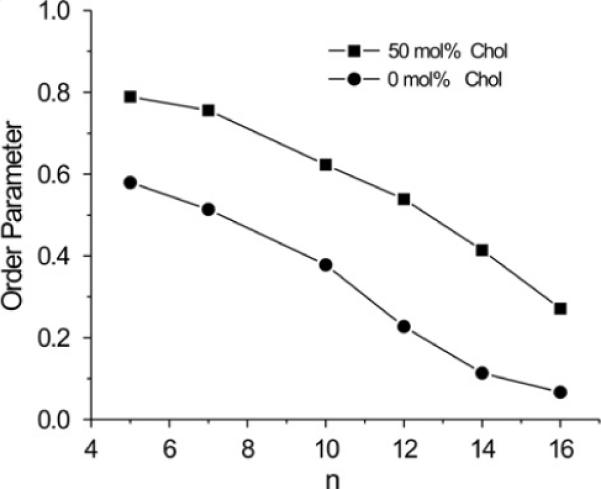
Profiles of the order parameter as a function of the nitroxide moiety position “n” on the alkyl chain obtained for n-PC spin labels in DMPC membranes without and containing 50 mol% cholesterol. The order parameter S was calculated from experimental EPR spectra using Eq. (2).
Profiles of the order parameter, So, obtained from spectral simulations of the CW EPR spectra for n-PC spin labels in DMPC membranes using Freed's model without and with 50 mol% cholesterol are shown in Fig. 8. Values of the order parameter obtained based on the measured spectral parameters (Fig. 7) and simulations (Fig. 8) differ significantly. However, both show the same trends—namely, order parameters decrease with increasing depth in the bilayer and are always larger for membranes containing cholesterol. The same trends are also revealed in profiles of the order parameter obtained through molecular dynamics simulation of lipid bilayer membranes without and with cholesterol [36,37].
Fig. 8.
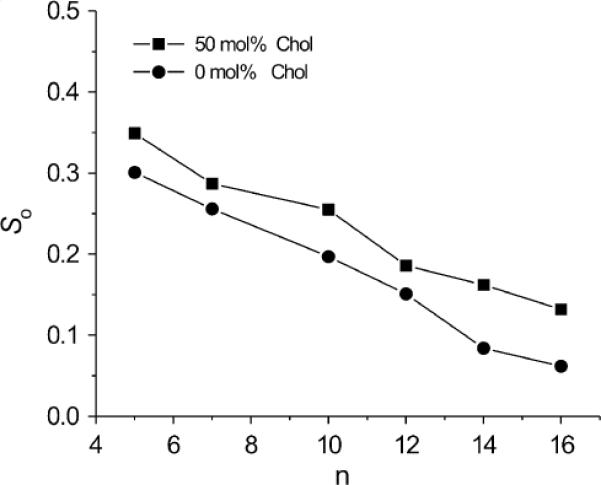
Plots of the best fit values of the order parameter (So) for n-PC in DMPC membranes without and containing 50 mol% cholesterol as a function of nitroxide moiety position “n” on the alkyl chain.
4. Discussion
The fact that T1 values are substantially longer that T2 values for lipid spin labels in membranes provides certain advantages of T1-sensitive methods over T2-sensitive methods. These advantages have been demonstrated in T1-sensitive spin-label oximetry measurements [44,45], in saturation recovery studies of oxygen diffusion in membranes [12–15,46], and in studies of bimolecular collision rates between 14N:15N spin-labeled lipids [3,47–49]. These results suggested to us that T1-based measurements of spin label motion might reveal features of membrane fluidity that cannot be detected by the widely used T2-sensitive methods (e.g., order parameter and spectral linewidths).
Profiles of the order parameters calculated directly from EPR spectra (Fig. 7) and obtained from spectral simulation (Fig. 8) show that the ordering and rigidifying effect of cholesterol extends from the membrane surface to the membrane center. In contrast, profiles of parameters that primarily depend on the rate of motion of the alkyl-chain fragment to which the nitroxide moiety is attached (i.e., R⊥, (Fig. 6) or (Fig. 5)) show the fluidizing effect of cholesterol in the membrane center. This seeming discrepancy results from the structure and localization of the cholesterol molecule within the membrane. As noted above, the rigid sterol ring of cholesterol extends only to a depth of approximately the ninth carbon of lipid alkyl chains, as evidenced by sharp transitions in the oxygen transport parameter [13,42] and transmembrane profiles for hydrophobicity [50,51]. At deeper locations, the isooctyl chain that forms the “tail” of cholesterol has a cross section that is much smaller than that of the sterol ring, providing additional opportunity for trans-gauche isomerization in the alkyl chains of neighboring phospholipids. EPR parameters that reflect local diffusion and rotational dynamics (, R⊥, the oxygen transport parameter) are sensitive to this increase in free volume whereas the order parameter, which reflects the deviation of the entire alkyl chain from the membrane normal, is not. Ordering of the alkyl chains induced by steric contact with the plate-like portion of cholesterol also causes ordering of the distal fragment of the alkyl chain, even though the number of gauche bonds is not changed in that fragment, and motional parameters are greater. Thus, the increased mobility induced by cholesterol in the membrane center, indicated by the dynamic parameters describing the rate of motion, is not inconsistent with an increased order parameter, describing the amplitude of motion.
5. Conclusion
In this work, we show that of lipid-analog spin labels can be used as a convenient, quantitative measure of membrane fluidity that is sensitive to the averaged rate of nitroxide motion. Measurement of for a series of n-PC or n-SASL as a function of label position provides a fluidity profile that reflects averaged local membrane dynamics across the lipid bilayer. With the growing availability of commercially-available spectrometers with saturation recovery capability, such measurements can be a valuable approach for characterizing membrane structure and dynamics. Such profiles can be obtained not only at X-band, but also at other frequencies, including Q-band [17,19] and W-band [18,19], with even greater sensitivity. SR EPR at Q- and W-band have the potential to be a useful tool for studying membrane fluidity in samples of small volume (e.g., ~30 nL), which can be especially significant for studies of isolated biological membranes from cell cultures and human samples.
Acknowledgment
This work was supported by Grants EY015526, EB002052, GM068829, and EB001980 from the National Institutes of Health.
References
- [1].Hubbell WL, McConnell HM. Spin-label studies of the excitable membranes of nerve and muscle. Proc. Natl. Acad. Sci. USA. 1968;61:12–16. doi: 10.1073/pnas.61.1.12. [DOI] [PMC free article] [PubMed] [Google Scholar]
- [2].Marsh D. Electron spin resonance: spin labels. In: Grell E, editor. Membr. Spectrosc. Springer-Verlag; Berlin: 1981. pp. 51–142. [DOI] [PubMed] [Google Scholar]
- [3].Yin JJ, Subczynski WK. Effects of lutein and cholesterol on alkyl chain bending in lipid bilayers: a pulse electron spin resonance spin labeling study. Biophys. J. 1996;71:832–839. doi: 10.1016/S0006-3495(96)79284-6. [DOI] [PMC free article] [PubMed] [Google Scholar]
- [4].Devaux PF. ESR and NMR studies of lipid-protein interactions in membranes. In: Berliner LJ, Reuben J, editors. Biological Magnetic Resonance. Plenum Press; New York: 1983. pp. 183–299. [Google Scholar]
- [5].Schreier S, Polnaszek CF, Smith IC. Spin labels in membranes: problems in practice. Biochim. Biophys. Acta. 1978;515:395–436. doi: 10.1016/0304-4157(78)90011-4. [DOI] [PubMed] [Google Scholar]
- [6].Swamy MJ, Ciani L, Ge M, Smith AK, Holowka D, Baird B, Freed JH. Coexisting domains in the plasma membranes of live cells characterized by spin-label ESR spectroscopy. Biophys. J. 2006;90:4452–4465. doi: 10.1529/biophysj.105.070839. [DOI] [PMC free article] [PubMed] [Google Scholar]
- [7].Ge M, Gidwani A, Brown HA, Holowka D, Baird B, Freed JH. Ordered and disordered phases coexist in plasma membrane vesicles of RBL-2H3 mast cells. Biophys. J. 2003;85:1278–1288. doi: 10.1016/S0006-3495(03)74563-9. [DOI] [PMC free article] [PubMed] [Google Scholar]
- [8].Kar L, Ney-Igner E, Freed JH. Electron spin resonance and electron-spin-echo study of oriented multilayers of L alpha-dipalmitoylphosphatidylcholine water systems. Biophys. J. 1985;48:569–595. doi: 10.1016/S0006-3495(85)83814-5. [DOI] [PMC free article] [PubMed] [Google Scholar]
- [9].Robinson BH, Haas DA, Mailer C. Molecular dynamics in liquids: spin-lattice relaxation of nitroxide spin labels. Science. 1994;263:490–493. doi: 10.1126/science.8290958. [DOI] [PubMed] [Google Scholar]
- [10].Mailer C, Nielsen RD, Robinson BH. Explanation of spin-lattice relaxation rates of spin labels obtained with multifrequency saturation recovery EPR. J. Phys. Chem. A. 2005;109:4049–4061. doi: 10.1021/jp044671l. [DOI] [PubMed] [Google Scholar]
- [11].Subczynski WK, Raguz M, Widomska J. Studying lipid organization in biological membranes using liposomes and EPR spin labeling. Methods Mol. Biol. 2010;606:247–269. doi: 10.1007/978-1-60761-447-0_18. [DOI] [PMC free article] [PubMed] [Google Scholar]
- [12].Ashikawa I, Yin JJ, Subczynski WK, Kouyama T, Hyde JS, Kusumi A. Molecular organization and dynamics in bacteriorhodopsin-rich reconstituted membranes: discrimination of lipid environments by the oxygen transport parameter using a pulse ESR spin-labeling technique. Biochemistry. 1994;33:4947–4952. doi: 10.1021/bi00182a025. [DOI] [PubMed] [Google Scholar]
- [13].Subczynski WK, Wisniewska A, Hyde JS, Kusumi A. Three-dimensional dynamic structure of the liquid-ordered domain in lipid membranes as examined by pulse-EPR oxygen probing. Biophys. J. 2007;92:1573–1584. doi: 10.1529/biophysj.106.097568. [DOI] [PMC free article] [PubMed] [Google Scholar]
- [14].Kusumi A, Subczynski WK, Hyde JS. Oxygen transport parameter in membranes as deduced by saturation recovery measurements of spin-lattice relaxation times of spin labels. Proc. Natl. Acad. Sci. USA. 1982;79:1854–1858. doi: 10.1073/pnas.79.6.1854. [DOI] [PMC free article] [PubMed] [Google Scholar]
- [15].Subczynski WK, Hyde JS, Kusumi A. Effect of alkyl chain unsaturation and cholesterol intercalation on oxygen transport in membranes: a pulse ESR spin labeling study. Biochemistry. 1991;30:8578–8590. doi: 10.1021/bi00099a013. [DOI] [PubMed] [Google Scholar]
- [16].Raguz M, Mainali L, Widomska J, Subczynski WK. The immiscible cholesterol bilayer domain exists as an integral part of phospholipid bilayer membranes. Biochim. Biophys. Acta. 2011;1808:1072–1080. doi: 10.1016/j.bbamem.2010.12.019. [DOI] [PMC free article] [PubMed] [Google Scholar]
- [17].Hyde JS, Yin JJ, Subczynski WK, Camenisch TG, Ratke JJ, Froncisz W. Spin-label EPR T1 values using saturation recovery from 2 to 35 GHz. J. Phys. Chem. B. 2004;108:9524–9529. [Google Scholar]
- [18].Froncisz W, Camenisch TG, Ratke JJ, Anderson JR, Subczynski WK, Strangeway RA, Sidabras JW, Hyde JS. Saturation recovery EPR and ELDOR at W-band for spin labels. J. Magn. Reson. 2008;193:297–304. doi: 10.1016/j.jmr.2008.05.008. [DOI] [PMC free article] [PubMed] [Google Scholar]
- [19].Subczynski WK, Mainali L, Camenisch TG, Froncisz W, Hyde JS. Spin-label oximetry at Q- and W-band. J. Magn. Reson. 2011;209:142–148. doi: 10.1016/j.jmr.2011.01.003. [DOI] [PMC free article] [PubMed] [Google Scholar]
- [20].Kusumi A, Subczynski WK, Pasenkiewicz-Gierula M, Hyde JS, Merkle H. Spin-label studies on phosphatidylcholine-cholesterol membranes: effects of alkyl chain length and unsaturation in the fluid phase. Biochim. Biophys. Acta. 1986;854:307–317. doi: 10.1016/0005-2736(86)90124-0. [DOI] [PubMed] [Google Scholar]
- [21].Subczynski WK, Felix CC, Klug CS, Hyde JS. Concentration by centrifugation for gas exchange EPR oximetry measurements with loop-gap resonators. J. Magn. Reson. 2005;176:244–248. doi: 10.1016/j.jmr.2005.06.011. [DOI] [PubMed] [Google Scholar]
- [22].Wisniewska A, Nishimoto Y, Hyde JS, Kusumi A, Subczynski WK. Depth dependence of the perturbing effect of placing a bulky group (oxazolidine ring spin labels) in the membrane on the membrane phase transition. Biochim. Biophys. Acta. 1996;1278:68–72. doi: 10.1016/0005-2736(96)89535-6. [DOI] [PubMed] [Google Scholar]
- [23].Almeida PFF, Vaz WLC, Thompson TE. Lateral diffusion in the liquid phases of dimyristoylphosphatidylcholine/cholesterol lipid bilayers: a free volume analysis. Biochemistry. 1992;31:6739–6747. doi: 10.1021/bi00144a013. [DOI] [PubMed] [Google Scholar]
- [24].Popp CA, Hyde JS. Electron-electron double resonance and saturation-recovery studies of nitroxide electron and nuclear spin-lattice relaxation times and Heisenberg exchange rates: lateral diffusion in dimyristoyl phosphatidylcholine. Proc. Natl. Acad. Sci. USA. 1982;79:2559–2563. doi: 10.1073/pnas.79.8.2559. [DOI] [PMC free article] [PubMed] [Google Scholar]
- [25].Yin JJ, Feix JB, Hyde JS. Solution of the nitroxide spin-label spectral overlap problem using pulse electron spin resonance. Biophys. J. 1988;53:525–531. doi: 10.1016/S0006-3495(88)83132-1. [DOI] [PMC free article] [PubMed] [Google Scholar]
- [26].Subczynski WK, Widomska J, Wisniewska A, Kusumi A. Saturation-recovery electron paramagnetic resonance discrimination by oxygen transport (DOT) method for characterizing membrane domains. In: McIntosh TJ, editor. Methods in Molecular Biology, “Lipid Rafts”. Humana Press; Totowa: 2007. pp. 143–157. [DOI] [PubMed] [Google Scholar]
- [27].Budil DE, Lee S, Saxena S, Freed JH. Nonlinear-least-squares analysis of slow-motion EPR spectra in one and two dimensions using a modified Levenberg-Marquardt algorithm. J. Magn. Reson. 1996;120:155–189. [Google Scholar]
- [28].Meirovitch E, Igner D, More G, Freed JH. Electron-spin relaxation and ordering in smectic and supercooled nematic liquid crystals. J. Chem. Phys. 1982;77:3915–3938. [Google Scholar]
- [29].Schneider DJ, Freed JH. Calculating slow motional magnetic resonance spectra: a user's guide. In: Berliner LJ, Reuben J, editors. Spin Labeling: Theory and Application. Plenum; New York: 1989. pp. 1–76. [Google Scholar]
- [30].Earle KA, Moscicki JK, Ge M, Budil DE, Freed JH. 250-GHz electron spin resonance studies of polarity gradients along the aliphatic chains in phospholipid membranes. Biophys. J. 1994;66:1213–1221. doi: 10.1016/S0006-3495(94)80905-1. [DOI] [PMC free article] [PubMed] [Google Scholar]
- [31].Kurad D, Jeschke G, Marsh D. Lipid membrane polarity profiles by high-field EPR. Biophys. J. 2003;85:1025–1033. doi: 10.1016/S0006-3495(03)74541-X. [DOI] [PMC free article] [PubMed] [Google Scholar]
- [32].Meirovitch E, Freed JH. Analysis of slow-motional electron spin resonance spectra in smectic phases in terms of molecular configuration, intermolecular interactions, and dynamics. J. Phys. Chem. 1984;88:4995–5004. [Google Scholar]
- [33].Earle KA, Budil DE. Calculating slow-motion ESR spectra of spin-labeled polymers. In: Schlick S, editor. Advanced ESR Methods in Polymer Research. John Wiley & Sons; Hoboken, NJ: 2006. pp. 54–82. [Google Scholar]
- [34].Smirnov A, Belford R, Clarkson R. Comparative spin label spectra at X- band and W- band. In: Berliner LJ, editor. Biological Magnetic Resonance, Spin Labeling: The Next Millennium. vol. 14. Plenum Press; New York, NY: 1998. pp. 83–107. [Google Scholar]
- [35].Hubbell WL, McConnell HM. Molecular motion in spin-labeled phospholipids and membranes. J. Am. Chem. Soc. 1971;93:314–326. doi: 10.1021/ja00731a005. [DOI] [PubMed] [Google Scholar]
- [36].Rog T, Pasenkiewicz-Gierula M. Cholesterol effects on the phosphatidylcholine bilayer nonpolar region: A molecular simulation study. Biophys. J. 2001;81:2190–2202. doi: 10.1016/S0006-3495(01)75867-5. [DOI] [PMC free article] [PubMed] [Google Scholar]
- [37].Rog T, Pasenkiewicz-Gierula M, Vattulainen I, Karttunen M. Ordering effects of cholesterol and its analogues. Biochim. Biophys. Acta. 2009;1788:97–121. doi: 10.1016/j.bbamem.2008.08.022. [DOI] [PubMed] [Google Scholar]
- [38].Gaffney BJ. Practical considerations for the calculation of order parameters for fatty acid or phospholipid spin labels in membranes. In: Berliner LJ, editor. Spin Labeling: Theory and Applications. Academic Press; New York, NY: 1976. pp. 567–571. [Google Scholar]
- [39].Griffith OH, Jost PC. Lipid spin labels in biological membranes. In: Berliner LJ, editor. Spin Labeling: Theory and Applications. Academic Press; New York, NY: 1976. pp. 453–523. [Google Scholar]
- [40].Polnaszek CF, Freed JH. Electron spin resonance studies of anisotropic ordering, spin relaxation, and slow tumbling in liquid-crystalline solvents. J. Phys. Chem. 1975;79:2283–2306. [Google Scholar]
- [41].Chiang YW, Shimoyama Y, Feigenson GW, Freed JH. Dynamic molecular structure of DPPC-DLPC-cholesterol ternary lipid system by spin-label electron spin resonance. Biophys. J. 2004;87:2483–2496. doi: 10.1529/biophysj.104.044438. [DOI] [PMC free article] [PubMed] [Google Scholar]
- [42].Widomska J, Raguz M, Dillon J, Gaillard ER, Subczynski WK. Physical properties of the lipid bilayer membrane made of calf lens lipids: EPR spin labeling studies. Biochim. Biophys. Acta. 2007;1768:1454–1465. doi: 10.1016/j.bbamem.2007.03.007. [DOI] [PMC free article] [PubMed] [Google Scholar]
- [43].Raguz M, Widomska J, Dillon J, Gaillard ER, Subczynski WK. Physical properties of the lipid bilayer membrane made of cortical and nuclear bovine lens lipids: EPR spin-labeling studies. Biochim. Biophys. Acta. 2009;1788:2380–2388. doi: 10.1016/j.bbamem.2009.09.005. [DOI] [PMC free article] [PubMed] [Google Scholar]
- [44].Hyde JS, Subczynski WK. Spin-label oximetry. In: Berliner LJ, Reuben J, editors. Biological Magnetic Resonance. Plenum Press; New York: 1989. pp. 399–425. [Google Scholar]
- [45].Subczynski WK, Swartz HM. EPR oximetry in biological and model samples. In: Eaton SS, Eaton GR, Berliner LJ, editors. Biological Magnetic Resonance, Biomedical EPR - Part A: Free Radicals, Metals, Medicine, and Physiology. Kluwer/Plenum; New York: 2005. pp. 229–282. [Google Scholar]
- [46].Subczynski WK, Hyde JS, Kusumi A. Oxygen permeability of phosphatidylcholine-cholesterol membranes. Proc. Natl. Acad. Sci. USA. 1989;86:4474–4478. doi: 10.1073/pnas.86.12.4474. [DOI] [PMC free article] [PubMed] [Google Scholar]
- [47].Yin JJ, Hyde JS. Application of rate equations to ELDOR and saturation recovery experiments on 14N:15N spin-label pairs. J. Magn. Reson. 1987;74:82–93. [Google Scholar]
- [48].Yin JJ, Feix JB, Hyde JS. Mapping of collision frequencies for stearic acid spin labels by saturation-recovery electron paramagnetic resonance. Biophys. J. 1990;58:713–720. doi: 10.1016/S0006-3495(90)82414-0. [DOI] [PMC free article] [PubMed] [Google Scholar]
- [49].Yin JJ, Feix JB, Hyde JS. The effects of cholesterol on lateral diffusion and vertical fluctuations in lipid bilayers, An electron-electron double resonance (ELDOR) study. Biophys. J. 1987;52:1031–1038. doi: 10.1016/S0006-3495(87)83296-4. [DOI] [PMC free article] [PubMed] [Google Scholar]
- [50].Subczynski WK, Wisniewska A, Yin JJ, Hyde JS, Kusumi A. Hydrophobic barriers of lipid bilayer membranes formed by reduction of water penetration by alkyl chain unsaturation and cholesterol. Biochemistry. 1994;33:7670–7681. doi: 10.1021/bi00190a022. [DOI] [PubMed] [Google Scholar]
- [51].Marsh D. Polarity and permeation profiles in lipid membranes. Proc. Natl. Acad. Sci. USA. 2001;98:7777–7782. doi: 10.1073/pnas.131023798. [DOI] [PMC free article] [PubMed] [Google Scholar]