

Abstract
Cyclooxygenase-2 (COX-2) is a major contributor to the inflammatory response and cancer progression so it is an important target for prevention and therapy. COX-2 is absent or expressed at low levels in most epithelial cells but is found at high levels in inflammatory lesions, and many premalignant and malignant tumors. Thus, it is an attractive target for molecular imaging. We report a series of novel fluorinated imaging agents, derived from indomethacin or celecoxib that selectively inhibit COX-2. The most promising lead, compound 7, was a fluorinated derivative of celecoxib. Kinetic analysis revealed that this fluorinated compound is a slow, tight binding inhibitor of COX-2 and exhibits minimal inhibitory activity against COX-1. Efficient incorporation of 18F into compound 7 by radiochemical synthesis and intravenous injection provided sufficient signal for in vivo PET imaging. Selective uptake of 18F-7 was observed in inflamed rat paws compared to the non-inflamed contralateral paws and uptake was blocked by pretreatment with the COX-2 inhibitor, celecoxib. Uptake of 18F-7 was not observed when inflammation was induced in COX-2 null mice. In nude mice bearing both a COX-2-expressing human tumor xenograft (1483) and a COX-2-negative xenograft (HCT116), 18F-7 selectively accumulated in the COX-2-expressing tumor. Accumulation was blocked by pretreatment of the animals with celecoxib. The in vitro and in vivo properties of compound 7 suggest it will be a useful probe for early detection of cancer and for evaluation of the COX-2 status of premalignant and malignant tumors.
Introduction
Molecular imaging promises to revolutionize the diagnosis and treatment of cancer. Detection of early stage cancer or of chronically inflamed tissue is one of the major clinical challenges to which the development of radiotracer- or fluorescent-based imaging techniques has been directed (1-4). Efforts have been made to maximize the delivery of ligands into the tumor to achieve a high signal-to-noise ratio (5-7). COX-2 is an inducible enzyme that is expressed at elevated levels at sites of inflammation and malignant transformation, distinct from most normal tissues (8). This fact, combined with an extensive foundation of COX-2-selective inhibitors, makes this enzyme an ideal target for imaging inflammation and cancer.
The cyclooxygenase active site is located at the terminus of a long channel that runs from the protein surface to the interior of the protein. The initial portion of the channel has a large volume, or lobby, which narrows at a constriction comprised of Arg-120, Tyr-355, and Glu-524 (Fig. 1). The constriction constitutes a gate that must open and close in order for substrates and inhibitors to pass into or out of the cyclooxygenase active site, which is located above it. All COX inhibitors bind in the active site above the constriction (Fig. 1A,B) and the constriction site residues play an important role in binding carboxylic acid-containing inhibitors by a combination of ion-pairing and hydrogen bonding (9). Indomethacin is a non-selective inhibitor of COX-1 and COX-2, but it can be converted in a single step to a wide variety of amide or ester derivatives that selectively inhibit COX-2 (10). Celecoxib is a COX-2-selective inhibitor, which inserts its sulfonamide group into a side pocket of the active site that is only accessible in COX-2. Extensive structure-activity studies suggest bulky substituents on the sulfonamide or sulfone are not tolerated (11).
Fig. 1.
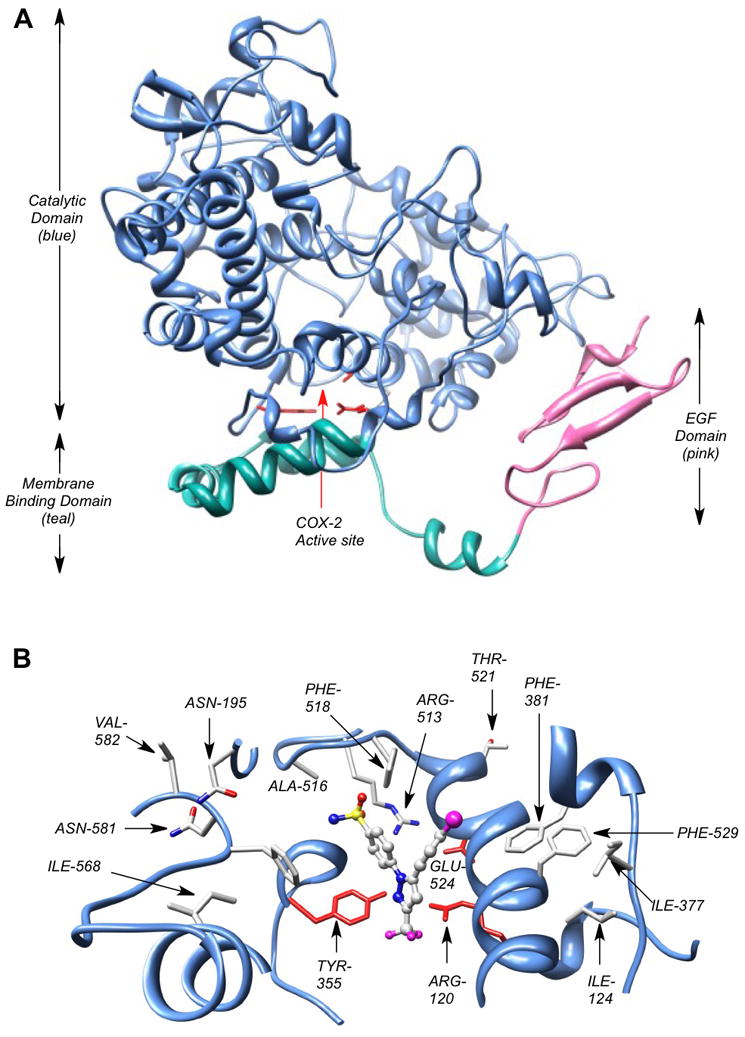
COX-2 crystal structure. A single monomer of the COX-2 homodimer is shown. (A) The membrane-binding domain (teal) is connected to the C-terminal end of the epidermal growth factor domain (pink) and is comprised of four α-helices. One of the helices (the D-helix) connects the membrane-binding domain to the catalytic domain (blue). NSAIDs and COXIBs fill the active site located above the constriction comprised of Arg-120, Tyr-355, and Glu-524 (red stick structures), which separates the active site from the membrane-binding domain. (B) View down from top of active site. The active site of COX-2 with a bound molecule of SC558, a COX-2 selective inhibitor and celecoxib analog. The SO2NH2 pharmacophore of SC558 inserts into the COX-2 side-pocket, where one sulfonamide oxygen atom forms a H-bond with Arg-513, and the nitrogen atom forms a H-bond with the carbonyl oxygen of Phe-518. The CF3 moiety of SC558 projects towards the constriction site residues of COX-2 active site.
We recently reported that COX-2-targeted fluorescent imaging agents can be selectively delivered into inflammatory tissues and COX-2-expressing tumors in vivo (12) and that COX-2-targeted SPECT imaging agents are selectively taken up by inflamed tissue (13). Attempts have been made to develop COX-2-targeted PET imaging agents and although compounds have been reported that are taken up into COX-2-expressing cells, no agents have been reported that are effective in vivo (14-16). Multiple factors may contribute to the lack of success including poor COX-2 inhibitory activity or rapid defluorination of 18F-based agents (17). Since an enormous amount of medicinal chemistry has been conducted to create COX-2-specific small molecule inhibitors, there are numerous classes of potential building blocks that are available for the preparation of molecular imaging agents for COX-2 (11,18,19). To enhance the possibility for developing an efficient COX-2-targeted PET imaging agent, we have synthesized a series of fluorinated compounds derived from the indomethacin or celecoxib scaffold. Here, we report their synthesis, and biochemical and cellular evaluation as inhibitors of COX-2. We also report the radiochemical synthesis of the [18F] derivative of the most promising compound and its uptake into inflammatory lesions and tumors in a COX-2-dependent fashion. This compound represents the first PET imaging agent validated for the detection of COX-2 in inflammation and cancer.
Materials and Methods
Chemistry
Syntheses and characterizations of all compounds are described in Supplementary Data.
Inhibition assay using purified COX-1 and COX-2
Cyclooxygenase activity of ovine COX-1 or human COX-2 was assayed by TLC (20). Briefly, reaction mixtures of 200 μL consisted of hematin-reconstituted protein in 100 mM Tris-HCl, pH 8.0, 500 μM phenol, and [1-14C]arachidonic acid (50 μM, ∼55-57 mCi/mmol, Perkin Elmer). For the time-dependent inhibition assays, hematin-reconstituted COX-1 (44 nM) or COX-2 (66 nM) was preincubated at 25 °C for 17 min and 37 °C for 3 min with varying inhibitor concentrations in DMSO followed by the addition of [1-14C]arachidonic acid (50 μM) for 30 s at 37 °C. Reactions were terminated by solvent extraction in Et2O/CH3OH/1 M citrate, pH 4.0 (30:4:1). The phases were separated by centrifugation at 2000g for 2 min and the organic phase was spotted on a TLC plate (EMD Kieselgel 60, VWR). The plate was developed in EtOAc/CH2Cl2/glacial AcOH (75:25:1) at 4 °C. Radiolabeled prostanoid products were quantitated with a radioactivity scanner (Bioscan, Inc., Washington, D.C.). The percentage of total products observed at different inhibitor concentrations was divided by the percentage of products observed for protein samples preincubated for the same time with DMSO.
Cell culture and intact cell metabolism assay
HCT116, ATCC CCL-247 human colorectal carcinoma cells, passage 8 to 18, Mycoplasma negative by a PCR detection method (5/17/10 and 12/08/10 testing, Sigma VenorGem), were grown in DMEM (Invitrogen/Life Technologies) + 10% fetal bovine serum (FBS; Atlas) to 70% confluence. RAW264.7, ATCC TIB-71 murine macrophage-like cells, passage 5 to 15, Mycoplasma negative by a PCR detection method (5/17/10 and 12/08/10 testing), were grown in DMEM (Invitrogen/Gibco)+10% heat-inactivated FBS (Atlas) in 6-well plates (Sarstedt) to 40% confluence and activated for 7 hrs in serum-free DMEM with 200 ng/ml LPS (Calbiochem) and 10U/ml interferon gamma (Calbiochem). 1483 human head and neck squamous cell carcinoma (HNSCC) cells, gift of Dr. AJ Dannenberg, Cornell Medical College, passage 9 to 19, Mycoplasma negative by a PCR detection method (5/17/10 and 12/08/10 testing), were grown in DMEM/F12+10% FBS in 6-well plates until 60% confluence. The ability of compounds to inhibit COX-2 in intact cells was assayed (21). Serum-free medium (2 ml) was added, and the cells were treated with inhibitor dissolved in DMSO (0 – 5 μM, final concentration) for 30 min at 37°C followed by the addition of [1-14C]-arachidonic acid [10 μM, ∼55 mCi/mmol, Perkin Elmer] for 20 min at 37°C. Reactions were terminated by solvent extraction in Et2O/CH3OH/1 M citrate, pH 4.0 (30:4:1), and the organic phase was spotted on a 20×20 cm TLC plate (EMD Kieselgel 60, VWR). The plate was developed in EtOAc/CH2Cl2/glacial AcOH (75:25:1), and radiolabeled prostaglandins were quantified with a radioactivity scanner (Bioscan, Inc., Washington, D.C.). The percentage of total products observed at different inhibitor concentrations was divided by the percentage of products observed for cells pre-incubated with DMSO.
Radiochemistry
The procedure for the radiosynthesis of the compound 7 is described in Supplementary Data.
In vivo PET imaging of COX-2 in inflammation
Animal studies were conducted in accordance with the standards of humane animal care described in the NIH Guide for the Care and Use of Laboratory Animals using protocols approved by the Vanderbilt University institutional animal care and use committee. Animals were housed in an AAALAC-approved animal care facility. Targeted disruption of the Ptgs2 gene was previously accomplished by insertion of a PGK-neo cassette in place of a 1.8-kb EcoRV genomic fragment spanning exon 1 and flanking sequences (22). Genotype was determined by tail PCR using the primers: sense 5′-ACC TCTGCGATGCTCTTCC, antisense 5′-CACCATAGAATCCAGTCCGG, neo 5′-ATCGCCTTCTTGACGAGTTC. Due to infertility and multiple reproductive deficits, Ptgs2 deficiency was reestablished in albino CD1 strain outbred mice (Charles River Laboratory, Raleigh, NC) through 10-generation outcross matings to create Ptgs2 deletion in a strain with vigorous reproductive characteristics. Heterozygous Ptgs2 females (20–25 g, 48–60 days old) were mated with homozygous null males to produce sufficient Ptgs2-null offspring.
Carrageenan (50 μL 1% in sterile saline) was injected subcutaneously in the rear right footpad of wild type CD-1 or COX-2 null mice (20-25 g) under anesthesia, followed by the administration of radiotracer 18F-7 (200 μL, i.p., 300-400 μCi, ∼3.5 mCi/mL) at 24 h post-carrageenan, when inflammation was maximal. At 2 h post radiotracer injection, the mice were anesthetized with 2% isoflurane, positioned on a mouse bed and placed in the microPET Focus 220 (Siemens, Knoxville, TN). They were imaged for 30 min with the rear right footpad being the center field of view. CT images of the rear right footpad were then produced using the microCAT II (Siemens, Knoxville, TN) at X-ray beam intensity of 500 mAs and tube voltage of 80 kVp. The PET images were reconstructed using an OSEM3D/MAP algorithm into transaxial slices (128 × 128 × 95) with voxel sizes of 0.095 cm × 0.095 cm × 0.08 cm. The PET and CT images were coregistered to each other based on bed position. Volumetric regions of interest (ROI's) were drawn around the left and right hind limbs of the coregistered images using the medical imaging analysis tool AMIDE (23). The maximum concentration within the ROI of the right hind limb was compared to that of the left hind limb.
Carrageenan (100 μL 1% in sterile saline) was injected subcutaneously in the rear right footpad of male Sprague Dawley rats (300-350 g, Charles River Laboratory) under anesthesia, followed by the administration of radiotracer 18F-7 (200-400 μL, tail vein, ∼1 mCi, ∼3.5 mCi/mL) at 2 h post-carrageenan. The rats were allowed to wake, placed in their cages and fed ad libitum. They were anesthetized with 2% isoflurane, positioned on a rat bed and placed in the microPET Focus 220 (Siemens, Knoxville, TN) at 2 h post-injection. They were imaged for 30 min with the rear right footpad being the center field of view. CT images of the rear right footpad were then produced using the microCAT II (Siemens, Knoxville, TN) at X-ray beam intensity of 27 mAs and tube voltage of 80 kVp. The PET images were reconstructed using an OSEM3D/MAP algorithm into transaxial slices (128 × 128 × 95) with voxel sizes of 0.095 cm × 0.095 cm × 0.08 cm. The PET and CT images were coregistered to each other based on bed position. Volumetric regions of interest (ROI's) were drawn around the left and right hind limbs of the coregistered images using the medical imaging analysis tool AMIDE (23). The maximum concentration within the ROI of the right hind limb was compared to that of the left hind limb.
Establishment of xenografts in nude mice
Female nude mice, NU-Fox1nu, were purchased at 6-7 weeks of age from Charles River Labs. Human 1483 HNSCC cells or HCT116 colorectal carcinoma cells were trypsinized and resuspended in cold PBS containing 30% Matrigel such that 1×10⁶ cells in 100 μl were injected subcutaneously on the left or right flank. The HCT116 or 1483 xenografts required 2-3 weeks of growth.
In vivo PET imaging of nude mice with xenografts
Female nude mice bearing medium-sized 1483 xenograft tumors on the left hip or HCT116 xenograft tumors on the right hip were dosed with ∼350 μCi of 18F-7 via retro-orbital injection. Two hours later, the mice were anesthetized with 2% isoflurane, positioned on a bed and placed in the microPET Focus 220 (Siemens, Knoxville, TN) and imaged for 30 min. CT images of the hips were then produced using the microCAT II (Siemens, Knoxville, TN) at x-ray beam intensity of 500 mAs and tube voltage of 80 kVp. The PET images were reconstructed using an OSEM3D/MAP algorithm into trans-axial slices (128 × 128 × 95) with voxel sizes of 0.095 cm × 0.095 cm × 0.08 cm. The PET and CT images were coregistered to each other based on bed position.
Tissue analysis
To evaluate the potential for defluorination, we analyzed the footpads (inflamed and control) of rats injected with unlabeled compound 7. We injected 100 μL 1% carrageenan into the right hind paw of male Sprague-Dawley rats (body weight, 300 to 350 g) and waited 3 h for inflammation to develop. Rats (n = 3) were dosed with compound 7 (1 mg/kg, i.p.). At 2 hours post dosing of compound 7, the rats were euthanized with isoflurane overdose and footpads were collected, weighed, and snap-frozen at −80°C for analysis. The tissue was thawed and digested with Proteinase K (Sigma) overnight. An aliquot of the digestion solution was extracted with 1.2 volumes of EtOAc : n-Hexane (2 : 1). The organic layer was removed, dried and reconstituted in MeOH and water. The samples were analyzed on an LC-ESI-MS system (Thermo) and 7 and its defluorinated metabolite were detected via selected reaction monitoring. The unknown samples were quantitated against a 5-point standard curve, which was subjected to the Proteinase K digestion and liquid-liquid extraction. The compounds were separated in reverse-phase mode on a C18 column (5 × 0.2 cm, Phenomenex) using gradient elution. Mobile phase component A was water and B was acetonitrile, each with 0.1% acetic acid. The gradient used was 50% B to 80% B over 4 minutes, followed by a brief hold and return to initial conditions. The flow rate was 0.35 mL/min.
Results
Inhibition of purified COX-1 and COX-2
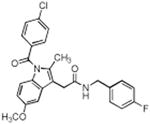
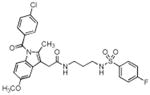
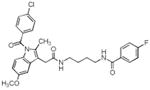
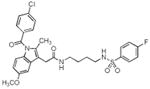
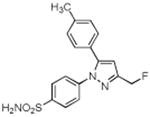
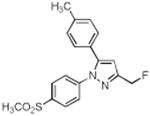
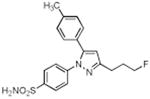
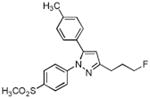
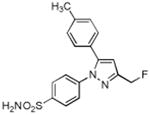
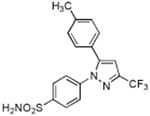
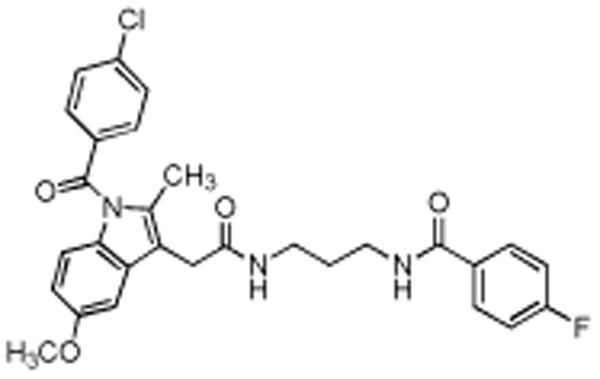
A series of fluorine-containing indomethacin and celecoxib derivatives was synthesized and evaluated for inhibition of COX-2 in vitro and in intact cells. The syntheses of target molecules and their complete chemical characterization are described in Supplementary Data. The IC50 values for inhibition of purified human COX-2 or ovine COX-1 by test compounds were determined using a standard assay (20). Table 1 summarizes the data from this assay. Indomethacin fluoroalkylamide 1 displayed selective COX-2 inhibition (IC50 = 0.14) with no inhibition of COX-1 up to 4 μM inhibitor. Incorporation of functionalities, like an aryl group, in the alkyl chain led to derivative 2, which revealed a significant increase in selectivity and potency against COX-2 (2, COX-2 IC50 = 0.09 μM, COX-1 IC50 > 4 μM). Chain length extension of 2 to higher alkyldiamide analogues 3—6 retained the selective inhibition of COX-2 with slightly decreased potency (3, COX-2 IC50 = 0.26 μM, COX-1 IC50 > 4 μM). Although compounds 1-6 were effective COX-2 inhibitors in intact cells, their p-chlorobenzoyl group was not stable to the conditions of radiochemical synthesis, so we abandoned this series and focused on celecoxib derivatives. Replacement of the CF3 group of celecoxib by a CH2F substituent gave compound 7, which showed potent and selective inhibition of COX-2 with an IC50 of 0.16 μM. However, when the SO2NH2 group of 7 was replaced with a SO2Me group, the COX-2 inhibitory potency was decreased (8, IC50 = 0.60 μM). Compound 9, which contains a fluoropropyl group at the C-3 position of celecoxib showed COX-2 inhibitory activity (IC50 = 1.95 μM) with a significant loss of potency. A further drop of potency was observed when the SO2NH2 pharmacophore of compound 9 was replaced by the SO2Me group in compound 10 (IC50 = 3.4 μM).
Table 1. Biochemical properties of fluorinated indomethacin and celecoxib derivatives.
The IC50's for inhibition of purified ovine COX-1, human COX-2, or COX-2 in lipopolysaccharide activated macrophage-like RAW246.7 cells.
| Compound No. | Structure | Purified Enzyme IC50 (μM) | RAW246.7 Cellsa IC50 (μM) COX-2 | |
|---|---|---|---|---|
| COX-1 | COX-2 | |||
| 1 |
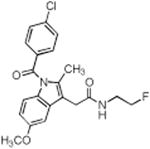
|
> 4 | 0.14 | 0.68 |
| 2 |
|
> 4 | 0.09 | 0.01 |
| 3 |

|
> 4 | 0.26 | 0.16 |
| 4 |
|
> 4 | 0.10 | 0.04 |
| 5 |
|
> 4 | 0.16 | 0.24 |
| 6 |
|
> 4 | 0.13 | 0.11 |
| 7 |
|
> 4 | 0.16 | 0.08 |
| 8 |
|
> 4 | 0.60 | N.T. |
| 9 |
|
> 4 | 1.95 | N.T. |
| 10 |
|
> 4 | 3.40 | N.T. |
| 11 |
|
> 4 | 1.3 | N.T. |
| Indomethacin |
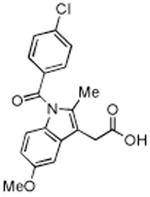
|
0.05 | 0.75 | 0.01 |
| Celecoxib |
|
> 4 | 0.03 | N.T. |
Assays were conducted as described in Materials and Methods. Compounds that are poor inhibitors of COX-2 in the purified enzyme assay were not tested (N.T.) in intact cells.
Inhibition of COX-2 in cell culture
The ability of promising compounds to inhibit COX-2 in intact cells was assayed in the RAW264.7 murine macrophage-like cell line (21). RAW264.7 cells were incubated with lipopolysaccharide (200 ng/mL) and γ-interferon (10 U/mL) for 7 h to induce COX-2 expression and then were treated with vehicle or the test compounds at several concentrations (0 – 5 μM) for 30 min followed by the addition of 10 μM [1-14C]-arachidonic acid (∼55 mCi/mmol). IC50 values for inhibition of RAW264.7 cell prostaglandin production by compounds 1—7 were determined. Compounds 2, 4, and 7 showed the highest potency with IC50 values in the low nanomolar range (Table 1).
Enzyme-inhibitor binding kinetics
The high potency of compounds like celecoxib and indomethacin derives from the fact that they are slow, tight-binding inhibitors. They establish a rapid equilibrium with a loosely bound enzyme-inhibitor complex, then slowly convert to a much more tightly bound complex. Their rate of dissociation from the tightly bound complex is very slow. Fig. 2A shows the time- and concentration-dependent inhibition of mCOX-2 by compound 7. The inhibition of COX-2 proceeded rapidly, and the inhibition plateau for compound 7 at high concentrations approached 20% activity remaining. Fig. 2B displays a plot of the single exponential rate constants for inhibition as a function of concentration, which allows the determination of the equilibrium constant for initial association (KI = k−1/k1). Compound 7 has a KI value of 7.3 ± 1.6 μM, as compared to indomethacin and celecoxib, which have KI values of 13.2 ± 2.3 μM and 4.0 μM, respectively. The inactivation rate (k2) of compound 7 was slower (compound 7, k2 = 0.035 s−1) than that of indomethacin (k2 = 0.061 s−1). The dissociation rate (k−2) of compound 7 was very slow (k−2 = 0.0003 s−1) (Equation 1 and 2). Thus, once associated with COX-2, compound 7 remains tightly bound.
Fig. 2.

Kinetics of the time-dependent inhibition of COX-2 by compound 7. The purified mCOX-2 enzyme was reconstituted with heme and pre-incubated with the inhibitor at 37 °C for various times (0, 0.5, 1, 3, 5, 10, 15, 30, 45, 60 and 120 min) prior to the addition of the substrate (50 μM). (A) Time-dependent inhibition of COX-2 by compound 7 at the indicated concentrations. (B) Secondary plot of kobs versus inhibitor concentration used to generate values for KI, k2 and k−2 using eqs 1 and 2 (see text).
| Eq. 1 |
| Eq. 2 |
In vivo PET imaging of carrageenan-induced inflammation
The rat footpad model is well documented for the role of COX-2-derived prostaglandins as a major driving force for the acute edema that results after carrageenan injection into the paw (24). One of the significant advantages of this animal model of inflammation is the ability to image the inflamed footpad in comparison to the non-inflamed contralateral footpad, which does not express COX-2. In vivo biodistribution of 18F-7 was studied, in the inflamed and contralateral footpad of male Sprague-Dawley rats (body weight, 300 to 350 g). We injected 100 μL of 1% carrageenan in the rear right footpad and waited 2 h for inflammation to develop. 18F-7, dissolved in a formulation solvent consisting of ethanol (20%) and sterile saline (80%) (300 μL, ∼1 mCi), was then injected (tail vein) under anesthesia. At 1.5 h post-injection, the rats were anesthetized with 2% isoflurane and placed in the microPET/CT for data acquisition. 18F-7 targeted the swollen footpad selectively over the contralateral footpad (Fig. 3A). The PET images were analyzed using AMIDE (23) and the images were corrected for injected dose and body weight. Three-dimensional ROIs were drawn around the left and right hind limbs separately. The ROIs included the entire limb from toes to ankle. Uptake in the right hind limb ROI was greater than that of the left hind limb. The mechanism of delivery was confirmed by blocking the COX-2 active site in the inflamed footpad with celecoxib. At 2 h post-carrageenan, we dosed celecoxib (10 mg/kg, 25 μL, tail vein) within 2 min of the dosing with 18F-7 (∼800 μCi, 300 μL, tail vein) to block the COX-2 active site. Reduced uptake in the inflamed footpad was apparent (Fig. 3B).
Fig. 3.
In vivo labeling of COX-2–expression in inflammation by compound 18F-7. (A) Male Sprague-Dawley rats with carrageenan-induced inflammation in the rear right footpad were dosed with 18F-7 (300 μL, ∼1 mCi, tail vein). At 1.5 h post-injection, the rat was anesthetized and imaged in the microPET Focus 220 for 30 min. The PET image shows that the radiotracer targeted the swollen footpad (inflamed) selectively over the contralateral footpad (control). (B) Rats with carrageenan-induced inflammation were pre-dosed with celecoxib (10 mg/kg, 25 μl, tail vein) immediately prior to 18F-7 injection (300 μL, ∼1 mCi, tail vein). At 1.5 h post-injection, the rat was anesthetized and imaged in the microPET Focus 220 for 30 min. The PET image shows minimal radiotracer uptake in the inflamed footpad compared to the control footpad.
The time course of uptake of 18F-7 was evaluated by signal integration at different times. Fig. 4 compares the uptake of 18F-7 in the carrageenan-injected footpad over the non-inflamed footpad obtained from measurements of individual footpad signals at various time points between 1.5 h to 2 h.
Fig. 4.
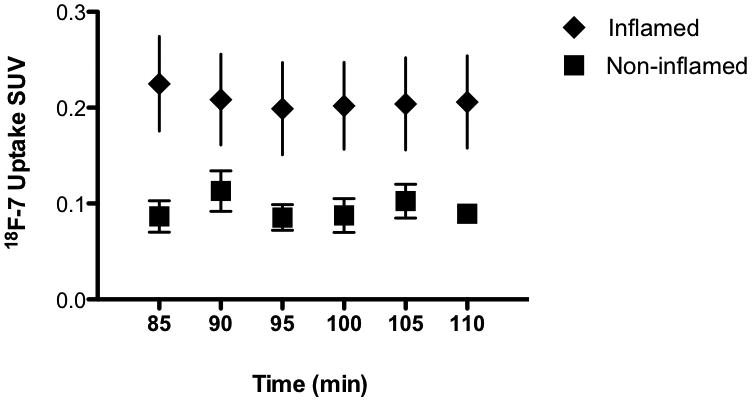
Time course of in vivo uptake of 18F-7 in inflamed versus non-inflamed footpad of a typical Sprague-Dawley rat. Standardized uptake values (SUV) at the regions of interest (ROI) were determined by the Medical Imaging Analysis Tool AMIDE (22). The error bars are the var (variance) generated automatically by the software.
To quantitatively compare uptake, we euthanized the animals at 2 h post injection of 18F-7, removed the hind feet and measured the radioactivity of the individual footpads in a well gamma counter. There was a 1.53 fold ± 0.5 (n = 5) increase in the inflamed compared to the non-inflamed footpad. In contrast, no increase of radiotracer in the inflamed footpad compared to the non-inflamed footpad was detected in celecoxib-pretreated animals (0.9 fold ± 0.14, n=5). Celecoxib dosing results in a highly significant decrease in 18F-7 uptake at the site of inflammation (p = 0.0006).
COX-2 null mice on a CD-1 genetic background were used to validate further the COX-2 specificity of our targeting probe. We injected 50 μL of 1% carrageenan s.c. in the rear right footpad of wild type or COX-2 null mice and waited 24 h for maximal inflammation to develop. 18F-7, dissolved as described, was injected (200 μL, i.p., ∼350 μCi). At 2.5 h post-injection of radiotracer, mice were anesthetized with 2% isoflurane and placed in the microPET/CT Focus 220 for imaging of rear legs (acquisition time, 30 min). At 3 h post-injection, we euthanized the mice, removed their feet, and counted them in a well gamma counter. Software analysis using AMIDE (23) determined no statistical difference in 18F-7 uptake in the inflamed foot versus the contralateral control foot in the COX-2 null mouse. Well counting of the COX-2 null feet, normalized to Bq/g, showed a 1.08 ± 0.09 ratio of radioactivity in the inflamed foot compared to the non-inflamed foot (n = 5). In contrast, the wild type mouse inflamed foot to non-inflamed foot uptake ratio was 1.48 ± 0.04, significantly different from the COX-2 null mouse ratio (p = 0.0002). The absence of COX-2 in the site of the inflammation reduces the 18F-7 uptake by greater than 80%.
The potential for defluorination was evaluated by administration of unlabeled 7 followed by extraction and analysis of both 7 and its oxidatively defluorinated metabolite, 11, by LC-MS. Intact compound 7 was identified in the inflamed footpad (486.3 pmol/g tissue). A low level of the defluorinated metabolite, 11, was detected in the inflamed footpad (37.9 pmol/g tissue). The calculated extent of defluorination was 8.8 ± 5.0 % (n = 3).
In vivo PET imaging of COX-2-expressing tumors
The results in the footpad inflammation model demonstrated that the presence of COX-2 protein is associated with selective uptake of a COX-2-targeted PET imaging agent. We next evaluated the ability of these compounds to target COX-2 in human tumor xenografts. Female nude mice were injected in the left hip with COX-2-expressing human head and neck squamous cell carcinoma (1483 HNSCC) cells and in the right hip with COX-2-negative human colorectal carcinoma (HCT116) cells. The tumor xenografts were allowed to grow to approximately 750-1000 mm3. Animals were dosed by retroorbital injection with 18F-7 (∼350 mCi) and then lightly anesthetized with 2% isoflurane in preparation for imaging. At 3 h post-injection, the animals were placed in the microPET/CT Focus 220 for imaging (acquisition time = 30 min). A significant uptake of 18F-7 was documented in the COX-2 expressing 1483 tumor (Fig. 5A, sagittal view). Minimal uptake was documented in the COX-2 null HCT116 tumor (Fig. 5B, sagittal view). Complete biodistribution is presented in the supplementary Fig. S2. After imaging, the mice were sacrificed by isoflurane overdose. The 1483 HNSCC and HCT116 tumors were removed and weighed, and radioactivity associated with each tumor was counted with a well gamma counter. After normalization of uptake (Bq/g), the1483 tumor showed approximately a threefold higher uptake of the radiotracer compared to the HCT116 tumor (Fig. 6A, n = 3, p = 0.0004,). In a typical experiment, the uptake of the radiotracer in the 1483 tumors was 1.5-2 % of the injected dose/g. When we pre-dosed the mice bearing 1483 xenografts with celecoxib (20 mg/kg, i.p.) within 2 min of the 18F-7 dosing to block the COX-2 active site, the radioactivity (Bq/g) in the 1483 tumor was comparable to that in leg muscle by well gamma counting (1.01 fold ± 0.16, n = 4). The vehicle pre-dosed mice averaged 2.94 fold ± 0.36 uptake in the 1483 tumors compared to leg muscle (Fig. 6B, S3, n = 5, p = 0.00001 for celecoxib vs. vehicle). These results suggest that the difference in uptake of radiotracer in 1483 and HCT116 xenografts is due to their differential in COX-2 expression and that blocking the COX-2 active site in 1483 xenografts precludes 18F-7 binding.
Fig. 5.

In vivo PET imaging of COX-2-expressing or COX-2 negative tumors by 18F-7. Tumor bearing female nude mice were dosed by retroorbital injection with compound 18F-7 (100 μL, ∼350 μCi, r.o.) under anesthesia. At 3 h post-injection, the animals were imaged in the microPET/CT instrument (30 min acquisition); (A) female nude mouse microPET/CT image with COX-2 expressing HNSCC 1483 tumor on the left hip (dotted circle), and (B) COX-2 negative HCT116 tumor on the right hip (dotted circle).
Fig. 6.

In vivo uptake statistics in tumors. (A) Female nude mice bearing 1483 HNSCC and HCT116 tumors were dosed with compound 18F-7 (∼350 μCi, r.o.). The animals were imaged at 3 h post-injection in the microPET/CT Focus 220 instrument. After imaging, the animals were sacrificed by isoflurane overdose. The 1483 HNSCC and HCT116 tumors and leg muscles were removed and weighed, and radioactivity associated with each tissue was counted with a well gamma counter. The plot shows the increased radiotracer (Bq/g) in COX-2-expressing 1483 tumors versus COX-2-negative HCT116 tumors (n = 3, p = 0.0004). (B) Nude mice bearing 1483 xenograft tumors were pre-dosed with vehicle or with celecoxib (20 mg/kg, i.p.) immediately prior to 18F-7 dosing (∼350 μCi, r.o.) and imaged at 3 hrs post-injection. After imaging, the animals were sacrificed by isoflurane overdose, and tissues were removed and counted as in 6A. The plot shows the fold increase of radiotracer in the 1483/vehicle tumor to muscle ratio compare to the 1483/celecoxib tumor to muscle ratio (n = 4, p = 0.0004).
Discussion
These studies demonstrate the feasibility of specific in vivo targeting of COX-2 in inflammatory lesions and tumors using fluorinated organic compounds. Compound 18F-7 displays a high degree of selectivity of uptake by inflammatory tissue and tumors in live animals relative to surrounding normal tissue as determined by PET imaging. Uptake of the compound requires the expression of COX-2 at the target site and declines as the COX-2 active site is blocked or does not occur in the absence of COX-2 expression. Compound 7 is a slow, tight binding inhibitor of COX-2, thus leading to a detectable enrichment in the site of interest.
To achieve this success, a number of fluorinated derivatives of indomethacin or celecoxib were evaluated as COX-2–targeted PET imaging agents. A significant percentage showed inhibitory activity against purified COX-2 and COX-2 in intact cells. Among the compounds that emerged from this development pathway, only compound 7 exhibited sufficient stability in radiochemistry or metabolic stability to survive long enough to distribute to inflammatory lesions or xenograft tumors.
The extent of uptake in inflamed tissue or tumors depends upon several factors such as the permeability of COX-2–expressing cells to the radiotracer, kinetics of binding and release from the COX-2 active site, vascularization of the tissue, and possible expulsion of the fluorinated tracer by transporters. The specificity for COX-2 binding of compound 7 was illustrated by multiple observations: (a) uptake into inflamed over noninflamed tissues; (b) absence of uptake by inflamed tissues in COX-2 null animals; (c) blockage of uptake into inflamed tissue or into COX-2-expressing tumors by celecoxib pre-dosing of the animals; and (d) uptake into COX-2-expressing xenograft tumors over COX-2-negative xenograft tumors. These in vivo studies provide support for the conclusion that binding to COX-2 is the major determinant of uptake into inflamed or tumor tissues. Thus, compound 7 represents a feasible PET imaging reagent for detection of tissues containing high levels of COX-2 in clinical settings. It should find utility in the detection of premalignant lesions and the stratification of patients for the presence of COX-2 in their tumors. The latter is an important determinant of the responsiveness of tumors to adjuvant celecoxib therapy (25).
Supplementary Material
Acknowledgments
Radiochemical synthesis and imaging was conducted in the Center for Small Animal Imaging at the Vanderbilt University Institute for Imaging Sciences. We are grateful to Dr. Carol Rouzer for critical reading of this manuscript.
Grant Support: This work has been supported by grants from the National Institutes of Health (CA89450, CA128323 and CA136465).
Footnotes
Disclosure of Potential Conflicts of Interests: No potential conflicts of interest were disclosed.
Supplementary Data: The supplementary data for this article are available at Cancer Prevention Research Online (http://cancerprevres.aacrjournals.org).
References
- 1.Baker M. Whole-animal imaging: The whole picture. Nature. 2010;463:977–80. doi: 10.1038/463977a. [DOI] [PubMed] [Google Scholar]
- 2.Giepmans BNG, Adams SR, Ellisman MH, Tsien RY. The fluorescent toolbox for assessing protein location and function. Science. 2006;312:217–24. doi: 10.1126/science.1124618. [DOI] [PubMed] [Google Scholar]
- 3.Neri D, Carnemolla B, Nissim A, Leprini A, et al. Targeting by affinity-matured recombinent antibody fragments of an angiogenesis-associated fibronectin isoform. Nat Biotechnol. 1997;15:1271–5. doi: 10.1038/nbt1197-1271. [DOI] [PubMed] [Google Scholar]
- 4.Becker A, Riefke B, Ebert B, Sukowski U, et al. Macromolecular contrast agents for optical imaging of tumors: comparison of indotricarbocyanine-labeled human serum albumin and transferin. Photochem Photobiol. 2000;72:234–41. doi: 10.1562/0031-8655(2000)072<0234:mcafoi>2.0.co;2. [DOI] [PubMed] [Google Scholar]
- 5.Ntziachristos V, Tung CH, Bremer C, Weissleder R. Fluorescence molecular tomography resolves protesase activity in vivo. Nat Med. 2002;8:757–60. doi: 10.1038/nm729. [DOI] [PubMed] [Google Scholar]
- 6.Blum G, Mullins SR, Keren K, Fonovic M, et al. Dynamic imaging of protease activity with fluorescently quenched activity-based probes. Nat Chem Biol. 2005;1:203–9. doi: 10.1038/nchembio728. [DOI] [PubMed] [Google Scholar]
- 7.Achilefu S, Bloch S, Markiewicz MA, Zhong T, et al. Synergistic effects of light-emitting probes and peptides for targeting and monitoring integrin expression. Proc Natl Acad Sci USA. 2005;102:7976–81. doi: 10.1073/pnas.0503500102. [DOI] [PMC free article] [PubMed] [Google Scholar]
- 8.Taketo MM. Cyclooxygenase-2 inhibitors in tumorigenesis (Part II) J Natl Can Inst. 1998;90:1529–36. doi: 10.1093/jnci/90.20.1529. [DOI] [PubMed] [Google Scholar]
- 9.Kurumbail RG, Stevens AM, Gierse JK, McDonald JJ, et al. Structural basis for selective inhibition of cyclooxygenase-2 by anti-inflammatory agents. Nature. 1996;384:644–8. doi: 10.1038/384644a0. [DOI] [PubMed] [Google Scholar]
- 10.Kalgutkar AS, Marnett AB, Crews BC, Remmel RP, et al. Ester and amide derivatives of the nonsteroidal antiinflammatory drug, indomethacin, as selective cyclooxygenase-2 inhibitors. J Med Chem. 2000;43:2860–70. doi: 10.1021/jm000004e. [DOI] [PubMed] [Google Scholar]
- 11.Penning TD, Talley JJ, Bertenshaw SR, Carter JS, et al. Synthesis and Biological Evaluation of the 1,5-Diarylpyrazole Class of Cyclooxygenase-2 Inhibitors: Identification of 4-[5-(4-Methylphenyl)-3- (trifluoromethyl)-1H-pyrazol-1-yl]benzenesulfonamide (SC-58635, Celecoxib) J Med Chem. 1997;40:1347–75. doi: 10.1021/jm960803q. [DOI] [PubMed] [Google Scholar]
- 12.Uddin MJ, Crews BC, Blobaum AL, Kingsley PJ, et al. Selective visualization of cyclooxygenase-2 in inflammation and cancer with targeted imaging agents. Cancer Res. 2010;70:3618–27. doi: 10.1158/0008-5472.CAN-09-2664. [DOI] [PMC free article] [PubMed] [Google Scholar]
- 13.Uddin MJ, Crews BC, Ghebreselasie K, Marnett LJ. [123I]-Celecoxib analogs as SPECT tracer of cyclooxygenase-2 (COX-2) in inflammation. ACS Med Chem Lett. 2011;2:160–4. doi: 10.1021/ml100232q. [DOI] [PMC free article] [PubMed] [Google Scholar]
- 14.Prabhakaran J, Underwood MD, Parsey RV, Arango V, et al. Synthesis and in vivo evaluation of [18F]-4-[5-(4-methylphenyl)-3-(trifluoromethyl)-1H-pyrazol-1-yl]benzenesulfonamide as a PET imaging probe for COX-2 expression. Bioorg Med Chem. 2007;15:1802–7. doi: 10.1016/j.bmc.2006.11.033. [DOI] [PubMed] [Google Scholar]
- 15.Vries EFJD, Waarde AV, Buursma AR, Vaalburg W. Synthesis and in vivo evaluation of 18F-desbromo-DuP-697 as a PET tracer for cyclooxygenase-2 expression. J Nucl Med. 2003;44:1700–6. [PubMed] [Google Scholar]
- 16.McCarthy TJ, Sheriff AU, Graneto MJ, Talley JJ, et al. Radiosynthesis, in vitro validation, and in vivo evaluation of 18F-labeled COX-1 and COX-2 inhibitors. J Nucl Med. 2002;43:117–24. [PubMed] [Google Scholar]
- 17.Kharasch ED, Thummel KE. Identification of cytochrome P450 2E1 as the predominant enzyme catalyzing human liver microsomal defluorination of sevoflurane, isoflurane, and methoxyflurane. Anesthesiol. 1993;79:795–807. doi: 10.1097/00000542-199310000-00023. [DOI] [PubMed] [Google Scholar]
- 18.Hart FD, Boardman PL. Indomethacin: A new non-steroid anti-inflammatory agent. Br Med J. 1963;5363:965–70. doi: 10.1136/bmj.2.5363.965. [DOI] [PMC free article] [PubMed] [Google Scholar]
- 19.Prasit P, Wang Z, Brideau C, Chan CC, et al. The discovery of rofecoxib, [MK 966, VIOXX®, 4-(4′-methylsulfonylphenyl)-3-phenyl-2(5H)-furanone], an orally active cyclooxygenase-2 inhibitor. Bioorg Med Chem Lett. 1999;9:1773–8. doi: 10.1016/s0960-894x(99)00288-7. [DOI] [PubMed] [Google Scholar]
- 20.Kalgutkar AS, Crews BC, Rowlinson SW, Marnett AB, et al. Biochemically based design of cyclooxygenase-2 (COX-2) inhibitors: facile conversion of nonsteroidal anti-inflammatory drugs to potent and highly selective COX-2 inhibitors. Proc Natl Acad Sci USA. 2000;97:925–30. doi: 10.1073/pnas.97.2.925. [DOI] [PMC free article] [PubMed] [Google Scholar]
- 21.Kalgutkar AS, Kozak KR, Crews BC, Hochgesang GP, Jr, et al. Covalent modification of cyclooxygenase-2 (COX-2) by 2-acetoxyphenyl alkyl sulfides, a new class of selective COX-2 inactivators. J Med Chem. 1998;41:4800–18. doi: 10.1021/jm980303s. [DOI] [PubMed] [Google Scholar]
- 22.Dinchuk JE, Car BD, Focht RJ, Johnston JJ, et al. Renal abnormalities and an altered inflammatory response in mice lacking cyclooxygenase II. Nature. 1995;378:406–9. doi: 10.1038/378406a0. [DOI] [PubMed] [Google Scholar]
- 23.Loening AM, Gambhir SS. AMIDE: A free software tool for multimodality medical image analysis. Mol Imaging. 2003;2:131–37. doi: 10.1162/15353500200303133. [DOI] [PubMed] [Google Scholar]
- 24.Winter CA, Risley EA, Nuss GW. Carrageenin-induced edema in hind paw of the rat as an assay for antiinflammatory drugs. Proc Soc Exp Biol Med. 1962;111:544–7. doi: 10.3181/00379727-111-27849. [DOI] [PubMed] [Google Scholar]
- 25.Edelman MJ, Watson D, Wang X, Morrison C, et al. Eicosanoid modulation in advanced lung cancer: cycloxygenase-2 expression is a positive predictive factor, for celecoxib + chemotherapy – Cancer and Leukemia Group B trial 30203. J Clin Oncol. 2008;26:848–55. doi: 10.1200/JCO.2007.13.8081. [DOI] [PubMed] [Google Scholar]
Associated Data
This section collects any data citations, data availability statements, or supplementary materials included in this article.