

Abstract
Ligament injury commonly occurs with no effective treatment to restore its original state. Numerous studies have examined wound healing after injury, reporting a provisional matrix and scar formation within the wound. Few studies however report the inflammatory, proliferative, and remodeling process during ligament healing in a spatio-temporal manner. Our goal was then to more completely elucidate this process in a rat medial collateral ligament (MCL) healing model. In this study, medial collateral ligaments were surgically transected and allowed to heal. At 1, 3, 5, 7, 9, 11, 14, and 28 days postinjury ligaments were collected and examined with microangiography or immunohistochemistry. We demonstrate that neutrophils and mitotic cells peak between 1 and 5 days postinjury. The majority of factors crest between 5 and 9 days postinjury, including circulating macrophages, resident macrophages, T lymphocytes, hematopoietic cells, vascular endothelial growth factor, and blood vessels. The apoptotic cells predominate from day 9 to the end of the study (day 28). Initially, most assayed markers localize to the epiligament and to granulation tissue at the site of damage. Later, the healing region with its granulation tissue and cells continues to expand into the uninjured tissue. From these results, we have expanded current descriptions of ligament healing and offer a more complete representation of the healing process.
Ligament healing involves a complex, coordinated series of events that form a neo-ligament which is more scar-like in character than the native tissue. The repair process may extend from months to years and the injured ligament never fully recovers its original mechanical properties.1,2 In an effort to improve upon an inefficient repair process, researchers have tested a multitude of treatments including tissue engineering approaches, nonsteroidal anti-inflammatory drugs, as well as ultrasonic or electrical stimulation.2,3 However, an incomplete understanding of the healing process makes optimal treatment regimes difficult to devise. With tissue engineering and regenerative medicine technology, it is essential to understand the normal healing process in ligament, thereby providing a basis to formulate and evaluate innovative new treatments.
Several cell types are involved during the inflammatory, proliferative, and remodeling phases of healing (for review:4,5). The inflammatory phase, which immediately follows injury, produces the earliest cell response including the accumulation of neutrophils, monocytes/macrophages, and T-lymphocytes. This stage is characterized by an influx of immune cells to rid injured tissue of debris and secrete cytokines that are pertinent to subsequent activities in the healing cascade. The proliferative phase follows the inflammatory stage and consists of fibroblasts, additional macrophages, and endothelial cells. These cells and their products form granulation tissue within the injured region to serve as a provisional matrix during healing. Remodeling is the final phase of healing. The earlier infiltration of fibroblasts, inflammatory cells, and endothelial cells diminish to basal levels during this stage. This phase of healing lasts many months in ligaments such that scar-like neo-ligamentous tissue is still found 2 years postinjury.4 The cellular profile of the remodeling ligament is more similar to normal than the previous inflammatory or proliferative phases, but complete recovery may never occur. Although the up-regulation of inflammatory cell types during early ligament healing is well documented,4,6,7 the cellular and vascular response to healing from a broader spatial and temporal perspective during the first 4 weeks of healing requires further elucidation. The objective of this study is to better delineate the spatio-temporal dynamics of the healing ligament via microangiography (MA), immunohistochemistry (IHC), and immunofluorescence (IF).
METHODS
Animal preparation
This study was performed according to a protocol approved by the University of Wisconsin Institutional Animal Use and Care Committee. Sixty skeletally mature Wistar rats were used as an animal model for ligament healing. The animals were divided into two different experiments (IHC and MA), each consisting of 30 rats. Each group was randomly placed in one of 10 groups (n=3/group; 1, 3, 5, 7, 9, 11, 14, 21, or 28 days, control). Rats were anesthetized via isofluorane. A surgically transected, rather than torn, MCL is used as an experimental model to create a uniform defect for healing. Each rat was subjected to bilateral MCL transections using sterile techniques. A small, 1 cm skin incision was made over the medial aspect at both the left and right stifles. Then the subcutaneous tissue was dissected to expose the sartorius muscle and underlying MCL. The mid-point of the MCL (determined using a scaled scalpel handle) was completely transected, leaving the knee capsule intact. The muscular, subcutaneous, and subdermal tissue layers were each closed with 4-0 Dexon suture. Another group of three animals underwent no transection and served as intact controls. All animals were allowed unrestricted cage movement immediately after surgery. At 1, 3, 5, 7, 9, 11, 14, 21, or 28 days, animals were sacrificed and the MCLs collected.
Tissue harvest
At the time of sacrifice the MCLs used for IHC were carefully dissected, measured, weighed, and immediately placed in optimal cutting temperature for flash freezing. Sagittal cryosections were then cut at a 5 μm thickness, mounted on Superfrost plus microscope slides and maintained at −70 °C. At sacrifice the 30 animals used for MA were abdominally perfused with two barium solutions: 50% novapaque containing saline and 30% micropaque diluted with 10% formalin (Fisher Scientific, Kalamazoo, MI), which were delivered via the aortic artery. Upon barium perfusion, the MCLs were immediately removed and subjected to 10% formalin fixation for 2 days before being transferred to 70% ethanol.
IHC/IF
IHC/IF analysis was performed on frozen sections using mouse monoclonal or rabbit polyclonal antibodies. Sections were fixed with acetone and exposed to 3% hydrogen peroxide to eliminate endogenous peroxidase activity, incubated with rabbit or mouse primary antibody. A blocking step using 5% goat serum was included for the ED1, ED2, CD43, and neutrophil primary antibodies, subsequent to hydrogen peroxide application. Sections were incubated with biotin, and streptavidin-conjugated to horseradish peroxidase using the Stat Q staining kit (Innovex Biosciences, Richmond, CA). The bound antibody complex was visualized using diaminobenzidine. Stained sections were dehydrated, cleared, cover-slipped, and viewed under light microscopy. Negative controls omitting the primary antibody were included with each experiment. Positive controls of gut or spleen were included. H&E was performed to determine cellular morphology across time.
Mouse monoclonal antibodies to cell surface markers, CD68 (macrosialin), CD163 (hemoglobin/haptoblogin scavenger receptor), CD43 (sialophorin), and CD3 (T-cell receptor) were utilized, to identify the following leukocytes, respectively: circulating monocytes/macrophages (ED1), resident macrophages (ED2), hematopoietic cells, and T-lymphocytes, (all from Serotec, Raleigh, NC). Neutrophils were identified by rabbit anti-rat polymorphonuclear leukocyte (PMN) antibody (Accurate Chemical and Scientific Corp., Westbury, NY). The PMN antibody stains all granulocytes, including neutrophils, basophils, and eosinophils. However, neutrophils highly predominate over basophils, while eosinophils typically associate with parasitic infections rather than wound healing. Proliferating and endothelial cells were detected using antibodies against mouse anti-rat proliferating cell nuclear antigen (PCNA) and rabbit thrombomodulin (TM; American Diagnostica, Stamford, CT), respectively. Rabbit vascular endothelial growth factor (VEGF) (Santa Cruz, Santa Cruz, CA), a potent chemotactic and angiogenic factor and collagen synthesis modulator was also utilized.
Terminal dUTP nick-end labeling (TUNEL)11
The TUNEL assay was performed using the Mebstain apoptosis kit (MBL International, Tokyo, Japan) to detect apoptotic cells. Frozen MCL sections from each time period were fixed with 4% paraformaldehyde and digested with 20 mg/mL proteinase K. The fragmented DNA in the apoptotic cells was end-labeled with fluorescein isothiocyanate (FITC12)-dUTP using terminal deoxynucleotidyl transferase. Samples were then double-stained with PI13 (Sigma-Aldrich, St. Louis, MO) to detect all cells. Negative controls for TUNEL were included and involved the replacement of enzyme with reaction buffer only.
Cell counting
After IHC/IF staining, micrographs were collected using a camera-assisted microscope (Nikon Eclipse microscope, model E6000 [Mehlville, NY] with an Olympus camera, model DP79 [Center Valley, PA]). Six blocked random pictures were obtained from each sample. Images were captured at the HR, distal healing region edge (dHR) and proximal healing region edge (pHR) edges of the healing region (HR), EL, and distal and proximal (Prox) ends of the MCL (Figure 1). One section was counted per animal resulting in three sections per time point. On average, a total of 1,152 cells were analyzed per sample. Each captured image was then quantified with Image J (National Institutes of Health).
Figure 1.
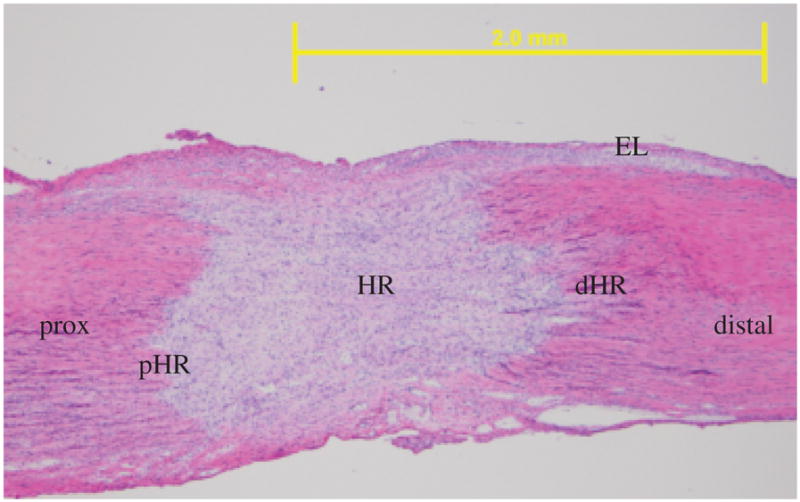
Specific medial collateral ligament (MCL) regions analyzed for cell counting shown in a representative day 5 micrograph. HR, healing region; dHR, distal region of the healing region; pHR, proximal region of the healing region; distal, distal end of the MCL; Prox, proximal end of the MCL; EL, epiligament. Original magnification: ×40.
MA
To demonstrate the angiogenic process during healing, MA was performed. Fine detail radiographic images were obtained at 24 KVp, for 1 minute to observe temporal angiogenic differences between the healing MCLs. Images of radiographs at each time point were captured and evaluated to demonstrate blood vasculature differences during healing.
Statistical methods
One-way analysis of variance (ANOVA) was used to examine differences in wound-healing area and MCL weights across time. For each IHC/IF assay, a two-way ANOVA was first used to assess differences between groups (day, normal), and regions (HR, pHR, dHR, HR, Prox, distal, and EL), with region nested within animal; the interaction term was not included. Then a one-way ANOVA on region was fitted to assess differences unadjusted for day/group. Finally, a one-way ANOVA was used to test for differences across groups within each region. Diagnostic plots of residuals were examined for gross violations of the assumptions of ANOVA, and if so, transformations of the dependent variable were considered. TM results required a logarithmic transformation (y=ln(x+0.1)) and the PMN, ED1, ED2, CD43, propidium iodide (PI), PCNA, CD3, VEGF, and TUNEL data necessitated a square root transformation (y=sq(x)) in order to better meet the assumptions of ANOVA. If the overall p-value for the F-test in ANOVA was significant, pair-wise comparisons were obtained (Fisher’s LSD). Experimental data are presented as the least squares means ±SEM of replicates. All p-values reported are two-sided. A p < 0.05 was used as the criterion for statistical significance. All computations and figures were performed in R for Windows, version 2.5.1 patched.8
RESULTS
MCL measurements
Figure 2A and B illustrates the weight and wound size of the healing ligament. The wound size of the HR represents the measurement of the developing provisional matrix or granulation tissue. Both ligament weight and wound size are low at 1 and 3 days postinjury. MCL weight and wound size increases from days 5 to 11 as granulation tissue develops and enlarges. Ligament weight returns to day 1 values at day 14. In contrast, granulation tissue continues to spread through the undamaged portions of the ligament up to day 28, the end of this study.
Figure 2.

Weight and wound size of the healing medial collateral ligament (MCL). (A) Line graph showing differences in MCL weight and wound size during healing. (B) Micrographs demonstrating the increase in wound size during healing. Images captured at days 1, 5, 7, and 14. Data are presented as the least squares means ± SEM of replicate samples. Significance is based on p < .05. *Significant differences in MCL weight from the day 1 healing ligament. **Significant differences in MCL wound size from the day 1 healing ligament. Original magnification: ×40.
H&E results
H&E staining shows the morphological changes of ligament healing (Figure 3). The uninjured MCL is a hypocellular ligament with collagen fibers oriented in a parallel manner (Figure 3A). One day postinjury, a weak provisional matrix bridges the transected halves of the MCL (Figure 3B). The provisional matrix is composed of a loosely woven template with inflammatory cells spread throughout. Granulation tissue consisting of endothelial cells, fibroblasts, additional macrophages, and matrix material replaces the provisional matrix and expands beyond the original transected site on day 3 (Figure 3C). Degenerating collagen fibers are also present and are characterized by segregated collagen bundles surrounded by cells (Figure 3C). By day 5, a solid bridge of granulation tissue connects the transected edges (Figure 3D). Granulation borders are clearly discernable but cells expand beyond the exterior edges of the HRs into the uninjured portions. As healing continues from days 7 to 11 (Figure 3E–G), the granulation margins are less distinct due to the increasing number of cells migrating toward the MCL insertions and the interweaving of reorganizing collagen fibers with uninjured fibers; a process termed creeping substitution. At days 14 and 28 (Figure 3H–J), healing advances from the proliferative to the remodeling phase and cells infiltrate most of the MCL, while collagen disorganization subsides. During this time, the wound margins are still visible and continue to extend, providing evidence that injury influences the entire ligament rather than only the original transected region.
Figure 3.

H&E staining of a healing longitudinal medial collateral ligament (MCL) section. Images captured at (A) day 0–normal; (B) 1 day; (C) 3 days; (D) 5 days; (E) 7 days (F) 9 days; (G) 11 days; (H) 14 days; (I) 21 days; or (J) 28 days postinjury. Arrows denote degrading collagen. pm, provisional matrix; te, transected edge; gt, granulation tissue. Original magnification: ×200.
Localization of cells within the MCL
To spatially determine the primary localization of cell types tested by IHC/IF, six specific regions of the MCL were analyzed. IHC results indicate that the epiligament (EL) contains the highest concentration of PMN-, ED2-, CD3-, PI-, PCNA-, TUNEL-, VEGF-, and TM-positive cells/region when compared with the MCL body (Table 1). The cells positive for ED1 and CD43 likewise elevate within the EL, but the values do not differ from the amount of cells within the ligament proper. Within the MCL body, the provisional matrix or granulation tissue (which includes the HR, dHR, and pHR) accounts for the majority of the cells stained positive via IHC when compared with the Prox and distal ligament ends.
Table 1.
Spatial localization of IHC/IF-stained cells within the MCL
| Immunohistochemistry assay*#£ | ||||||||||
|---|---|---|---|---|---|---|---|---|---|---|
| MCL region | PMN | ED1 | ED2 | CD3 | PI | CD43 | PCNA | TUNEL | VEGF | TM |
| EL | 9.23 (±3.34)a | 4.65 (±3.36)a | 7.53 (±3.24)a | 3.31 (±3.32)a | 15.23 (±3.47)a | 7.43 (±3.46)ab | 10.48 (±3.47)a | 11.08 (±3.73)a | 10.77 (±3.56)a | 30.59 (±3.09)a |
| HR | 4.09 (±3.34)b | 4.9 (±3.36)a | 2.32 (±3.24)b | 1.42 (±3.32)b | 13.76 (±3.47)d | 7.68 (±3.46)a | 5.24 (±3.47)c | 7.64 (±3.73)c | 6.86 (±3.56)b | 31.79 (±3.09)b |
| dHR | 4.00 (±3.34)b | 5.29 (±3.36)a | 1.07 (±3.24)d | .86 (±3.32)b | 13.57 (±3.47)d | 7.34 (±3.46)ab | 5.05 (±3.47)c | 8.53 (±3.73)c | 6.74 (±3.56)b | 31.93 (±3.09)bc |
| pHR | 3.39 (±3.34)bc | 5.11 (±3.36)a | 1.37 (±3.24)cd | .94 (±3.32)b | 12.77 (±3.47)cd | 6.27 (±3.46)b | 4.8 (±3.47)c | 8.02 (±3.73)c | 5.1 (±3.56)c | 31.91 (±3.09)bc |
| Distal | 2.64 (±3.34)c | 3.58 (±3.36)b | 1.23 (±3.24)cd | .77 (±3.32)b | 11.64 (±3.47)bc | 4.89 (±3.46)c | 3.44 (±3.47)b | 3.69 (±3.73)b | 4.87 (±3.56)cd | 32.04 (±3.09)c |
| Proximal | 2.46 (±3.34)c | 3.31 (±3.36)b | 1.81 (±3.24)bc | .59 (±3.32)b | 11.45 (±3.47)b | 4.22 (±3.46)c | 3.27 (±3.47)b | 6.94 (±3.73)c | 3.49 (±3.56)d | 32.05 (±3.09)c |
Within each assay, significant difference (p < .05) is denoted by (a,b,c,d,e,f).
Results shown indicate the square root of the mean ± SEM, excluding thrombomodulin (TM). TM is expressed as the ln(mean +0.1) ± SEM.
Bold numbers indicate the region highest in cell concentration by that particular IHC assay.
The MCL was subjected to IHC/IF assays to identify various healing components. Six specific regions of the ligament were analyzed for differences in the spatial distribution of the specific cell types.
EL, epiligament; HR, healing region; dHR, distal edge of the healing region; pHR, proximal edge of the healing region; distal, distal end of the MCL; prox, proximal end of the MCL; PMN, neutrophils; ED1, circulating macrophage/monocytes; ED2, resident macrophages; PI, propidium iodide; CD43, hematopoietic cells; PCNA, proliferating cells; TUNEL, terminal dUTP nick-end labeling (apoptotic cells); VEGF, vascular endothelial growth factor (angiogenic marker); MCL, medial collateral ligament; IHC, immunohistochemistry; IF, immunofluorescence.
Neutrophils
Figure 4A shows the PMN IHC results. The control MCL contains few neutrophils. After injury, neutrophils localize throughout the entire MCL, peak at day 1, diminish after day 3 and reach control values by day 28. Spatially, PMNs disappear within the HR after day 1, while cells within the HR edges and the Prox and distal ligament diminish a few days later.
Figure 4.

Temporal localization of neutrophils, circulating macrophages, tissue macrophages, and T-lymphocytes during ligament healing. (A) Immunohistochemistry results of neutrophils (PMN), circulating macrophages (ED1), tissue macrophages (ED2), and T lymphocytes (CD3) during healing by the medial collateral ligament (MCL). Neutrophils first peak at day 1. After the neutrophils decrease in number, the ED1 and ED2 macrophages continue to increase to day 5. The T-lymphocytes remain at steady levels throughout the first three weeks of healing. Results are based on p < .05. *Greatest significant difference from the intact control (CX). (B) Example of creeping substitution by ED1-positive cells. Left panel: ED1-positive cells at day 5 localize to the granulation tissue. Right panel: ED-1-postive cells expand to the proximal and distal regions at day 7. Original magnification ×40.
Macrophages
Figure 4A shows the temporal regulation of macrophages/monocytes throughout healing. ED1- and ED2-positive cells, represent recruited monocytes/macrophages and resident macrophages, respectively. Both cell types are low within the uninjured ligament, but increase in the healing MCL at day 1, peak at day 5, and subsequently decline. The two cell types exhibit the same temporal profile, but substantially fewer ED2-positive cells occupy the ligament proper than the ED1-positive cells. The majority of ED2-positive cells localizes to the EL and is not spatially involved in creeping substitution. The ED1-positive cells localize equally to the EL and granulation tissue but, the cells also creep into the Prox and distal ligament as granulation tissue enlarges (Figure 4B).
T-lymphocytes
CD3 is a cell surface receptor for all T-lymphocytes (Figure 4A). The control ligament contains few CD3-positive cells, but injury stimulates an increase at day 1. T-lymphocytes remain elevated to day 21 and decrease to control values by day 28. Compared with the macrophages and neutrophils, fewer T-lymphocytes reside within the healing ligament.
CD43-positive cells
CD43 is a major sialoglycoprotein on the surface of human T-lymphocytes, monocytes, granulocytes, and some B lymphocytes, which appears to be important for immune function and may be part of a physiologic ligand–receptor complex involved in T-cell activation. Positive staining for CD43 is depicted in Figure 5. Compared with the intact MCL, cells increase immediately at days 1 and 3 and continue to increase until peaking from days 7 to 11. CD43-positive cells slowly decrease until reaching values similar to the intact MCL, by day 28. Further analysis shows the regional differences in cell number, illustrating the creeping substitution of CD43-positive cells. Within the HR, cells initially peak in number at day 3. Cells positive for CD43 continue to increase at day 5 within the wound edges. The Prox and distal ends of the MCL show the greatest concentration of cells from days 7 to 14.
Figure 5.

Temporal localization of proliferating cells, hematopoietic cells, and total cells during ligament healing. Proliferating cells peak in number between days 3 and 5. Hematopoietic cells steadily increase and reach highest levels at days 7 and 11. Total cells follow a similar pattern to hematopoietic cells and likewise peak at day 7. Total cells remain high through day 14. Results are based on p < .05. *Greatest significant difference from the intact control (CX).
Proliferating and total cells
PCNA IHC and PI IF identify proliferating cells and total cells, respectively, within the healing ligament (Figure 5). Cells significantly increase above the uninjured MCL beginning at day 1. Proliferating cells peak at days 3–5 and total cells crest at day 7 before subsequently decreasing. Within the HR, the greatest number of mitotic cells appears during days 1–5. A decrease of mitotic cells within the HR parallels the increase in the Prox and distal HR regions (days 3–5 and 3–7, respectively). As healing progresses, the majority of the cells within the distal end of the ligament increase in number from days 5 to 11. Total cells exhibit a similar pattern as the mitotic cells, indicating the occurrence of a temporal and spatial response to healing by these cells.
Apoptotic cells
The TUNEL assay, which labels apoptotic cells, results in a gradual increase in apoptotic cells from day 1 (Figure 6). The number of apoptotic cells reaches highest levels from days 11 to 14 and day 28. Unlike the previous cellular components tested, apoptotic cells only changed temporally in the HR and distal MCL. Apoptosis is highest within the HR at days 1–3, 7, 14, and 28 and at days 14 and 28 at the distal region.
Figure 6.

Temporal localization of vascular endothelial growth factor (VEGF), apoptotic cells and endothelial cells during ligament healing. The left Y-axis depicts the square root of the average VEGF and apoptotic cell numbers whereas the right Y-axis represents the natural log of the average endothelial cells per area (+0.01). VEGF levels peak between days 3 and 7, declines until day 11. A second smaller increase in cells occurs at day 14. Apoptotic cells increase at days 11–14 and 21. Endothelial cells maintain comparable levels the first 11 days and decrease to control levels at day 28. Results are based on p < .05. *Greatest significant difference from the intact control (CX).
VEGF
The uninjured ligament minimally expresses VEGF (Figure 6). At day 1 postinjury VEGF increases within the EL and HR. VEGF reaches its highest levels from days 3 to 7 and is primarily localized to the expanding granulation tissue and EL. Positive regions steadily decline until day 14 when a smaller secondary surge of VEGF is evident. This second peak of VEGF is attributed to the spatial distribution of VEGF through healing. VEGF declines after day 7, within the granulation tissue but increases in the outer regions of the wound. All regions decrease in VEGF after day 14.
Endothelial cells
The endothelial cell marker, TM, is minimally localized within the uninjured ligament. With the onset of injury, TM levels increase, staying high until day 11 (Figure 6). The HR is highest for TM during early healing between days 1 and 5. As the granulation tissue expands, more endothelial cells creep in the wound fringes from days 5 to 9. As healing progresses from days 7 to 11, TM increases within the Prox MCL end. After day 11, TM subsides to levels similar to the intact MCL.
MA
MA reveals the extent of angiogenesis throughout healing. As Figure 7A illustrates, the intact ligament is hypovascular. Injury stimulates an angiogenic response, but blood vessels do not arrive immediately at the wound; a day 1 healing ligament (Figure 7B) is similar to the intact MCL with only a few more blood vessels within the EL. By days 3 and 5 (Figure 7C and D), larger blood vessels accumulate within and adjacent to the wound, but few are localized beyond the wound fringes. Angiogenesis is greatest at day 7 (Figure 7E). This pronounced vascular response results in the arborization of capillaries from larger blood vessels. Vasculature also extends beyond the HR, into the adjacent uninjured ligament. A clear distinction between the granulation tissue and unaffected tissue is apparent, as the vessels align parallel to the intact collagen fibers but are more chaotic within the HR. Once the ligament reaches 9–11 days postinjury (Figure 7F and G), only larger blood vessels remain, and capillary branching is reduced. At this time, the entire ligament incorporates extensive blood vasculature. Finally by day 14 (Figure 7H), angiogenesis begins to decrease, continuing to the end of the test period resulting in only a few scattered large blood vessels at the later stages of healing (Figure 7I and J).
Figure 7.

Angiogenic pattern of the healing medial collateral ligament (MCL). Microangiography of the (A) normal; (B) 1 day; (C) 3 days; (D) 5 days; (E) 7 days; (F) 9 days; (G) 11 days; (H) 14 days; (I) 21 days; or (J) 28-day postinjured ligament. Scale bar: 2.0 mm. Original magnification ×40.
DISCUSSION
Our results represent the first detailed study of the early cellular events in ligament healing. First, we reveal the modification and expansion of the granulation tissue, or creeping substitution, throughout the initial 28 days of ligament healing. Second, we indicate the predominance of cells within the EL and HR of the ligament. Finally, we demonstrate the infiltration of inflammatory cells, angiogenic factors, apoptotic cells, and the specific cell types involved in creeping substitution. Figure 8 summarizes the peak entry of each factor analyzed during the three phases of healing. Each factor contributes to the healing process in a complex sequence. The result for normal healing is an inflammation-driven process that alters the entire ligament and leaves a mechanically inferior, more scar-like neo-ligament.
Figure 8.

Overview of ligament healing. The inflammatory phase experiences peak influxes of neutrophils at day 1, macrophages at day 5, and proliferating cells between days 3 and 5 of the inflammatory phase. The proliferation phase exhibits peak increases of VEGF between days 3 and 7, total cells at day 7, and hematopoietic cells between days 7 and 11. Endothelial cells and T-lymphocytes remain up-regulated throughout inflammation and proliferation from days 1 to 11. The final remodeling phase reveals an increase of apoptotic cells between days 11 and 14 and day 28.
Ligament healing results in the formation of granulation tissue that develops a creeping substitution pattern. These findings are similar to Nakamura et al.9 who observed that β-gal-labeled cells spread into the uninjured ligament substance away from the wound, eventually populating the entire ligament by 28 days. However, their comparisons were only made at days 7 and 28, whereas the current study defines the wound margin progression and regional differences at nine different time points. All cell types tested become up-regulated in the EL before extending into the ligament proper. These results agree with studies on remodeling tendon.10
The EL is the primary source of blood vessels and cellular components. Injury to a ligament stimulates the release of a variety of cell types from the blood vessels of the EL. Once localized within the ligament body, these cells proliferate and migrate. The process of creeping substitution by the developing granulation tissue results in cells localizing from the HR and into the HR edges. One week after injury most cell types also localize into the Prox and distal ends of the MCL. The concomitant disruption of extracellular matrix and the regional changes in cell localization implies that creeping substitution of granulation tissue is a predominantly catabolic process that delays the original mechanical properties of healing ligaments. Therefore, control of this process becomes a logical target for tissue regeneration.
The cellular infiltration pattern described above denotes an active repair process similar to other wound-healing models. Events occurring have been documented in injured skin, tendon, and cornea,3,11–15 but fewer reports have focused on ligament. Our results agree with studies on other tissues regarding the temporal sequence of early cellular events on the invasion of immune cells. Studies on other tissues show that neutrophils increase rapidly at day 1 postinjury and decrease sharply thereafter. However, accumulation levels depend on wound severity as well as the presence of an infection so neutrophils may persist up to 7–28 days postinjury.3,10 The current study used aseptic techniques so the level of accrued neutrophils is due to the extent of injury in this model. Like neutrophils, T-lymphocytes migrate to the wound during the inflammatory phase day 1 postinjury. Past research indicates that T-lymphocytes play a significant role during wound healing.16,17 Depletion of T-cells results in impaired healing.16,17 The reduction of CD4+ nT cells correlates with diminished healed tissue strength, whereas a decrease in CD8+ T cells corresponds with increased tissue strength.18 The current study does not discern the two cell types, and it will be of interest to examine the influence of specific T cell types during ligament healing.
Circulating monocytes/macrophages (ED1) are catabolic and phagocytic cells that eliminate cellular fragments.3,19 The current ED1 macrophage results agree with studies in healing muscle that show that ED1 cells do not exist in undamaged muscle.20 Consequently, the localization of ED1 cells may be a useful method to detect prior damage and remodeling of tissue. In contrast, the resident macrophages (ED2) are anabolic cells used during ligament repair.3 These cells do not contribute to the removal of cell debris but stimulate cell mitosis and down-regulate the inflammatory response.21,22 In the current study, resident macrophages fail to follow the creeping substitution pattern showed by the other cell types. Creeping substitution appears as a catabolic process to remodel tissue after injury. The anabolic ED2 cells likely remain within the wound to modulate the inflammatory response rather than remodel the tissue. The regional differences of the ligament ED1 and ED2 cells substantiate the different roles the two cell types play during healing.
The late inflammation/early proliferation phase shows a substantial infiltration of blood vessels. The blood vessels initially localize to the EL with injury and continue to infiltrate the ligament proper. The infiltration of blood vessels after acute injury also occurs within larger animals and contributes to the local release of cytokines and growth factors to the injury. As blood vessels increasingly infiltrate the ligament during the late inflammation/early proliferation phase, VEGF and endothelial cells increase and predominate in the forming granulation tissue and the EL. In vitro and in vivo studies23–25 indicate that VEGF exerts its biological effects primarily on endothelial cells to regulate angiogenesis and ECM degradation, proliferation, migration, and tube formation. VEGF also promotes collagen synthesis, inhibits apoptosis, and regulates vascular permeability. The remodeling phase initiates around days 14–21 and continues for a number of months to perhaps years only to result in a ligament that remains inferior to the ligament before injury. The rat MCL regains a maximum of 80 ± 8% of its strength by day 14.26 During the remodeling phase, the inflammatory cells, fibroblasts, and endothelial cells diminish in number through apoptosis. The current study shows an increase in apoptosis immediately after injury followed by a peak observed after day 11. Various models report increases in apoptotic cells throughout healing. Brown et al.27 described apoptosis of inflammatory cells 12 hours postdermal injury, whereas, a later peak has been reported in the skin, patellar tendon, and corneal wound models.28–30 The early apoptotic events likely function in the removal of inflammatory cells. The later increase eliminates fibroblasts and endothelial cells during ECM remodeling. These results indicate that apoptosis may serve to down-regulate the ensuing wound-healing response and inhibit the inflammatory response.
As with any animal model, this study has limitations. The current rat surgically transected injury model is not equivalent to injury of a torn human ligament. Because the biological behaviors correspond to human skin healing, the current results may also be interpretable for human ligament injury. Furthermore, the rat serves as a useful model because animals are precisely controlled (size, weight, strain, etc.), the injury and collection of samples after injury are precise, and the experimental design is specific; factors that cannot be obtained with human studies. The number of rats used for each time period was low, but many significant differences are evident within the study and the general healing phases and processes are clear, thereby justifying the experimental design. The TUNEL assay used also labels necrotic cells, which could potentially skew the apoptosis results. Necrosis is typically associated with induction of an inflammatory response. Because the primary apoptotic response in this study occurs later during the remodeling phase, we believe that the TUNEL assay provides useful insight into apoptosis during ligament healing.
In summary, there is no current treatment to restore an injured ligament to its original morphology and function. A successful regenerative treatment is unlikely to be found without a detailed knowledge of the underlying molecular and cellular mechanisms of ligament repair. Studies have defined specific aspects of ligament healing, such as the biomechanical behaviors26,31,32 and biochemical properties.4 None, however, have considered both temporal and spatial descriptions of inflammatory and angiogenic factors throughout healing from the inflammatory to the proliferative and early remodeling phase. This research therefore expands previous data, although many key factors are yet to be elucidated. A broad screening method such as a gene expression microarray may help identify other key components in the healing process. Information gained from a broader screening could provide further insight into regulatory factors that would be the initial targets for regenerative treatments.
Acknowledgments
The authors acknowledge the technical support of Vicki Kalscheur, BS, and statistical work of Alejandro Munoz del Rio, PhD. We thank Gary Lyons for his manuscript suggestions. Financial support was provided by the National Institutes of Health, Grant No. A536110.
Glossary
- ANOVA
Analysis of variance
- DAB
Diaminobenzidine
- dHR
Distal healing region edge
- EL
Epiligament
- FITC
Fluorescein isothiocyanate
- HR
Healing region
- IF
Immunofluorescence
- IHC
Immunohistochemistry
- MA
Microangiography
- MCL
Medial collateral ligament
- PCNA
Proliferating cell nuclear antigen
- pHR
Proximal healing region edge
- PI
Propidium iodide
- PMN
Polymorphonuclear leukocyte
- Prox
Proximal
- TM
Thrombomodulin
- TUNEL
Terminal dUTP nick-end labeling
- VEGF
Vascular endothelial growth factor
References
- 1.Levenson SM, Geever EF, Crowley LV, Oates JF, Berard CW, Rosen H. The healing of rat skin wounds. Ann Surg. 1965;161:293–309. doi: 10.1097/00000658-196502000-00019. [DOI] [PMC free article] [PubMed] [Google Scholar]
- 2.Lin TW, Cardenas L, Soslowsky LJ. Biomechanics of tendon injury and repair. J Biomech. 2004;37:865–77. doi: 10.1016/j.jbiomech.2003.11.005. [DOI] [PubMed] [Google Scholar]
- 3.Marsolais D, Cote CH, Frenette J. Neutrophils and macrophages accumulate sequentially following Achilles tendon injury. J Orthop Res. 2001;19:1203–9. doi: 10.1016/S0736-0266(01)00031-6. [DOI] [PubMed] [Google Scholar]
- 4.Frank C, Schachar N, Dittrich D. Natural history of healing in the repaired medial collateral ligament. 1983;1:179–88. doi: 10.1002/jor.1100010209. [DOI] [PubMed] [Google Scholar]
- 5.Clark RAF. Wound repair: overview and general considerations. In: Clark RAF, editor. The molecular and cellular biology of wound repair. New York: Plenum; 1995. pp. 3–50. [Google Scholar]
- 6.Frank C, Amiel D, Akeson WH. Healing of the medial collateral ligament of the knee. A morphological and biochemical assessment in rabbits. Acta Orthop Scand. 1983;54:917–23. doi: 10.3109/17453678308992934. [DOI] [PubMed] [Google Scholar]
- 7.Clark RAF. Cutaneous tissue repair: basic biologic considerations. J Am Acad Dermatol. 1985;13:701–25. doi: 10.1016/s0190-9622(85)70213-7. [DOI] [PubMed] [Google Scholar]
- 8.R Development Core Team. A language and environment for statistical computing. R Foundation for Statistical Computing; Vienna, Austria: 2006. [Accessed January 2008.]. Available at: http://www.R-project.org. [Google Scholar]
- 9.Nakamura N, Horibe S, Matsumoto N, Tomita T, Natsuume T, Kaneda Y, Shino K, Ochi T. Transient introduction of a foreign gene into healing rat patellar ligament. J Clin Invest. 1996;97:226–31. doi: 10.1172/JCI118395. [DOI] [PMC free article] [PubMed] [Google Scholar]
- 10.Chbinou N, Frenette J. Am J Physiol Regul Integr Comp Physiol. 2004;286:R952–7. doi: 10.1152/ajpregu.00536.2003. [DOI] [PubMed] [Google Scholar]
- 11.Paterson CA, Williams RN, Parker AV. Characteristics of polymorphonuclear leukocytes infiltration into the alkali burned eye and the influence of sodium citrate. Exp Eye Res. 1984;39:701–8. doi: 10.1016/0014-4835(84)90069-1. [DOI] [PubMed] [Google Scholar]
- 12.Iwuagwu FC, McGrouther DA. Early cellular response in tendon injury: the effect of loading. Plas Reconstr Surg. 1998;102:2064–71. doi: 10.1097/00006534-199811000-00038. [DOI] [PubMed] [Google Scholar]
- 13.Frangogiannis NG, Smith CW, Entman ML. The inflammatory response in myocardial infarction. Cardiovasc Res. 2002;53:31–47. doi: 10.1016/s0008-6363(01)00434-5. [DOI] [PubMed] [Google Scholar]
- 14.Kawamura S, Ying L, Kim HJ, Dynybil C, Rodeo S. Macrophages accumulate in the early phase of tendon–bone healing. J Orthoped Res. 2005;23:1425–32. doi: 10.1016/j.orthres.2005.01.014.1100230627. [DOI] [PubMed] [Google Scholar]
- 15.Baum CL, Arpey CJ. Normal cutaneous wound healing: clinical correlation with cellular and molecular events. Dermatol Surg. 2005;31:674–86. doi: 10.1111/j.1524-4725.2005.31612. [DOI] [PubMed] [Google Scholar]
- 16.Peterson JM, Barbul A, Breslin RJ, Wasserkrug HL, Efron G. Significance of T-lymphocytes in wound healing. Surgery. 1987;102:300–5. [PubMed] [Google Scholar]
- 17.Efron JE, Frankel HL, Lazarou SA, Wasserkrug HL, Barbul A. Wound healing and T-lymphocytes. J Surg Res. 1990;48:460–3. doi: 10.1016/0022-4804(90)90013-r. [DOI] [PubMed] [Google Scholar]
- 18.Davis PA, Corless DJ, Aspinall R, Wastell C. Effect of CD4+ and CD8+ cell depletion on wound healing. Br J Surg. 2001;88:298–304. doi: 10.1046/j.1365-2168.2001.01665.x. [DOI] [PubMed] [Google Scholar]
- 19.McLennan IS. Degenerating and regenerating skeletal muscles contain several subpopulations of macrophages with distinct spatial and temporal distributions. J Anat. 1996;188:17–28. [PMC free article] [PubMed] [Google Scholar]
- 20.McLennan IS. Resident macrophages (ED2 and ED3-positive) do not phagocytose degeneration rat skeletal muscle fibres. Cell Tissue Res. 1993;272:193–6. doi: 10.1007/BF00323586. [DOI] [PubMed] [Google Scholar]
- 21.Massimino ML, Rapizzi E, Cantini M, Libera LD, Mazzoleni F, Arslan P, Carraro U. ED2+ macrophages increase selectively myofibroblast proliferation in muscle cultures. Biochem Biophys Res Commun. 1997;235:754–9. doi: 10.1006/bbrc.1997.6823. [DOI] [PubMed] [Google Scholar]
- 22.Moestrup SK, Moler HJ. CD163: a regulated hemoglobin scavenger receptor with a role in the anti-inflammatory response. Ann Med. 2004;36:347–54. doi: 10.1080/07853890410033171. [DOI] [PubMed] [Google Scholar]
- 23.Alon T, Hemo I, Tiin A, Pe’er J, Stone J, Keshet E. Vascular endothelial growth factor acts as a survival factor for the newly formed retinal vessels and has implications for ret-inopathy of prematurity. Nat Med. 1995;1:1024–8. doi: 10.1038/nm1095-1024. [DOI] [PubMed] [Google Scholar]
- 24.Dvorak HF, Brown LF, Detmar M, Dvorak AM. Vascular permeability factor/vascular endothelial growth factor, microvascular hyperpermeability, and angiogenesis. Am J Pathol. 1995;146:1029–39. [PMC free article] [PubMed] [Google Scholar]
- 25.Amemiya T, Sasamura H, Mifune M, Kitamura Y, Hirahashi J, Hayashi M, Saruta T. Vascular endothelial growth factor activates MAP kinase and enhances collagen synthesis in human mesangial cells. Kidney Int. 1999;56:2055–63. doi: 10.1046/j.1523-1755.1999.00796.x. [DOI] [PubMed] [Google Scholar]
- 26.Provenzano PP, Hayashi K, Kunz DN, Markel MD, Vanderby R., Jr Healing of subfailure ligament: comparison between immature and mature ligaments in a rat model. J Orthop Res. 2002a;20:975–83. doi: 10.1016/S0736-0266(02)00036-0. [DOI] [PubMed] [Google Scholar]
- 27.Brown DL, Kao WWY, Greenhalgh DG. Apoptosis down-regulates inflammation under the advancing epithelial wound edge: delayed patterns in diabetes and improvement with topical growth factors. Surgery. 1997;121:372–80. doi: 10.1016/s0039-6060(97)90306-8. [DOI] [PubMed] [Google Scholar]
- 28.Desmouliere A, Redard M, Darby I, Gabbiani G. Apoptosis mediates the decrease in cellularity during the transition between granulation tissue and scar. AJP. 1995;146:56–66. [PMC free article] [PubMed] [Google Scholar]
- 29.Lokmic Z, Darby IA, Thompson EW, Mitchell GM. Time course analysis of hypoxia, granulation tissue and blood vessel growth, and remodeling in healing rat cutaneous incisional primary intention wounds. Wound Rep Reg. 2006;14:277–88. doi: 10.1111/j.1743-6109.2006.00122.x. [DOI] [PubMed] [Google Scholar]
- 30.Liu PPY, Cheuk YC, Hung LK, Ru SC, Chan KM. Increased apoptosis at the late stage of tendon healing. Wound Rep Reg. 2007;15:702–7. doi: 10.1111/j.1524-475X.2007.00276.x. [DOI] [PubMed] [Google Scholar]
- 31.Frank CB, Loitz BJ, Shrive NG. Injury location affects ligament healing. A morphological and mechanical study of the healing rabbit medial collateral ligament. Acta Orthop Scand. 1995;66:455–62. doi: 10.3109/17453679508995587. [DOI] [PubMed] [Google Scholar]
- 32.Provenzano PP, Heisey D, Hayashi K, Lakes R, Vanderby R., Jr Subfailure damage in ligament: a structural and cellular evaluation. J Appl Physiol. 2002;92:362–71. doi: 10.1152/jappl.2002.92.1.362. [DOI] [PubMed] [Google Scholar]