Abstract
Objectives
In order to evaluate which temperature index is the best predictor for the health impact assessment of heat stress in Korea, several indexes were compared.
Methods
We adopted temperature, perceived temperature (PT), and apparent temperature (AT), as a heat stress index, and changes in the risk of death for Seoul and Daegu were estimated with 1℃ increases in those temperature indexes using generalized additive model (GAM) adjusted for the non-temperature related factors: time trends, seasonality, and air pollution. The estimated excess mortality and Akaike's Information Criterion (AIC) due to the increased temperature indexes for the 75th percentile in the summers from 2001 to 2008 were compared and analyzed to define the best predictor.
Results
For Seoul, all-cause mortality presented the highest percent increase (2.99% [95% CI, 2.43 to 3.54%]) in maximum temperature while AIC showed the lowest value when the all-cause daily death counts were fitted with the maximum PT for the 75th percentile of summer. For Daegu, all-cause mortality presented the greatest percent increase (3.52% [95% CI, 2.23 to 4.80%]) in minimum temperature and AIC showed the lowest value in maximum temperature. No lag effect was found in the association between temperature and mortality for Seoul, whereas for Daegu one-day lag effect was noted.
Conclusions
There was no one temperature measure that was superior to the others in summer. To adopt an appropriate temperature index, regional meteorological characteristics and the disease status of population should be considered.
Keywords: Climate change, Generalized additive model (GAM), Heat-related mortality temperature index
INTRODUCTION
As a consequence of climate change, the increase in the frequency and intensity of extreme weather events predicted in the near future is arousing a growing concern, in the scientific and public health communities [1-3]. In particular, many studies on heat-related mortality have been conducted using the ambient temperature. Recently, in response to the question that the ambient air temperature may not be the best predictor of skin temperature, attempts have been made to combine temperature, humidity and wind to provide a better estimate of the experienced temperature [4,5]. Some studies have used the combined weather indexes, such as the apparent temperature (AT) [6,7] and humidex, a type of discomfort index [8,9] instead of a temperature measure. Chung et al. [10] adopted the AT, whereas Kim et al. [11] and Kim and Joh [12] used the mean temperature and maximum temperature, respectively, to examine heat-related mortality in the Korean population.
On the other hand, Lee et al. [13] and Byon et al. [14] recommended perceived temperature (PT) as derived from a heat budget model as a predictor for heat-related health impact assessments. They reported that compared to the heat index or the discomfort index, which consider the air temperature and humidity, PT takes into account the distinctive regional characteristics of thermal comfort [14]. Moreover, it has been found to be the weather element that best represents excess mortality due to heat stress. For this reason, it predicted to serve as a more reliable forecast index of human biometeorology [13]. However, PT, AT and temperature have not been compared in a heat-related mortality study.
Barnet et al. [5] examined the association between temperature and mortality using mortality data from 107 US cities for the years 1987-2000 in an effort to define which measure of temperature is the best predictor of mortality. They found large differences in the best temperature measure between age groups, seasons and cities, though there was no single temperature measure that was superior to the others.
Therefore, a study involving a comparison of temperature indexes for heat-related mortality is necessary in Korea in order to define which temperature measure is the best predictor of mortality in the context of practical use, such as a forecast index.
We aimed to find which temperature index was the best predictor of mortality for a better understanding of the mechanism of temperature-related mortality and to make recommendations for future studies in Korea.
We also assessed whether the predictive value of temperature depended on age, disease, and region.
MATERIALS AND METHODS
I. Study Scope
This study focused on the relationship between heat stress and mortality in Seoul and Daegu, Korea. Seoul is located at a higher latitude than Daegu. It is also the capital of Republic of Korea and has the highest population density among all cities in Korea, which can make people more vulnerable to heat stress. In contrast, Daegu is located at relatively low latitude in Korea and is well known for its hot weather in summer. The populations of Seoul and Daegu are 10,200,827 and 2,492,724 (2008), respectively. For the purposes of this study, we set June 1 to September 30 as summer and use the summers from 2001 to 2008. These dates were determined according to the period that air pollutant data, necessary as confounding factors, are readily available. June to September is in accordance with the heat health warning system period as determined by the Korean Meteorological Administration (KMA). This time frame also presents typical summer weather characteristics.
All-cause mortality, cardiovascular disease (CVD), and respiratory, which are the diseases strongly related to heat waves, were included in this study. And the mean, minimum, and maximum temperature; the mean, minimum, and maximum AT; and the mean, minimum, and maximum PT were compared. We did not include the heat index because previous studies concluded that the heat index was not a good predictor for mortality in Korea [13,15].
II. Data Sources
We used three types of data: daily death counts, meteorological records, and air pollution concentrations.
The daily death counts for the Seoul and Daegu populations were provided by the Korean National Statistical Office. These records include the date, place, cause of death, and demographic factors such as age and sex. Deaths attributable to external causes (ICD-10 codes V01-Y89) were excluded from the total mortality of the populations. Thus all-cause mortality was used. CVD and respiratory mortality were sorted from the daily death counts using the ICD-10 codes I00-99 and J00-99, respectively. A final mortality series were structured to examine summer-only mortality/high-temperature associations for the days from June 1 to September 30.
Daily meteorological parameters, including the daily maximum, mean and minimum temperature, relative humidity, and dew point were obtained from the KMA.
AT was calculated using the following formula [16,17]:
AT= -2.653 + (0.994*Ta) + (0.0153*Td2),
where Ta is the air temperature and Td is the dew point temperature.
PT refers to a reference environment in which the perception of cold and/or heat would be the same as under the actual conditions. Perceived cold or heat was computed by means of the Klima-Michel-Model, which is a complete heat budget model of the human body based on the comfort equation by Fanger [18].
The comfort equation is based on the following formula [18].
H - Ed - Esw - Ere - L = K = R + C,
where H is the heat production, Ed is the heat loss caused by vapor on body skin, Esw denotes the heat loss by way of body sweat, Ere is the heat loss through respiratory, L is heat loss through dry respiratory, K is the heat conductivity through cloth, and R and C are respectively the heat loss due to radiation and convection. PT can consider temperature, humidity, wind speed, and radiation simultaneously.
The PT data used in this study were obtained from Applied Meteorology Research Laboratory, National Institute of Meteorological Research, KMA by three hours for the period of 2001-2008.
Air pollution data were provided by the National Institute of Environmental Research, which monitors the ambient air pollution at 27 sites in Seoul and 12 sites in Daegu. Daily average concentrations of PM10 and the maximum ozone concentrations were calculated using the monitored data of Seoul and Daegu. The calculated mean concentration of PM10 and the maximum ozone concentration were used as confounding factors to estimate the health effect of high temperatures for each city.
Finally, using all the data sets, we selected the upper 25% (75th percentile) and the upper 10% (90th percentile) of summer data based on each temperature index in order to focus on the relationship between heat stress and mortality. The upper 25% of data were adopted based on a visual assessment in the model fittings, as it were, in the upper 25% of summer, overall daily death counts showed monotonic increase as temperature indexes increased. The upper 10% of the summer data also were used in comparison with the upper 25%.
III. Statistical Analysis
We fitted a high-temperature-mortality association using generalized additive models (GAMs) with natural cubic spline, in which the daily mean, minimum, and maximum temperature, the daily mean, minimum, and maximum PT, and the daily mean, minimum, and maximum AT were considered as predictors of daily mortality. We also applied Akaike's Information Criterion (AIC) for the model-fitting criteria.
It is generally assumed that the daily number of population mortality belongs to a kind of small probability event that can be characterized with a Poisson distribution. The potential nonlinear effects of several confounding factors on the dependent variable can be modeled with nonparametric smoothing functions in the GAM model. Possible confounding factors that might influence the relationship between temperature and death counts, such as long-term trend fluctuation, seasonality, relative humidity, day-of-week effect, and air pollutants were controlled.
The model specifications we used are as follows:
ln(E(Y) ) = β0 + β1 × Xt + Σ Si (Xi)
Here, E(Y) is the expected daily death count; β1 is the coefficient (slope) for the temperature index (Xt); and Si(Xi) denotes the smooth functions for the covariates; date, relative humidity, air pollutants, and days of the week. In the case of PT and AT, humidity was not included in the smooth function because humidity is already included in the calculation formula for PT and AT.
Relative risk (RR) was calculated using exp(β), where β is the related model coefficient. The percentage change was derived from RR using the formula (RR-1)×100. Here, RR indicates the change rate of expected death due to a 1℃ increase in temperature. SAS and S-Plus were utilized in the analysis to manage and fit the data to GAMs.
Related research has shown that use of the default convergence criteria in S-Plus can result in biased fitted linear parameters [19]. To guard against these problems related to concurvity (the nonparametric analogue of multicollinearity) and bias in the regression estimates, we adopted more stringent convergence.
In order to analyze delayed effects of daily temperature indexes, lagged predictor variables were employed: unlagged (lag 0) and lagged by 1-3 days (lag 1, lag 2, and lag 3). For the lag effect analysis we set the lagged mortality data by matching mortality with temperatures of 1-3 days ago before data selection for 75th percentile and 90th percentile of summer.
We compared the RR and AIC by 9 temperature indexes to assess their role as predictor of a heat-related health effect.
RESULTS
I. Description
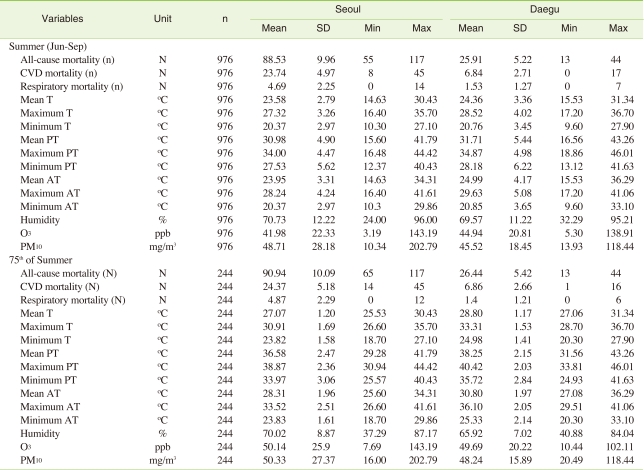
The characteristics of the daily mortality, weather, and air pollution in summer (from June to September) for Seoul and Daegu during 2001-2008 are given in Table 1. The average daily mortalities for the 75th percentile of summer in Seoul and Daegu were 90.94 and 26.44, 24.37 and 6.86, and 4.87 and 1.40 for all-cause, CVD, and respiratory mortality, respectively. The daily mean temperature, PT, and AT for the 75th percentile of summer were 27.07℃, 36.58℃, and 28.31℃ for Seoul and 28.80℃, 38.25℃, and 30.80℃ for Daegu and the relative humidity of Daegu (65.92%) was lower than that of Seoul (70.02%). Seoul and Daegu had no differences in air pollution concentrations (ozone and PM10) for the upper 25% of summer.
Table 1.
Summary statistics for daily death counts, temperature indexes, and air pollution concentrations during summer (2001-2008)
SD: standard deviation, T: temperature, PT: perceived temperature, AT: apparent temperature, CVD: cardiovascular disease.
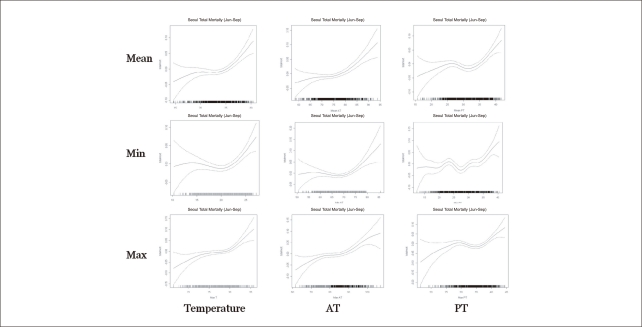
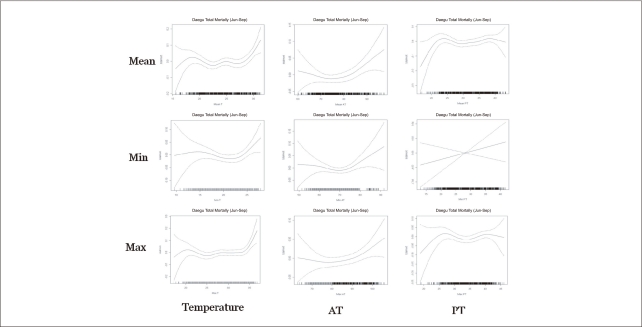
Figure 1 and 2 depict the relationship between the temperature indexes and all-cause mortality for the summer season. During the summer all-cause daily death counts overall increased as temperature and AT increased. In the case of AT for Daegu and minimum temperature and AT for Seoul, thresholds were found in relation to the daily death count during study period. However, the association between the PT and daily death counts did not show a consistently increasing pattern, especially for Daegu.
Figure 1.
Relationship between temperature indexes and all-cause mortality for Seoul (Jun-Sep in 2001-2008) (In each graph, X-axes indicate temperature (℃), apparent temperature: AT (℉), and perceived temperature: PT (℃) and Y-axes indicate temperature-mortality relative risk).
Figure 2.
Relationship between temperature indexes and all-cause mortality for Daegu (Jun-Sep in 2001-2008) (In each graph, x-axes indicate temperature (℃), apparent temperature: AT (℉), and perceived temperature: PT (℃) and Y-axes indicate temperature-mortality relative risk).
II. Increase in Mortality Risk
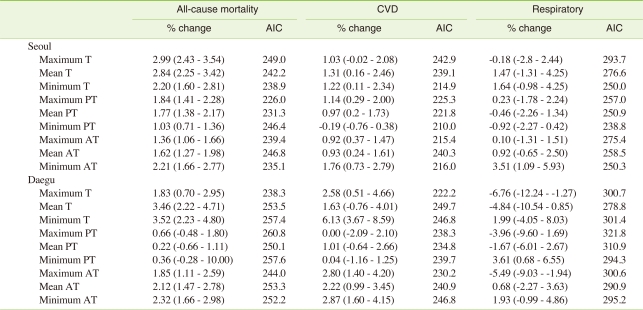
The estimated excess mortality caused by temperature derived from the GAM is presented in Table 2. In the case of Seoul, all-cause mortality presented the highest percent increase (2.99% (95% confidence interval [CI], 2.43 to 3.54)) in maximum temperature while AIC showed the lowest value (226.0) when the all-cause daily death count were fitted with the maximum PT. Among the percent change for CVD mortality attributable to high temperatures, minimum AT showed the highest value, at 1.76% (95% CI, 0.73 to 2.79), which was slightly lower than that of all-cause mortality. Most of the percent changes for the respiratory factor were not statistically significant except for the minimum AT case, which showed a relatively high percent change of 3.51% (95% CI, 1.09 to 5.93). However, in the case of Daegu, all-cause mortality presented the highest percent increase (3.52% (95% CI, 2.23 to 4.80)) in minimum temperature while AIC showed the lowest value (238.3) when all-cause daily death counts were fitted with the maximum temperature factor. Among the percent change for CVD mortality, minimum temperature showed the highest value, at 6.13% (95% CI, 3.67 to 8.59), which was higher than all-cause mortality. Among the percent changes for the respiratory only minimum PT increased significantly showing a 3.61% (95% CI, 0.68 to 6.55) change.
Table 2.
Percent increase in mortality risk by temperature indexes and disease
T: temperature, PT: perceived temperature, AT: apparent temperature, CVD: cardiovascular disease, AIC: akaike's information criterion.
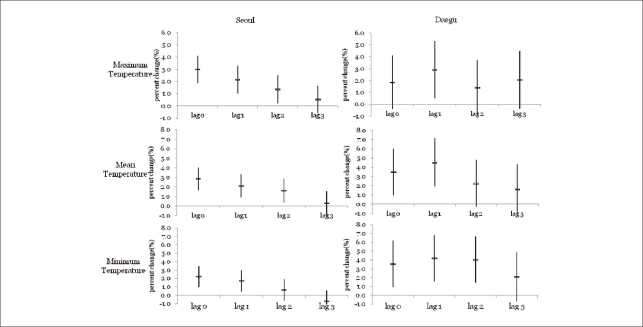
Figure 3 presents the lag effect of high temperature on all-cause mortality risk by maximum, mean, and minimum temperature graphically. No lag effect was noted in the association between temperature and mortality for Seoul; however, for Daegu 1-day lag effect was noted for these valuables; that is, the percent increase in mortality for Daegu was higher in the 1-day lagged model (4.5% [95% CI, 1.9 to 7.1] in the mean temperature case) compared to the no-lagged model (3.5% [95% CI, 1.0 to 6.0] in mean temperature case). In addition these lag effects, no-lagged for Seoul and 1-day lagged effect for Daegu, were in common in all temperature indexes, maximum, mean, and minimum temperature.
Figure 3.
Lag effect of high temperature on all-cause mortality for Seoul and Daegu (bars reflect 95% CIs).
Figure 4 shows the age-specific percent changes for all-cause mortality for mean temperature changes of 1℃ over 60 years by 10 year-age groups. As the age increased, excess mortality increased in Seoul. For those over 90 years old, the percent increase in the all-cause death counts was the highest in both cities, especially in Daegu, compared to any other age group. For those in their 70s and those over 90, the percent increase in all-cause mortality for Daegu was higher than it was for Seoul. For those over 90 years old, the percent increase of all-cause mortality for Daegu was 15.0% (95% CI, 3.8 to 27.4), which was about 3.2-fold higher than that for Seoul (4.7% [95% CI, 0.2 to 9.3]).
Figure 4.
Percent increase in mortality risk for 1℃ increase in mean temperature by age group.
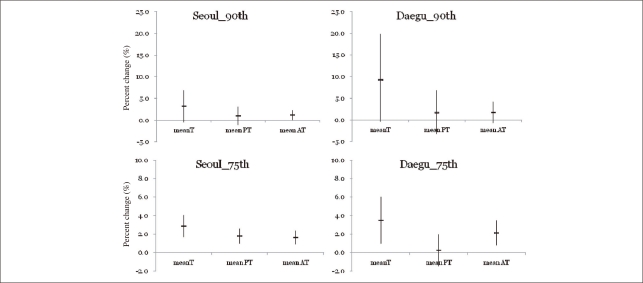
We compared the percent change of mortality for the upper 25% of summer with upper 10% of summer using the mean temperature, PT, and AT data set. As shown in Figure 5, the percent increases for the upper 10% temperature for Seoul (3.16% [95% CI, -0.44 to 6.89]) and Daegu (9.27% [95% CI, -0.40 to 19.89] were higher than those of the upper 25% (2.8% [95% CI, 1.7 to 4.0] for Seoul and (3.5% [95% CI, 1.0 to 6.0] for Daegu in terms of mean temperature. Especially excess mortality attributable to 1℃ increase in the upper 10% of mean temperature for Daegu was 2.6-fold higher than that in the upper 25%. However, the percent changes of the upper 10% of mean PT and AT for Seoul were lower than that for the upper 25%. The percent change for the 10% of mean AT for Daegu was also lower than that for the upper 25%. Most of excess mortalities for the upper 10% of summer were not significant statistically except for the mean AT for Seoul. In terms of the AIC, the result from the fitted values with PT was the smallest among the three, that is, the AICs from the mean temperature, mean PT, and AT were 111.9, 100.6, and 107.3 for Seoul and 150.5, 110.6, and 146.6 for Daegu. However those for CVD and respiratory were quite different from all-cause mortality.
Figure 5.
Comparison of the percent increase in all-cause mortality risk for upper 25% and 10% of temperature indexes.
The risk caused by each temperature indexes showed the highest increase in mean temperature for both Seoul and Daegu in all-cause mortality. However percent increase due to Minimum AT was the highest in respiratory-mortality for Seoul. In case of Daegu, percent increases of CVD mortality showed higher than those of all-cause mortality especially when those were fitted with the minimum temperature, maximum AT, mean AT, and minimum AT.
DISCUSSION
We estimated temperature-related mortality using several weather variables for selection purposes. In terms of model fitting by AIC, for Seoul, the maximum PT and minimum temperature amongst statistically significant results were the best predictors for all-cause and CVD mortality risk attributable to heat stress and maximum temperature. For Daegu, maximum temperature served this purpose both for all-cause and CVD mortality. Considering that PT includes humidity and that the humidity of Seoul was slightly higher than it was for Daegu on hot summer days (Table 1), which reflects the fact that Seoul is located in the near of seashore and Daegu in the interior, the result demonstrating that PT was better than temperature as indicator for excess mortality for Seoul is fairly valid. The lowest AICs were different in terms of disease and city without an outstanding dominator, which suggests that best predictor for the assessment of heat-related mortality depend on the climatic characteristics and disease status of the target region.
On the other hand, in terms of vulnerability, using the temperature had the highest value for the excess mortality due to heat stress for both Seoul and Daegu. Daily deaths in Daegu were sensitive to the minimum temperature; specifically, the percent increase in CVD mortality was the highest for minimum temperature among the temperature indexes included in this study (Table 2). Considering that the minimum temperature usually occurs at night, it can be inferred that people in Daegu is more vulnerable to the tropical night phenomenon.
Several previous studies used AT [10,20] and PT [13] as a high temperature indicator with the assumption that they are better indicators of excess morality because they consider health-related weather variables as well as the temperature. However, our main findings indicate that PT and AT, composite weather indexes, do not always act as the best predictors for an assessment of heat-related mortality. Although Lee et al. [13] and Byon et al. [14] recommended the use of PT as an indicator for heat-related mortality in Korean peninsula because PT can serve as a more realistic thermal comfort index theoretically, it should be carefully utilized considering the climatic and geographical status and adaptation ability to heat stress of study area.
Threshold temperature is also important for a precise understanding of the temperature-mortality relationship [10]. Mortality risk generally decreases as the temperature increases from the coldest days to a certain threshold temperature, which varies by latitude, above which mortality risk increases as the temperature increases [7,21,22]. However, even for the same region, the threshold temperature can vary depending on the study period, such as the years included in the study and whether the data were from the summer months or not. Honda et al. [23] reported that for an evaluation of the heat effect, the 85th percentile value of Tmax or the summer mean temperature may be a better parameter.
In this study, as shown in Figures 1 and 2, the thresholds of mean temperature and daily mortality for Seoul and Daegu were below 25℃ and 27℃, respectively. The minimum values of average daily temperature for the 75th percentile of summer were 25.5℃ and 27.1℃ for Seoul and Daegu. In the upper 25% of summer data, therefore, the daily mortality can be expected to increase linearly. The minimum values of average daily temperature for the 75th percentile of summer were slightly lower than the thresholds of previous study [11], which reported that estimated threshold was 28.1℃ both for Seoul and Daegu. Considering that the average daily temperatures for summer in the previous study [11] were slightly higher (24.67℃ for Seoul and 25.19℃ for Daegu) than those in this study (23.58℃ for Seoul and 24.36℃ for Daegu) and the study period of the study was quite different from this study, it is reasonable that there exists the difference of thresholds between the two.
Regarding the result from fitting of both the 75th percentiles, slightly above the graphical threshold, and the 90th percentile temperature of summer with GAM, the estimated percent increases in heat-related mortality risk were very different. Especially for Daegu, the estimated percent increase in the 90th percentile of summer was 2.7-hold greater than the 75th percentile of summer for the mean temperature (Figure 5). It is known that during hot days, ozone can be produced more easily and the daily deaths increase as ambient ozone increases [24,25]. Thus, we controlled ozone and PM10 as confounding factors. Therefore, the higher increase in mortality for 90th percentile of summer (greater than 29.2℃ in mean temperature) can be considered to be attributable to heat stress only, which means that because heat-related mortality can increase on hotter days, diverse classification of high temperature may be necessary for an assessment of the heat stress effect on daily mortality.
Our results for excess CVD and respiratory mortality due to heat stress were somewhat different from those in previous study [10]. The earlier findings reported that CVD mortality was higher than total mortality and respiratory mortality in Seoul, whereas this study showed that respiratory mortality was higher than both total and CVD mortality in Seoul. The difference between the two may have been caused by the differences in study periods. Chung et al. [10] analyzed the year of 1991-2006 including especially hot summer in 1994. Schwartz [26] reported that patients with diabetes had a higher risk of dying on hot days than other subjects (odds ratio, 1.17; 95% CI, 1.04 to 1.32), which suggest that the risk of total mortality due to heat stress be able to be higher than that of CVD mortality.
Chung et al. [10] as well did not included air pollution. However in case of extremely hot days and vulnerable groups, our previous study found the difference between with and without the adjustment of air pollution [12]. Therefore in order to evaluate the heat-related mortality especially on hot days and for vulnerable groups, the difference between the results with and without air pollution should be considered, that is, air pollution adjustment is needed in study on heat-related mortality as recommended in previous study [27].
Previous studies also found weak lag effect in summer, suggesting that direct exposure to heat may be responsible for a proportion of heat-related deaths [28-31]. For the Seoul population no lag effect was found, indicating a very acute effect of mortality due to high temperature. This is in accordance with findings of our previous study [12]. In contrast for the Daegu population, 1-day lag effect clearly existed in all indexes. It can be inferred that the lagged effect of heat stress in Daegu may be related with relatively low humidity and higher temperatures compared to Seoul. Because weather patterns, adaptive abilities, and behavior vary by region, the effect of temperature on mortality can vary according to the study area. In order to adapt to future global warming further study by region should be conducted in more detail and city-specific strategies for heat stress should be prepared.
CONCLUSIONS
Warmer baseline temperatures in cities are further elevated by extreme heat events or heat waves, which are projected to strike with increasing frequency and intensity in the 21st century. And the future public health burden of temperature-related health effects can increase accordingly. Therefore appropriate temperature indicator to predict health effect is very valuable to public health. In the result of an evaluation of several types of temperature indexes, there was no one temperature measure that was superior to the others in summer.
For a comparison study on the high temperature and mortality by region, simply using the temperature without composite measure is likely to the use of the apparent or the perceived temperature to predict the excess mortality attributable to heat stress for some areas in South Korea. To select an appropriate temperature index, regional meteorological characteristics and the disease status of population should be considered.
ACKNOWLEDGEMENTS
Thanks to Dae-Geun Lee, Jae-Young Byon from Applied Meteorology Research Laboratory, National Institute of Meteorological Research for the PT data supply.
Footnotes
The authors have no conflict of interest to declare on this study.
This article is available from: http://e-eht.org/
References
- 1.Basu R. High ambient temperature and mortality: a review of epidemiologic studies from 2001 to 2008. Environ Health. 2009;8:40. doi: 10.1186/1476-069X-8-40. [DOI] [PMC free article] [PubMed] [Google Scholar]
- 2.Basu R, Samet JM. Relation between elevated ambient temperature and mortality: a review of the epidemiologic evidence. Epidemiol Rev. 2002;24(2):190–202. doi: 10.1093/epirev/mxf007. [DOI] [PubMed] [Google Scholar]
- 3.Gosling SN, Lowe JA, McGregor GR, Pelling M, Malamud BD. Association between elevated atmospheric temperatures and human mortality: a critical review of the literature. Clim Change. 2009;92(3-4):299–341. [Google Scholar]
- 4.Epstein Y, Moran DS. Thermal comfort and the heat stress indices. Ind Health. 2006;44(3):388–398. doi: 10.2486/indhealth.44.388. [DOI] [PubMed] [Google Scholar]
- 5.Barnett AG, Tong S, Clements AC. What measure of temperature is the best predictor of mortality? Environ Res. 2010;110(6):604–611. doi: 10.1016/j.envres.2010.05.006. [DOI] [PubMed] [Google Scholar]
- 6.Zanobetti A, Schwartz J. Temperature and mortality in nine US cities. Epidemiology. 2008;19(4):563–570. doi: 10.1097/EDE.0b013e31816d652d. [DOI] [PMC free article] [PubMed] [Google Scholar]
- 7.Baccini M, Biggeri A, Accetta G, Kosatsky T, Katsouyanni K, Analitis A, et al. Heat effects on mortality in 15 European cities. Epidemiology. 2008;19(5):711–719. doi: 10.1097/EDE.0b013e318176bfcd. [DOI] [PubMed] [Google Scholar]
- 8.Conti S, Meli P, Minelli G, Solimini R, Toccaceli V, Vichi M, et al. Epidemiologic study of mortality during the Summer 2003 heat wave in Italy. Environ Res. 2005;98(3):390–399. doi: 10.1016/j.envres.2004.10.009. [DOI] [PubMed] [Google Scholar]
- 9.Conti S, Masocco M, Meli P, Minelli G, Palummeri E, Solimini R, et al. General and specific mortality among the elderly during the 2003 heat wave in Genova (Italy) Environ Res. 2007;103(2):267–274. doi: 10.1016/j.envres.2006.06.003. [DOI] [PubMed] [Google Scholar]
- 10.Chung JY, Honda Y, Hong YC, Pan XC, Guo YL, Kim H. Ambient temperature and mortality: An international study in four capital cities of East Asia. Sci Total Environ. 2009;408(2):390–396. doi: 10.1016/j.scitotenv.2009.09.009. [DOI] [PubMed] [Google Scholar]
- 11.Kim H, Ha JS, Park J. High temperature, heat index, and mortality in 6 major cities in South Korea. Arch Environ Occup Health. 2006;61(6):265–270. doi: 10.3200/AEOH.61.6.265-270. [DOI] [PubMed] [Google Scholar]
- 12.Kim Y, Joh S. A vulnerability study of the low-income elderly in the context of high temperature and mortality in Seoul, Korea. Sci Total Environ. 2006;371(1-3):82–88. doi: 10.1016/j.scitotenv.2006.08.014. [DOI] [PubMed] [Google Scholar]
- 13.Lee DG, Byon JY, Choi YJ, Kim KR. Relationship between summer heat stress (perceived temperature) and daily excess mortality in Seoul during 1991-2005. J Korean Soc Atmos Environ. 2010;26(3):253–264. (Korean) [Google Scholar]
- 14.Byon JY, Kim JS, Kim JY, Choi BC, Choi YJ, Graetz A. A study on the characteristics of perceived temperature over the Korean peninsula during 2007 summer. Atmosphere. 2008;18(2):137–146. (Korean) [Google Scholar]
- 15.Kim YM. A time series analysis of the impact of high temperature on mortality: considering of socioeconomic difference [dissertation] Seoul: Seoul National University; 2004. (Korean) [Google Scholar]
- 16.Steadman RG. The assessment of sultriness. Part II: effects of wind, extra radiation and barometric pressure on apparent temperature. J Appl Meteorol. 1979;18(7):874–885. [Google Scholar]
- 17.Kalkstein LS, Valimont KM. An evaluation of summer discomfort in the United States using a relative climatological index. Bull Am Meteorol Soc. 1986;67(7):842–848. [Google Scholar]
- 18.Fanger PO. Thermal comfort: analysis and applications in environmental engineering. New York: NcGraw-Hill; 1970. [Google Scholar]
- 19.Dominici F, McDermott A, Zeger SL, Samet JM. On the use of generalized additive models in time-series studies of air pollution and health. Am J Epidemiol. 2002;156(3):193–203. doi: 10.1093/aje/kwf062. [DOI] [PubMed] [Google Scholar]
- 20.O'Neill MS, Hajat S, Zanobetti A, Ramirez-Aguilar M, Schwartz J. Impact of control for air pollution and respiratory epidemics on the estimated associations of temperature and daily mortality. Int J Biometeorol. 2005;50(2):121–129. doi: 10.1007/s00484-005-0269-z. [DOI] [PubMed] [Google Scholar]
- 21.Curriero FC, Heiner KS, Samet JM, Zeger SL, Strug L, Patz JA. Temperature and mortality in 11 cities of the eastern United States. Am J Epidemiol. 2002;155(1):80–87. doi: 10.1093/aje/155.1.80. [DOI] [PubMed] [Google Scholar]
- 22.Hajat S, Armstrong B, Baccini M, Biggeri A, Bisanti L, Russo A, et al. Impact of high temperatures on mortality: is there an added heat wave effect? Epidemiology. 2006;17(6):632–638. doi: 10.1097/01.ede.0000239688.70829.63. [DOI] [PubMed] [Google Scholar]
- 23.Honda Y, Ono M, Sasaki A, Uchiyama I. Shift of the short-term temperature-mortality relationship by a climate factorsome evidence necessary to take account in estimating the health effect of the global warming. J Risk Res. 1998;1(3):209–220. [Google Scholar]
- 24.Kim SY, Lee JT, Hong YC, Ahn KJ, Kim H. Determining the threshold effect of ozone on daily mortality: an analysis of ozone and mortality in Seoul, Korea, 1995-1999. Environ Res. 2004;94(2):113–119. doi: 10.1016/j.envres.2003.09.006. [DOI] [PubMed] [Google Scholar]
- 25.Parodi S, Vercelli M, Garrone E, Fontana V, Izzotti A. Ozone air pollution and daily mortality in Genoa, Italy between 1993 and 1996. Public Health. 2005;119(9):844–850. doi: 10.1016/j.puhe.2004.10.007. [DOI] [PubMed] [Google Scholar]
- 26.Schwartz J. Who is sensitive to extremes of temperature? A case-only analysis. Epidemiology. 2005;16(1):67–72. doi: 10.1097/01.ede.0000147114.25957.71. [DOI] [PubMed] [Google Scholar]
- 27.Rainham DG, Smoyer-Tomic KE. The role of air pollution in the relationship between a heat stress index and human mortality in Toronto. Environ Res. 2003;93(1):9–19. doi: 10.1016/s0013-9351(03)00060-4. [DOI] [PubMed] [Google Scholar]
- 28.El-Zein A, Tewtel-Salem M, Nehme G. A time-series analysis of mortality and air temperature in Greater Beirut. Sci Total Environ. 2004;330(1-3):71–80. doi: 10.1016/j.scitotenv.2004.02.027. [DOI] [PubMed] [Google Scholar]
- 29.Ballester F, Corella D, Pérez-Hoyos S, Sáez M, Hervás A. Mortality as a function of temperature: a study in Valencia, Spain, 1991-1993. Int J Epidemiol. 1997;26(3):551–561. doi: 10.1093/ije/26.3.551. [DOI] [PubMed] [Google Scholar]
- 30.Whitman S, Good G, Donoghue ER, Benbow N, Shou W, Mou S. Mortality in Chicago attributed to the July 1995 heat wave. Am J Public Health. 1997;87(9):1515–1518. doi: 10.2105/ajph.87.9.1515. [DOI] [PMC free article] [PubMed] [Google Scholar]
- 31.Kunst AE, Looman CW, Mackenbach JP. Outdoor air temperature and mortality in the Netherlands: a time-series analysis. Am J Epidemiol. 1993;137(3):331–341. doi: 10.1093/oxfordjournals.aje.a116680. [DOI] [PubMed] [Google Scholar]


