Abstract
Many intra-articular fracture patients eventually experience significant functional deficits, pain, and stiffness from post-traumatic osteoarthritis (PTOA). Over the last several decades, continued refinement of surgical reconstruction techniques has failed to markedly improve patient outcomes. New treatment paradigms are needed - ideally, bio/pharmaceutical. Progress in that direction has been impeded because the pathomechanical etiol-ogy of PTOA development is poorly understood. In particular, the relative roles and pathomechanisms of acute joint injury (from the initial trauma) versus chronic contact stress elevation (from residual incongruity) are unknown, primarily because there have been no objective methods for reliably quantifying either of these insult entities. Over the past decade, novel enabling technologies have been developed that provide objective biomechanical indices of injury severity and of chronic contact stress challenge to fractured joint surfaces. The severity of the initial joint injury is indexed primarily on the basis of the energy released in fracture, obtained from validated digital image analysis of CT scans. Chronic contact stress elevations are indexed by patient-specific finite element stress analysis, using models derived from post-reduction CT scans. These new measures, conceived in the laboratory, have been taken through the stage of validation, and then have been applied in studies of intra-articular fracture patients, to relate these biomechanical indices of cartilage insult to the incidence and severity of PTOA This body of work has provided a novel framework for developing and testing new approaches to forestall PTOA following intra-articular fractures.
FOREWORD
Joseph A. Buckwalter, M. D. , Chair, Department of Orthopaedics and Rehabilitation.
The Orthopaedic Research and Education Foundation (OREF) is dedicated to advancing the specialty of orthopaedics through support of research and education. In 1995, recognizing the importance of encouraging clinical research in orthopaedics, the OREF established the OREF Clinical Research Award. The award is given annually in recognition of outstanding clinical research related directly to musculoskeletal disease or injury.
For their efforts to delineate the relationship between trauma and osteoarthritis, Drs. Donald Anderson, J. Lawrence Marsh and Thomas Brown were awarded the 2011 OREF Clinical Research Award. Their paper entitled “The Pathomechanical Etiology of Post-traumatic Osteoarthritis Following Intra-articular Fractures” was presented by Dr. Anderson at the 57th Annual Meeting of the Orthopaedic Research Society in Long Beach, California on January 15, 2011. He described an extensive series of studies in which the authors developed and validated a novel method of measuring the severity of intra-articular fractures; they then applied this method to the study of patients. These measurements are based primarily on the energy released at the time of fracture, and are calculated from digital image analysis of CT scans. The authors also developed and validated a method of measuring cumulative articular surface con-tact stress elevation following intra-articular fractures, using computational models derived from post-articular fracture reduction CT scans. They then applied these methods to study patients who suffered intra-articular fractures of the distal tibial articular surface. Subsequent work demonstrated that both of these measures predict the development of osteoarthritis: That is, fracture energies above an identified threshold predictably presaged osteoarthritis within two years; and cumulative contact stress due to intra-articular incongruity above a defined threshold also preceded development of post-traumatic osteoarthritis within two years. This innovative work has stimulated investigations by other research groups and has encouraged new efforts to prevent the development of osteoarthritis following joint injuries.
This is the third OREF Clinical Research Award received by University of Iowa Department of Orthopaedics and Rehabilitation investigators. Stuart Weinstein, M. D. received the award in 1998 for his work on the “Natural History and Long Term Outcomes of Treat-ment of Pediatric Orthopaedic Conditions. “ Drs. John Callaghan, Douglas Pedersen, Richard Johnson and Thomas Brown received the OREF Clinical Research Award in 2003 for their study entitled “The Clinical Biomechanics of Wear in Total Hip Arthroplasty. “ These awards document the commitment of the Department of Orthopaedics and Rehabilitation to translational research that will improve patient care.
INTRODUCTION: THE CLINICAL PROBLEM
Post-traumatic osteoarthritis occurs following a variety of joint injuries.1,2 It ensues most commonly and predict-ably following injuries that disrupt the articular surface.3 Data from our institution indicate that roughly 12% of patients presenting with OA of the hip, knee, or ankle have a history of prior joint trauma.4 Despite the best cur-rent efforts at treatment, OA develops in as many as 25% of patients after fractures of the acetabulum,5,6 between 23% and 44% after intra-articular fractures of the knee,7,8 and in more than 50% of patients with fractures of the tibial plafond.9-12 Clinical experience has been that 30% of ankles develop radiographic evidence of significant OA within 2-4 years after a tibial plafond fracture13 with an associated reduction in general and ankle-specific health status.14 By 5-11 years after injury, the incidence increases to 74%.15
The factors that increase the risk of PTOA after a joint injury have largely eluded meaningful quantification. Most data on the subject have been subjective, anecdotal, and/or based on limited retrospective reviews. PTOA following an intra-articular fracture has been attributed to the initial joint injury16,17 and to elevated cartilage stresses from residual surface incongruity.18,19 Neither of these two plausible factors has been amenable to reliable quantification. The severity of the articular injury may well be a primary determinant of outcome, but based on clinical experience, reduction of displaced articular surface fragments has been considered the most important factor leading to a good outcome. Still, case-specific prognoses remain largely speculative.
Tibial plafond fractures are an ideal injury in which to assess the roles of injury severity and chronic contact stress elevation in the pathogenesis of PTOA OA very frequently develops following ankle trauma, but rarely occurs primarily. Both the amount of articular comminution and the quality of obtained articular reduction exhibit a wide degree of variability,11 providing ample opportunity to study how these factors influence out-comes. Finally, as stated above, PTOA occurs following a majority of tibial plafond fractures, often within one or two years after injury.
Our research group has combined the complementary expertise and interests of clinical investigators and laboratory bioengineers to address these challenges. Enabling technologies that provide objective mechanical indices of acute cartilage injury and of chronic elevated contact stress have been developed in the laboratory, and applied to prospective clinical series, to provide insight into the mechanical etiology of PTOA following intra-articular fractures.
Both the fracture severity assessment and the chronic contact stress assessment originate from firm physical foundations. Both are implemented using state-of-the-art computer techniques, both have undergone rigorous physical validation, and both have been successfully applied to prospective patient series. The severity of the initial joint injury is indexed on the basis of the mechanical energy released in bony fracture, obtained from digital image analysis of CT scans. Chronic contact stress elevations are indexed by patient-specific finite element (FE) stress analysis, using advanced nonlinear models derived directly from post-reduction CT scans.
PART I: THE ROLE OF ACUTE FRACTURE SEVERITY
The difficulty of controlling for the influence of injury severity has been a major confounding factor in clinical studies of intra-articular fracture treatments. It is a broadly accepted viewpoint within the orthopaedic trauma community that “the extent of bone, cartilage, and soft tissue damage is directly related to the energy imparted to these structures"20 (Figure 1). Yet, the energy involved in producing a given injury has not been measurable, making assessment of the severity of the injury inexact, subjective, and largely empirical.
Figure 1.
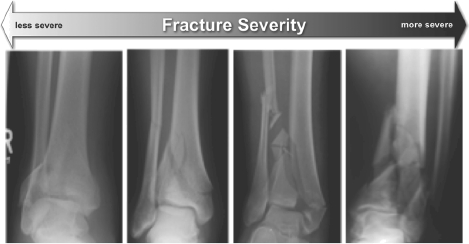
These radiographs illustrate the tibial plafond fracture severity spectrum. Simple intra-articular fractures result from low energy impacts (left). As energy increases, the fractures become more complex, with greater comminution (right).
To scientifically assess the effect of treatment of any condition, an investigator must be able to measure pertinent (patho) physiologic variables. The joint injury in articular trauma is traditionally assessed using categorical fracture classifications.21 These classifications at best allow only crude assessments of injury severity, and they have been shown to have very poor inter-observer reliability.22 In the presence of comminution, we23 (and others) have shown that categorical assessments are virtually useless for clinical research. Thus, the relationship between fracture severity and eventual outcomes remains very poorly understood.
To address this knowledge gap, in 1998 our group introduced the concept of relating the degree of bony comminution to the amount of energy delivered at the time of injury.24 The basic idea grounded in principles of engineering fracture mechanics - was that the mechanical energy absorbed in producing a fracture is converted to de novo surface energy of the fracture fragments. CT scans, acquired routinely for many articular fractures, provide the opportunity to directly measure de novo interfragmentary surface area, from which surface energy can be quantified. For studying PTOA in tibial plafond fracture cases, the primary utility of fracture energy is as a metric of the cartilage-injurious energy pulse that must have crossed the articular surface to create the bony fracture. Over the ensuing decade, we have pursued this fracture energy paradigm as a novel means to quantify injury severity in intra-articular fractures.
Laboratory apparatus for controlled comminution energy delivery
To first resolve several methodological issues arising in this new paradigm, studies25 were begun to develop and evaluate a brittle polymer foam material which mimics pertinent aspects of natural bone’s impact behavior: propensity to shatter into fragments of sizes and shapes resembling those seen in human comminuted fractures, tendency to produce more fragments which are smaller and sharper as energy absorption is increased, order-of-magnitude similarity of intrinsic material mechanical properties, and similarity to natural bone’s radiographic CT appearance. Working with a specialty vendor, the fracture behavior of various polymer foam compositions and processes were systematically evaluated, under controlled impact conditions. We settled on a high-density, closed cell polyurethane foam. Finely sieved BaS04 doping of the resin was used to replicate the radiopacity of bone.
In the course of this work, specialized experimental capabilities were developed to physically quantify the energy of fractures produced under controlled laboratory conditions. An instrumented drop tower impact system was designed and built to study bone (and bone surrogate) fracture comminution.24 Impact tests with the bone fracture surrogate showed a very close linear proportionality (R2 = 0. 94) between de novo fragment surface area and delivered impact energy, very much as would be expected on theoretical grounds.26
Digital image analysis for automated measurement of interfragmentary surface area
Next, special purpose image analysis capabilities were developed to automate the task of interfragmentary surface area measurement in CT images.27 Accurate segmentation to distinguish bone from its surrounding tissues within CT images poses significant technical challenges, due to similar attenuation characteristics between neighboring tissues. This is especially true where metaphyseal articular fracture fragments that are not cleanly bounded by cortex abut one another, producing barely distinguishable fracture lines.
Our original fracture fragment segmentation efforts28 implemented a seeded region-growing algorithm, which was highly accurate geometrically, although it later proved cumbersomely slow for clinical application.29 Subsequently, a semi-automated intensity thresholding algorithm was developed30 which provided comparable accuracy, but with a nearly 100-fold speed gain. This analysis routine runs on a desktop personal computer, and it operates with conventional CT image data encoded in standard DICOM file format.
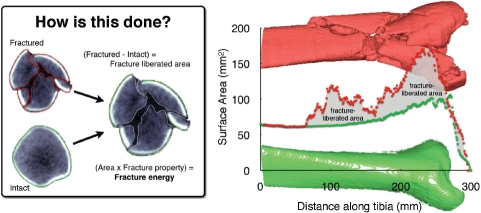
Bone margins are identified slice-by-slice in CT datasets (Figure 2). Multiplication of the bone perimeters (endosteal, periosteal, and subchondral) in a given CT slice by that slice's thickness yields the bone surface area over the slice volume. Summing areas across all slices provides the total amount of bone free surface area. Finally, it is necessary to subtract the pre-existing intact bone surface area from the fractured area to determine the de novo interfragmentary surface area. Precisely machined cubes of the polyurethane foam surrogate were used as a gold standard for establishing the accuracy of these measurements.
Figure 2.
Bone perimeters (matched intact & fractured), plotted along the length of the distal tibia, show how the fracture energy measure is calculated. Inset: CT slice from fracture case, with identified tibia bone fragment edges.
Interfragmentary surface area measurement in a comminuted fracture
Experiments were next performed using bovine cortical bone.31 We hypothesized that fragment sets resulting from replicate equal-energy impacts would have similar interfragmentary surface areas, whereas fragment sets from impactions at different energy levels would have correspondingly different interfragmentary areas. After accounting for the through-pass energy, three study groups (n=12 each) were verified to have received distinctly different fracture energies. Intact bone specimens were CT-scanned prior to impact. After fracturing, the fragments were CT-scanned encased in BaSO4-doped resin (to mimic the CT intensity of soft tissue).
Despite the highly idiosyncratic nature of the individual fragmentation patterns, the de novo surface area generated in the specimens that absorbed greater energy was significantly higher (p<0. 0001) than that in the lower energy groups (Figure 3), with energy-proportional linearity (R=0. 83). Further, consistent with fracture mechanics theory, fragment size distributions for the three groups followed the same principles of comminution observed in other brittle materials: greater energy absorption produced a greater number of fragments, of correspondingly smaller size.
Figure 3.
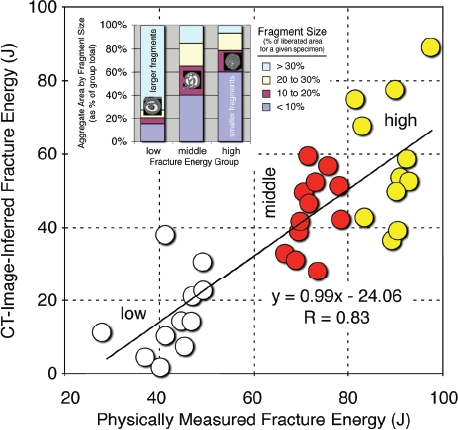
Controlled fracture experiments performed in bone showed a highly linear relationship between CT-inferred fracture energy and the physically measured energy absorbed in fracture. Inset: The data also showed that fragment sizes correlated with fracture energy, shifting from predominantly larger fragments at lower energies to smaller fragments at higher energies. [Adapted with permission from Anderson DD et al. Quantifying tibial plafond fracture severity: absorbed energy and fragment displacement agree with clinical rank ordering. J Orthop Res. 26:1046-52, 2008.40]
Incorporation of bone density heterogeneity into the fracture energy determination
The fracture energy assessment technique was then extended for use in human clinical cases.32 A key difference between the surrogate material and human bone tissue is the latter's heterogeneity. Since the energy-absorbing capacity of bone is both density- and age-dependent,33-35 bone density-based weighting was integrated into the algorithm. Formal fracture energy was calculated by multiplying the interfragmentary surface area times the energy release rate (G, units of Joules/ m2), a material property that quantifies the energy required to liberate a given surface area. Theoretical and experimental work with bone from various animal species had shown G to be directly proportional to the first power of apparent density.35
Ideally, bone density would be regressed pixel-by-pixel, based on CT Hounsfield intensities along fragment edges. As a practical matter, however, partial volume effects and high intensity grants at the edge often preclude reliable scaling using this approach. Therefore, the fracture energy algorithm was augmented to partition G according to densities found for the tibial plafond's three dominant classes of bone: dense diaphyseal cortical, less dense metaphyseal cortical, and cancellous. Apparent densities of these three bone classes are determined on a patient-specific basis,36 by regression from mixed Gaussian distributions. Finally, energy release rates are then determined by scaling (previously-measured) impact energy/density data to the (patient-specific) bone density values.
Measuring fracture displacement and articular involvement in comminuted fractures
Fragment displacement/dispersion is another factor influencing the outcome of intra-articular fractures.37 As with fracture energy, this is amenable to quantification from CT studies. When fracture fragments are displaced, the bony regions in given cross-sections are generally translated away from their intact positions, the bone structure is disrupted, and fragments are dispersed relative to one another.
The bone surfaces identified in fracture energy analysis were used to quantify fragment displacement. This required alignment of the intact proximal portion of the fractured tibia with a mirrored image of the uninjured contralateral side (Figure 4). Once aligned, fragment displacement was indexed by calculating the volume of tissues through which fracture fragments were collectively dispersed, relative to their pre-fracture position. To determine dispersal volume, for each CT slice, a convex hull (the smallest convex polygon circumscribing a given object) was determined for both the (mirrored) intact bone, and for a composite of the aligned intact and fractured tibias (inset, Figure 4). The difference in these volumes provided a metric of the amount of fragment dispersion, implicitly incorporating limb axial malalignment, as well.
Figure 4.
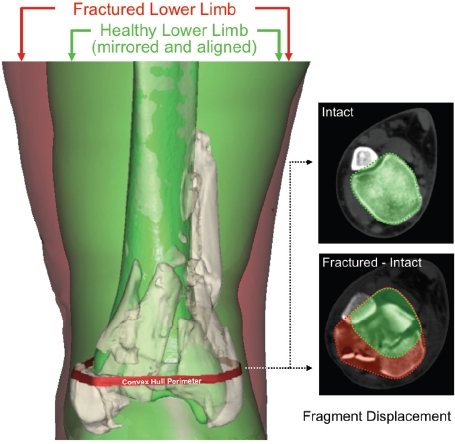
Depiction of the fragment displacement/dispersion metric calculation. [Adapted with permission from Anderson DD et al. Quantifying tibial plafond fracture severity: absorbed energy and fragment displacement agree with clinical rank ordering. J Orthop Res. 26:1046-52, 2008.40]
The degree of comminution of the articular surface per se is a key radiographic feature associated with injury severity and with likelihood of PTOA This was quantified in terms of the amount of interfragmentary surface area located within 1. 5 mm of the articular surface, expressed as a percentage of the pre-existing (intact/contralateral) surface area of the distal tibia.
Validation: Agreement with experienced surgeon assessment of fracture patient datasets
Despite inter- and intra-observer variability in classifying comminuted intra-articular fractures, the opinion of experienced orthopaedic traumatologists is necessarily the gold standard against which to gage new objective measures of injury severity. Previous work from our group38,39 had shown that when experienced clinicians stratify injury severity using simple comparative rank ordering, the agreement between observers is high. A study was undertaken to compare CT-based objective measures of severity versus the gold standard (clinician rank ordering).40 The study group consisted of twenty tibial plafond fractures (13 in males, patient ages from 20 to 64 years) treated at our institution. Cases were chosen to span the spectrum of injury, from mild partial articular fractures to severely comminuted fractures involving the entire tibial plafond. In independent grading sessions, the fracture cases were ranked for injury severity by three experienced academic orthopaedic traumatologists, based on appearance in plain radiographs. The only instruction given to the raters was to rank the cases in order of least to most severely injured.
Concordance rates were calculated to measure the level of agreement between raters, and between each rater's assessment of fracture severity versus the CT-based severity metrics. A given pair of injury severity rankings was concordant if the case with the higher ranking for one rater also had the higher ranking for a second rater. (This sample-based statistical measure formally estimates the probability that any two fracture cases would be ranked with the same ordering.)
Each case's CT dataset took typically eight to ten person-hours to image process (Figure 5), using the above-described image analysis tools then available. The range of different fractures encountered in the study is illustrated via plain radiographs in Figure 1. Fracture energies ranged from 11 to 53 J, and fragment displacement volumes ranged from 3. 4 to 47. 4 cm3, reflecting a wide variation in severity.
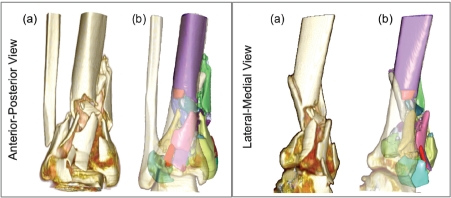
Figure 5.
(a) Standard, unsegmented rendering from radiology workstation: visually informative, but with no active functionality. Following segmentation, (b) individual fragments (49 of them in this case) may be readily, and independently studied (transparent surface is intact contralateral, mirrored and aliened Droximallv).
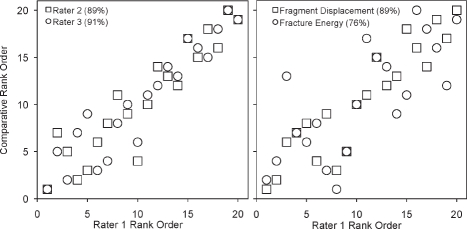
The concordance rate between the three raters (Figure 6) ranged from 87 to 91%. The rank ordering of the fracture energy metric also agreed well with the raters' judgment, with concordance rates from 73 to 76%. The concordance rate between raters' assessment of fracture severity and the aggregate fragment displacement metric ranged from 82 to 89%. Summarizing, the (objective) CT-derived measures of comminuted fracture severity agreed with the experienced orthopaedic surgeons' (subjective) rankings. This very important result convincingly supports the image analysis approach for objective measurement of fracture severity. This in turn opens the way to controlling for injury severity in large multi-center studies.
Figure 6.
Agreement between injury severity rankings and CT-based metrics. The graphs compare the rank ordering of rater 1 versus that of raters 2 and 3, and of the individual CT-based metrics. Concordance values are enclosed in parentheses following the rater/metric. [Adapted with permission from Anderson DD et al. Quantifying tibial plafond fracture severity: absorbed energy and fragment displacement agree with clinical rank ordering. J Orthop Res. 26:1046-52, 2008.40]
Refinements in fracture severity assessment, toward practical clinical use
While agreement with surgeons' severity ranking was encouraging, it was obvious that the analysis process was far too lengthy for application in the clinical setting. For that reason, an expedited fracture severity assessment technique was developed, based upon textural image analysis.41 This new method quantified “disorder” in a given CT slice, based on a mathematical entity known as the gray level co-occurrence matrix (GLCM). The GLCM indexes the spatial homogeneity of pixel intensities (image texture) within a given image.
Using the GLCM reduced the time required to obtain an objective fracture severity assessment from roughly 8-10 hours to about 10 minutes, while maintaining excellent agreement (linear regression R2 = 0. 80) with the area-based energy metric. Importantly, the expedited technique required absolutely no human analyst intervention or vetting.
A second step toward use of the CT-based methods in orthopaedic practice is to avoid the need for CT scans of the intact contralateral limb. As such scans are not routinely obtained during fracture evaluation, reliance upon them impedes large multi-center and retrospective studies that could provide high statistical power for establishing the relative efficacy of alternative treatment regimes. To bypass the need for contralateral-side CT, a study was designed to establish a normative anthropometric model of the intact distal tibia, from which to derive tare bone surface area data.42 It was hypothesized that an allometrically scaled tibia model could serve as a surrogate datum capable of accurately measuring interfragmentary surface area. The free bone surface area along the intact distal tibia of 22 subjects was regressed from existing CT data. When the regression data were applied to the above tibial plafond fracture cases, the concordance between fracture energy for the regressed versus true tare bone surface areas was 90%. This result indicated that, when necessary, normative bone surface area can be substituted for measured intact-contralateral surface area.
PART II: THE ROLE OF CHRONIC CONTACT STRESS ELEVATION
Previously lacking a means to reliably measure injury severity, and without any bio/pharmaceutical treatments proven to enhance cartilage survival, orthopaedic management of intra-articular fractures has largely concentrated upon fracture reduction. Attempts have been made to measure residual articular surface incongruity on post-reduction radiographs, as a surrogate for elevated contact stress. Unfortunately, the ability to measure joint incongruity on radiographs has been shown to be poor.43,44 Moreover, the measurement of geometric steps or gaps seen on radiographs is a weak surrogate for the actual chronic pathomechanical stimulus of interest at the cellular and molecular level: contact stress abnormality.
In the presence of residual surface incongruity, joint loads that are normally well tolerated generate local ar-eas of elevated contact stress.45-47 The degree to which injured articular joints tolerate elevated contact stress is unknown, as is the accuracy of articular reduction required to forestall clinically significant PTOA Finite element (FE) stress analysis techniques, suitably applied and rigorously validated, provide the basis to address this knowledge gap.
The initial FE analyses by our group to study this is-sue involved computing the contact stress aberrations engendered for joints with an idealized fracture step-off, subjected to a representative static load.48,49 The great majority of FE stress analyses performed to date in the field of orthopaedic biomechanics have involved working with just such models, derived from the anatomy of single individuals. This had been necessary because approaches lending themselves to a high degree of automation in FE model generation are relatively re-cent Seminal work in automated meshing (the process whereby a continuous material region is represented by discrete contiguous elements) for orthopaedic stress analysis was reported in 1990 by Keyak et al. , who recognized that CT voxels could be converted directly into hexahedral ("brick") continuum elements.50 The attraction of voxel-based meshing was immediately evident, and a great many subsequent studies have adopted and refined that essential idea.
To date, however, voxel-based meshing work for orthopaedic stress analysis has involved almost exclusively linear (load-proportionate) analyses. Articular joint contact stress by it nature behaves very nonlinearly Stresses are non-proportional to load, because (among other things) the engaged contact area changes as load increases. Another consideration is that contact analyses have lent themselves poorly to voxel-based meshing, owing to the “stair-step” jaggedness necessarily present at all external surfaces of voxellated objects.
Yet a third relevant issue relates to the choice of loading conditions for an articular joint model. For the case of the human ankle, level walking gait constitutes the predominant functional activity responsible for aggregate cartilage mechano-stimulus. Articular surface apposition and resultant contact force both vary appreciably throughout functional activities. Therefore, conventional “snapshot” contact stress distributions restricted to a specific instant of the duty cycle provide very limited information regarding the habitual mechano-stimulus at any given site.
Patient-specific FE mesh generation from CT scans
Over the last eight years, we have worked to develop and implement a finite element formulation that automatically generates patient-specific meshes,51 that overcomes the contact surface stair-stepping difficulty, and that implements whole-duty-cycle analysis. To mesh patient-specific articular surfaces (including those with fracture incongruities), layers of continuum hexahedral ("brick") cartilage elements are zoned outwardly from quadrilateral bone surface meshes (subchondral bone plate). Successful treatment of this class of incongruous articular joint contact problems also has required special attention to initial surface apposition, and to contact member constraints during initial contact engagement and subsequent duty cycle simulation.52 Appropriate attention has also been directed to realistic replication of whole-duty-cycle joint surface engagement kinematics.
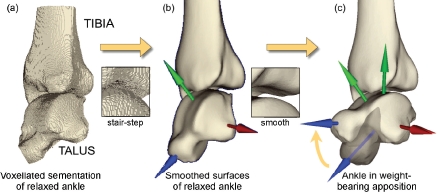
The procedure for patient-specific contact FE model assembly involves a series of interdependent steps, that begin with image processing/segmentation, surface identification, and mesh generation. The source image dataset is a series of slices obtained from clinical CT scans (in DICOM format). This volumetric image dataset is segmented to isolate structures of interest, yielding a provisional “conventional” voxel-based FE mesh (Figure 7(a)). To eliminate the boundary, or stair-step, artifact from the potential contact surface, a corresponding ‘smoothed’ surface is generated using isosurface interpolation (Figure 7(b)), which discretizes the initial surface into a very large array of connected triangular facets. The accuracy of this pre-processing approach was verified using precisely known analytic geometries (spherical and cylindrical), with the FE solutions show-ing close correspondence to gold standard (Hertzian) mathematical contact solutions.51
Figure 7.
(a) The voxellated segmentation of the relaxed posture intact ankle is smoothed into (b) a geometric model of the bone surfaces, suit-able for manipulation and FE solution, (c) The re-orientations required to bring the as-segmented ankle into a neutral apposition are shown, with the partially translucent image showing the original state of the talus. [Adapted with permission from Anderson DD et al. Intra-articular contact stress distributions at the ankle throughout stance phase-patient-specific finite element analysis as a metric of degeneration propensity. Biomech Model Mechanobiol. 5:82-9, 2006.52]
Next, upon completion of bone isosurface extraction for both sides of the contact interface, layers of cartilage are superimposed using a purpose-written mesh generation algorithm. A key issue here is that most algorithms for meshing complex 3D objects utilize tetrahedral meshes. Unfortunately, tetrahedral meshes perform notoriously poorly in contact stress analyses, since their contact surface facets (triangles) are mathematically “too stiff. “ For this reason, we developed specialty algorithms by which external surfaces of epiphyseal regions (sub-chondral bone surfaces) are meshed into quadrilateral rather than triangular facets, hence allowing superimposition of hexahedral rather than tetrahedral cartilage elements. This is done by projecting an externally defined rectilinear grid onto the isosurface (triangular-facet) discretization of the subchondral surface, and then meshing layers of continuum hexahedral ("brick") cartilage elements outwardly from the projected grid intersections with that surface. When data for the thickness variation in the articular cartilage are available (e. g. , from MRT),53 patient-specific cartilage thickness variation is incorporated. Otherwise, normatively-based cartilage thickness is used. These techniques are amenable to both intact and fractured bone surface geometries. Thus, idealized articular surface incongruity (in terms of simplified features such as step-offs or gaps) need no longer be assumed. Rather, the idiosyncratic patient-specific geometry of actual fracture surfaces is directly incorporated.
FE Validation: accurate regional reproduction of prevailing contact stress distributions
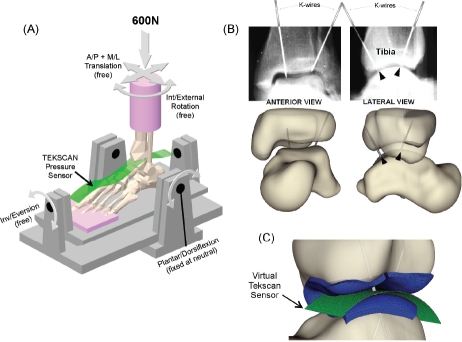
Next, a validation study was conducted to determine the extent to which thus-computed ankle contact FE results agreed with experimentally measured tibio-talar contact stress.54 Two cadaver ankles were loaded axially to 600 N (Figure 8), during which ankle contact stresses were measured with a purpose-designed high-resolution ankle contact stress sensor which our group had devel-oped55 (now marketed commercially as Tekscan Model #5033). A CT scan of each ankle was acquired to record the precise loaded joint apposition. Stainless steel marker K-wires were drilled across the joint in order to precisely register sensor orientation relative to the joint surfaces. Bi-planar radiographs were then taken with the K-wires in place, to register the relative locations of the tibia, talus, and the contact stress sensor.
Figure 8.
(A) Schematic of ankle loading, showing an ankle speci-men, the contact stress sensor, and the fixture. (B) Radiographs, and virtual representation of the K-wires for registration. (C) Pinal regis-tration of FE to experimental results. [Adapted with permission from Anderson DD et al. Physical validation of a patient-specific contact finite element model of the ankle. J Biomech. 40:1662-9, 2007.54]
Spatial registration of the contact stress sensor readings with the FE results enabled ideally definitive comparison of the experimentally measured versus computationally predicted contact stress distributions. Since PTOA usually initiates focally, it was especially important that the FE-computed contact stresses be validated locally, in terms of their spatial distribution, rather than just by conventional global measures such as peak or mean contact stress, contact area, etc.
Corresponding contact FE analyses were then per-formed. The global measures showed very reasonable agreement between FE-computed and experimentally measured mean (3. 2% discrepancy for one specimen, 19. 3% for the other) and maximum (1. 5% and 6. 2%) contact stress, as well as for contact area (1. 7% and 14. 9%). More importantly, there was good agreement in the measured versus computed distributions of contact areas across the contact stress levels (Figure 9), especially so for the more physiologically challenging higher contact stress range. Formal site-by-site comparisons between the computed and measured contact stress distributions over the articular surface (1472 locations) also showed strong agreement, with correlations of 90% for one specimen, and 86% for the other. This strong level of agreement between physical measurements and the FE —especially including the spatial distributions—convincingly established the computational formulation's validity.
Figure 9.
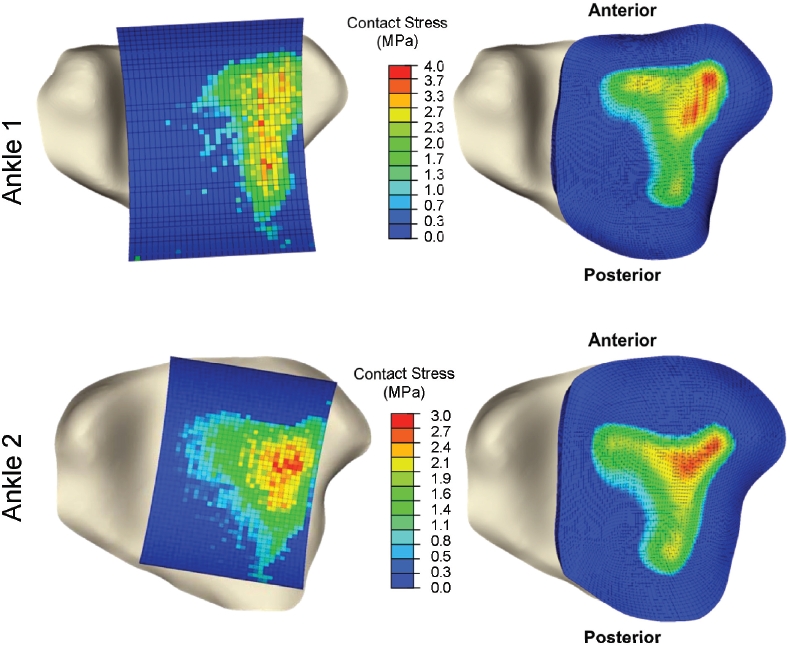
Inferior view of tibia, overlaid with spatially aligned Tekscan pressure results (left) and FE results (right) for each validation ankle. [Reprinted with permission from Anderson DD et al. Physical validation of a patient-specific contact finite element model of the ankle. J Biomech. 40:1662-9, 2007.54]
Physiologic apposition, whole-duty-cycle joint loading, and chronic contact stress exposure
Almost all previous articular contact FE models have been restricted to a single static pose and loading condition. Moreover, as a matter of convenience, the apposition in which the loading has been applied has often been the particular orientation in which the source imaging study (CT or MR) happened to be obtained, despite the fact that this is generally not a position of ankle loading. To perform physiologically meaningful whole-duty-cycle contact stress analysis of articular contact functional loading histories, it is instead necessary to begin from appositions of physical relevance for a specific patient.56
For this reason, whole-duty-cycle level walking gait simulations were based upon a functional neutral weight-bearing apposition of the tibia and talus. This required an experienced foot and ankle surgeon to prescribe the translations and rotations (Figure 7b → 7c) necessary to achieve this neutral weight-bearing apposition. This repositioning was performed working from biplanar (A-P and lateral) weight-bearing radiographs and from anatomical landmarks, based on normative data from a previous study.57
Apposing cartilage surfaces were defined as deform-able contact pairs, with a very low friction (μ=0. 01) interface. Whole-duty cycle FE simulations (Figure 10) entailed performing a sequence of thirteen successive ankle loading contact stress analyses (loads from 0. 1 to 3. 2 x body weight, and rotations from 5° plantar to 9° dorsiflexion), to simulate the entire stance phase of level walking gait.58 The tibia was rotated about a provisional ankle flexion/extension axis, with the talus free to rotate as required by the tibio-talar articulation, thus not con-straining the ankle's rotations to occur about a fixed axis.
Figure 10.
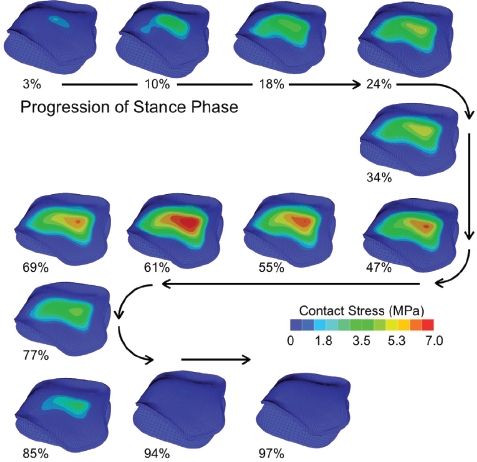
An antero-superior (subchondral) view showing the contact stress distributions computed for the 13 instants of the stance phase of gait for an intact ankle. [Reprinted with permission from Li W et al. Patient-specific finite element analysis of chronic contact stress exposure after intra articular fracture of the tibial plafond. J Orthop Res. 26:1039-45, 2008.61]
Having contact stress data from the 13 incremental solutions allowed assessment of cumulative elevated contact stress exposure. Cumulative exposure reflects a joint's contact stress history over a specified time period. Elevations above a presumably deleterious mechanical insult threshold were postulated to be injurious to the joint. This built upon a paradigm of cartilage degeneration propensity for patients with congenital hip dislocation that we had previously advanced,59-60 where a strong positive correlation was found between elevated cumulative contact stress over-exposure and long-term patient outcome (incidence and progression of OA). Cumulative chronic contact stress exposures for the ankle were calculated over the tibial articulating surface on a step-by-step basis using the equation:
 |
where  is the spatial distribution of per-gait-cycle cumulative contact stress over-exposure, expressed in MPa-seconds; Pi are the FE-computed nodal contact stress values at given increments in the gait cycle, with i varying across 13 load increments; Pd is a scalar contact stress damage threshold (remaining to be established, but provisionally set to 6 MPa, empirically consistent with minimal over-exposure in the intact ankles); and t1 is the residence time, in seconds, associated with a given increment in the gait cycle 58).
Contact stress differences in fractured versus intact ankles
Chronic contact stress exposures were then quantified following intra-articular ankle fractures,61 in the same patient series for which fracture energy analyses had been performed. FE models were generated from CT scans of both the fractured (post surgical reduction) and the intact contralateral ankles. FE solutions were obtained for 11 intact/fractured ankle pairs. Figure 11 shows the tibial articular surface geometries of these ankles, and the corresponding FE-computed per-gait-cycle contact stress exposure distributions.
Figure 11.
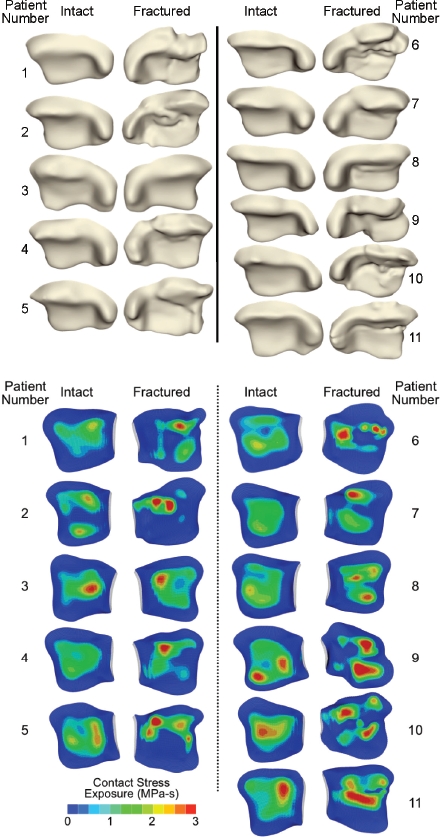
FE-computed contact stress exposure distributions for the 11 paired intact and fractured (post-reduction) ankles, for a single gait cycle. [Adapted with permission from Li W et al. Patient-specific finite element analysis of chronic contact stress exposure after intraarticular fracture of the tibial plafond. J Orthop Res. 26:1039-45, 2008.61]
The FE results for the intact contralateral ankles were consistent with the literature. Despite different test set-ups and applied loads, contact area values reported for the normal ankle joint have been remarkably consistent, with average values of 558 +/-122 mm2.53,62,63 The average intact contact area from these 11 patients (in neutral apposition) was 578 +/- 83 mm2. The peak contact stress value and range for the intact cases (in neutral apposition) agree with values measured by Vrahas et al. , who reported a series-average peak stress value of 6. 7 MPa (range of 2 to 12 MPa) in cadaveric ankles statically loaded to 1360 N.64 The present FE computed series-average peak contact stress value, at a mean of 1492 N load, was 6. 8 MPa (range of 5 to 9 MPa).
In general, the intact ankles had lower peak contact stress exposure values and more uniform and centrally positioned exposure regions, than the (reduced) fractured ankles. The peak contact stress and contact area values occurred at the instant in the gait cycle with maximal joint loading, roughly 61% through the stance phase, in a 7. 5° dorsiflexed position. Series-wide, computed peak contact stress values of intact versus fractured cases were 10. 1+/-1. 8 (mean +/- S. D. ) versus 13. 8+/-1. 8 MPa, respectively (significant, p = 0. 0015). Interestingly, the ranges of peak values overlapped substantially: 7. 4 to 12. 9 MPa for intact cases and 11. 0 to 16. 5 MPa for fractured cases.
The fracture cases had several-fold higher amounts of area with high contact stress-time exposures, and correspondingly lesser amounts of area with low exposure values, compared to the intact cases (x2 test statistic = 26. 1, p = 0. 011). Series-wide, peak per-gait-cycle exposure values for intact versus fractured ankle cases were 2. 7+/-0. 5 MPa-s versus 3. 9+/-0. 5 MPa-s, respectively (highly statistically significant, p=0. 003). For some patients, the difference in stress exposure between intact and fractured ankles was relatively minor, while for others, the difference was dramatic (range from 8% to 91%).
Refinements in the assessment of chronic contact stress elevation, toward clinical use
In the course of this work, it became evident that translating the patient-specific FE analyses methodology to routine clinical use would require substantial increases in the speed and robustness with which contact stress distributions could be calculated. We therefore have since developed more expeditious and substantially more robust elastic contact analysis tools that achieve this objective.65
PART III: CONICAL INVESTIGATIONS OF THE PATHOMECHANICAL ETIOLOGY OF PTOA
We have prospectively followed a series of 36 tibial plafond fracture patients, who have been uniformly treated provisionally with a spanning external fixator, and subsequently with definitive fracture reduction and screw fixation at a time when soft tissue injury had sufficiently resolved. A goal has been to assess whether these new biomechanical indices of both the acute mechanical insult (from the initial trauma) and chronic contact stress elevation (from residual incongruity) are predictive of OA The tibial plafond fractures ranged in severity from minimally to severely comminuted, with idiosyncratic fragmentation morphologies. Two year follow-ups are now complete for these patients. Hypotheses tested have been that functional deficits, symptoms, and the degree of cartilage degeneration in articular fracture patients correlate with metrics of the acute injurious mechanical insult and/or of chronic cartilage contact stress elevations from residual articular incongruity. A corollary hypothesis has been that there is a threshold of acute injury severity and/or of chronic mechanical insult that is predictive of the onset of PTOA
PTOA severity was assessed by Kellgren-Lawrence (KL) grade at two years post-injury. Functional outcomes were measured using the Ankle Osteoarthritis Scale (AOS), a reliable and validated self-assessment instrument that measures patient symptoms and disabilities related to ankle arthritis.66 Relationships between fracture severity (using the CT-based metrics described above), PTOA severity, and AOS scores were determined by linear regression.67
At two years post-injury, 13% of the patients had developed mild PTOA (KL=2), and 31% had developed moderate to severe PTOA (KL=3). Linear regression (Figure 12) indicated that fracture energy and articular comminution, when combined, explained 70% of the variation in PTOA severity. Fragment displacement/ dispersal correlated much less strongly with joint degeneration (R2=0. 42). A combined fracture energy and articular comminution metric was a better predictor of KL scores than was clinician subjective judgment (R2 of 0. 70 vs. 0. 47, respectively).
Figure 12.
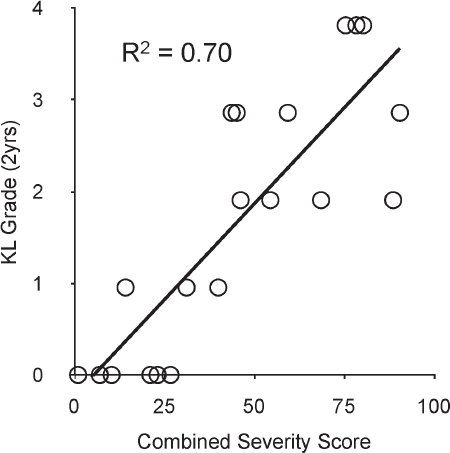
A combined severity score including fracture energy and articular comminution predicted 70% of the variation in KL arthrosis grade at two-year follow-up. [Adapted with permission from Thomas TP et al. Objective CT-based metrics of articular fracture severity to assess risk for posttraumatic osteoarthritis. J Orthop Trauma. 24:764-9, 2010.67]
Patients with little or no evidence of PTOA (KL2) had an average AOS score of 21. 4±20 and an average fracture severity score of 43. 5±11. Patients with a KL grade >2 averaged 40. 8±18 for AOS and 69. 8±20 for fracture severity. When grouped by KL grade, fracture severity and AOS scores were well correlated (R2=0. 68). Both the AOS and fracture severity scores were statistically different (p<0. 05) between the groups of patients with versus without incident PTOA.
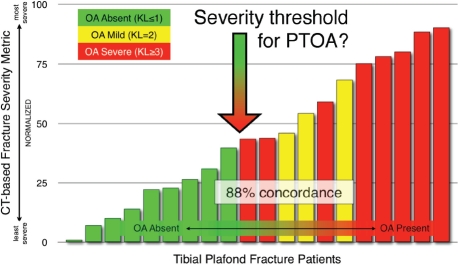
The existence of a threshold of injury severity that predicts whether a joint will develop PTOA has broad implications for the future treatment of intra-articular fractures. In fractured joints identified as being most highly at risk to develop PTOA, the value of accurate surgical reduction should be especially carefully weighed against the backdrop of potential surgical complications. New bio/pharmaceutical interventions aimed at forestalling PTOA would certainly need to stratify patients according to their otherwise-expected risk for joint degeneration. The CT-based methodology suggests that such a threshold indeed exists. Figure 13 shows the cases studied, ordered according to the combined acute fracture severity measure. These data support the existence of a severity threshold (in the vicinity of 40 for this severity range-normalized metric) above which joint degeneration is likely.
Figure 13.
The CT-based severity metric successfully discriminated between cases that developed PTOA and those that did not, in a threshold like manner
Fragment displacement/dispersal was not a significant predictor of PTOA in this series of intra-articular tibial plafond fractures. Judging by the high concordance between displacement/dispersal and clinician rank ordering, the surgeons' perceptions of injury severity were greatly influenced by the degree of fragment displacement. That focus on displacement may reflect an implicit association with soft tissue damage, and/or with difficulty in obtaining accurate surgical reduction. Both factors certainly are important concerns in acute-term patient management, but they do not appear to be highly predictive of eventual PTOA.
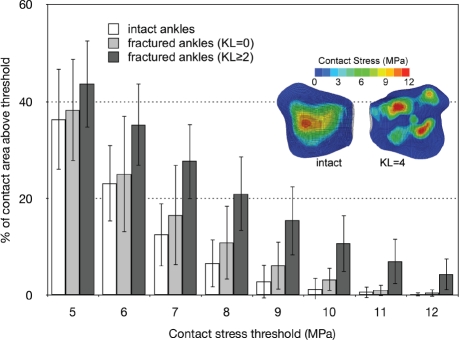
FE-computed contact stress distributions for these patients68 clearly show that much larger percentages of the post-fracture cartilage experienced high contact stress (areas above 7. 5 MPa at the instant of peak joint loading averaged 23. 4% of the surface in the fractured vs. only 12. 5% in the intact ankles). Furthermore, there was a clear distinction between area engagement histograms from those fractured ankles that developed PTOA within two years, versus those that did not, with the histograms of the latter being much more similar to those of the intact contralateral ankles (Figure 14).
Figure 14.
The % of contact area engaged above selected contact stress levels shows that in the ankles that went on to develop PTOA, a much larger percentage of the post-fracture cartilage surface was subject to high levels of contact stress (dark columns). The inset shows contact stress distributions for a representative pairing of a fractured ankle with its intact contralateral. [Reprinted with permission from Anderson DD et al. Is elevated contact stress predictive of post-traumatic osteoarthritis for imprecisely reduced tibial plafond fractures? J Orthop Res. 29:33-9, 2011.68]
Putative contact stress damage threshold/tolerance parameters were systematically varied to determine the values that provided the best agreement between contact stress exposure metrics and the KL scores for each ankle. A binary OA status was defined as 1 for each ankle with a KL score = 2, and 0 for all other ankles.
The predictive performance of five different contact stress exposure metrics was assessed in the intact versus fractured ankles, with fractured ankles grouped according to whether or not they developed PTOA by two-year follow up. The concordance between the vari-ous contact stress exposure metrics and KL score were all excellent, exceeding 88%. The concordance with OA status was even higher, with all metrics yielding greater than 94% agreement.
The best concordance (KL score of 95%, OA status 100% prediction accuracy) was associated with a local stress-time exposure metric. Figure 15 shows the clear separation between groups with different OA status attained with the local stress-time exposure metric. For some patients, the difference in exposure between intact and fractured ankles was relatively minor (fractured exposure within 40% of intact), while for others, the difference was dramatic (fractured exposure 900% of intact).
Figure 15.
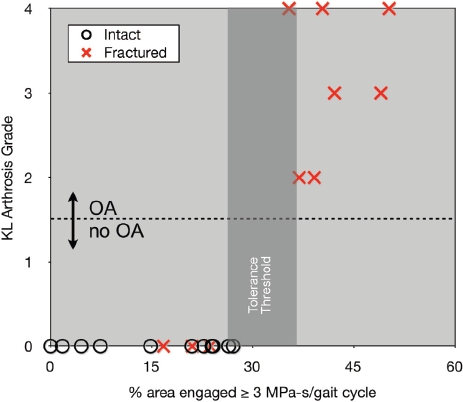
The relative proportion of articular surface area experiencing supra-threshold contact stress, associated with a stress-time exposure in excess of 3MPa-s, agreed closely with the two-year KL score, and was perfectly predictive of OA status. [Reprinted with permission from Anderson DD et al. Is elevated contact stress predictive of post-traumatic osteoarthritis for imprecisely reduced tibial plafond fractures? J Orthop Res. 29:33-9, 2011.68]
To investigate the hypothesis that elevated contact stress exposure results in cartilage thinning, a method was needed to measure cartilage thickness in patients with implanted metallic fixation hardware. MRI of cartilage provides an obvious means for this assessment. Unfortunately, the metallic screws and plates normally placed surgically to maintain fracture reduction introduce susceptibility artifacts, which locally distort conventionally acquired MR images, largely precluding reliable cartilage assessment In earlier work, we had established that double-contrast CT arthrography was able to measure cartilage thickness in the (cadaveric) ankle with an accuracy superior to MRI.69 Based on this work, FE measures of contact stress exposure were compared with double-contrast CT images of cartilage thickness in tibial plafond fracture patients,70 to determine if specific areas of elevated contact stress exposure were associated with corresponding areas of subsequent cartilage thinning.
Double-contrast CTs were obtained at 6 months and 2 years post injury, for 11 patients. [Although high-quality images were obtained in these patients, double-contrast MDCT scans were problematic for studying cartilage degeneration in ankles of plafond fracture patients. Efforts to obtain usable scans in an additional 20 patients were unsuccessful, with reasons being related either to the inherent joint pathology (especially arthrofibrosis) and technical difficulties (failed injection, metal artifact). ] Successful contrast agent injection into the joints enabled segmentation of the subchondral bone and cartilage surfaces. Registration of the post-op FE simulations to the 2 year cartilage thickness maps was performed, to allow spatial comparison. Cartilage thickness data were then linearly interpolated (spatially) to coincide with the locations of FE-computed chronic contact stress expo-sure values, and the two quantities were then compared at sites across the articular surface.
Localized areas of cartilage thinning generally corresponded to areas exposed to elevated contact stresses (Figure 16). Contact stress exposures of 2. 0 MPa-s or greater were associated with a focal loss of cartilage. The relative reduction in cartilage volumes from the pre-fractured state ranged from 11 to 81%. The most severely comminuted fractures experienced the greatest loss of cartilage, in addition to having the greatest contact stress exposures as predicted by FE. The area of total cartilage loss ranged from 0 to 241 mm2, the latter being about 25% of the articular surface.
Figure 16.
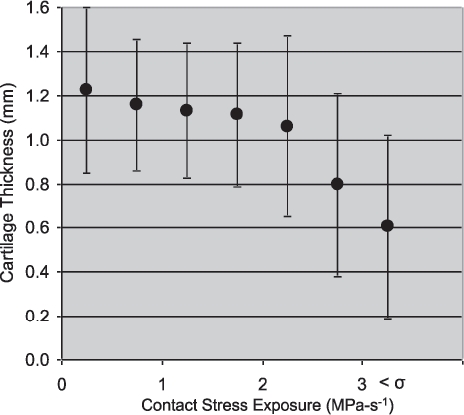
Focal regions of decreased cartilage thickness showed a correspondence with elevated chronic contact stress at two-years follow-up.
PATH FORWARD
Olson and Guilak 71 recently described the void in knowledge regarding the etiology, pathogenesis, and mechanisms of PTOA as a “black box,” that needs to be opened in order to develop therapies to improve the outcomes of patients with intra-articular fractures. The studies summarized in this paper provide a novel framework for statistically robust multi-center clinical/ translational studies of methods to reduce the risk of PTOA following an intra-articular fracture.
Enabling technologies that provide objective mechanical indices of acute cartilage injury and of chronic increased contact stress have been developed in the laboratory, and applied to prospective clinical series, to provide insight into the mechanical etiology of PTOA The clinical outcomes indicate that acute fracture se-verity is a primary predictor of the incidence of post-traumatic arthritis and functional outcomes following fractures of the tibial plafond, with chronic contact stress elevation also correlating (secondarily) with outcome. A recent case report of three distinct plafond fractures has served to illustrate the utility of these new objective biomechanical measures to identify clinically significant distinctions among individual patients.72
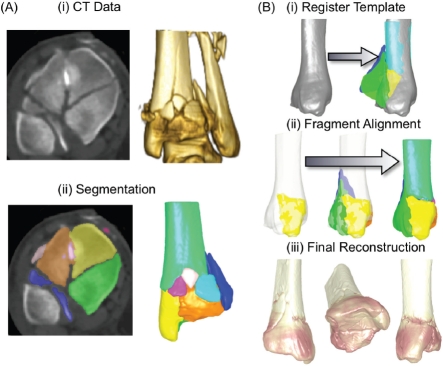
Given the relationship between elevated contact stress and cartilage degeneration identified in this work, continued efforts at improving surgical fracture reduction are warranted. One of these is a new technology utilizing “three-dimensional puzzle solving” methods73 to facilitate pre-operative fracture reconstruction planning (Figure 17), so that more optimally congruous surgical fracture reductions can be more consistently achieved, to reduce contact stress elevations. This puzzle solving technology informs the surgeon of the original anatomic sites of origin of each of the fragments.
Figure 17.
(A) A tibial plafond fracture case is first segmented from CT data. (B) The intact template is registered to the fractured limb's proximal base, and me fragment native surfaces are aligned to me template, starting with the articular block.
Given the experience of the past several decades, further mechanical refinements of fracture stabilization techniques alone seem unlikely to advance the treatment of patients with articular fractures. Future investigation probably needs to focus on bio/pharmaceutical interventions designed to preserve the damaged articular surfaces. Although the basic cellular mechanisms responsible for progressive articular surface degeneration following joint injury are not yet well understood, there is increasing evidence that biologic interventions can decrease chondrocyte damage induced by mechanical stress,74-77 suggesting that it may be possible to limit progressive chondrocyte damage after joint injury. To develop such agents, reductionist laboratory studies (e. g. , cell/tissue culture) need to work with realistic impact energy and chronic contact stress levels. The development of a large animal model of intra-articular fracture that replicates the important mechanical features of the insult is another area where progress is being made.78 Moreover, to rationally apply and evaluate these advances, such interventions must eventually be assessed in patient cohorts that are reasonably stratified in terms of the severity of the initial joint injury and that involve large enough numbers of patients to yield statistically robust findings.
Finally, computer-based measures of injury severity, coupled with multi-center electronic pooling of case experiences, offer unprecedented opportunities to accomplish these goals. We are currently conducting a multi-center study of plafond fractures using expedited CT-based fracture severity measurements, with novel capabilities for case-by-case comparisons within a large patient population. This will set the stage for broader clinical use to objectively index injury severity, as an aid to discerning patient prognosis and choosing treatment
Acknowledgments
The authors gratefully acknowledge the many valuable contributions of their collaborators on this work: Christina Beardsley, Thaddeus Thomas, Jane Goldsworthy, Wendy Li, Yuki Tochigi, James Rudert, Teresa Mosqueda, Evan Hermanson, Christopher Van Hofwegen, Valerie Muehling, Andrew Pick, Thomas Phelps, James Nepola, Todd McKinley, Joseph Buckwalter, Nicole Grosland, Douglas Pedersen, Julie Mock, and Lois Lembke. The authors are also grateful for grant funding from the NIH/NIAMS (AR046601, AR048939, AR055533, and AR054015), the Arthritis Foundation, the Orthopaedic Research and Education Foundation, the AO Foundation, Switzerland, the Whitaker Foundation, and the Orthopaedic Trauma Association in support of the research. Finally, we would like to thank the Orthopaedic Research and Education Foundation for recognizing this work with the 2011 Clinical Research Award.
REFERENCES
- 1.Buckwalter JA. Mechanical injuries of articular cartilage. In: Finerman G, Noyes FR, editors. Biology and biomechanics of the traumatized synovial joint: the knee as a model. Park Ridge, IL: AAOS; 1992. pp. 83–96. [Google Scholar]
- 2.Buckwalter JA. Osteoarthritis and articular cartilage use, disuse, and abuse: experimental studies. J Rheumatol Suppl. 1995;43:13–15. [PubMed] [Google Scholar]
- 3.Dirschl DR, Marsh JL, Buckwalter JA, Gelber-man R, Olson SA, Brown TD, Llinias A. Articular fractures. J Am Acad Orthop Surg. 2004;12(6):416–423. doi: 10.5435/00124635-200411000-00006. [DOI] [PubMed] [Google Scholar]
- 4.Brown TD, Johnston RC, Saltzman CL, Marsh JL, Buckwalter JA. Posttraumatic osteoarthritis: a first estimate of incidence, prevalence, and burden of disease. J Orthop Trauma. 2006;20(10):739–744. doi: 10.1097/01.bot.0000246468.80635.ef. [DOI] [PubMed] [Google Scholar]
- 5.Laird A, Keating JF. Acetabular fractures: a 16-year prospective epidemiological study. J Bone Joint Surg Br. 2005;87(7):969–973. doi: 10.1302/0301-620X.87B7.16017. [DOI] [PubMed] [Google Scholar]
- 6.Matta JM. Fractures of the acetabulum: accuracy of reduction and clinical results in patients managed operatively within three weeks after the injury. J Bone Joint Surg Am. 1996;78(11):1632–1645. [PubMed] [Google Scholar]
- 7.Honkonen SE. Degenerative arthritis after tibial plateau fractures. J Orthop Trauma. 1995;9(4):273–277. doi: 10.1097/00005131-199509040-00001. [DOI] [PubMed] [Google Scholar]
- 8.Volpin G, Dowd GS, Stein H, Bentley G. Degenerative arthritis after intra-articular fractures of the knee. Long-term results. J Bone Joint Surg Br. 1990;72(4):634–638. doi: 10.1302/0301-620X.72B4.2380219. [DOI] [PubMed] [Google Scholar]
- 9.Bonar SK, Marsh JL. Tibial Plafond Fractures: Changing Principles of Treatment. J Am Acad Orthop Surg. 1994;2(6):297–305. doi: 10.5435/00124635-199411000-00001. [DOI] [PubMed] [Google Scholar]
- 10.Bourne RB, Rorabeck CH, Macnab J. Intra-articular fractures of the distal tibia: the pilon fracture. J Trauma. 1983;23(7):591–596. doi: 10.1097/00005373-198307000-00008. [DOI] [PubMed] [Google Scholar]
- 11.Etter C, Ganz R. Long-term results of tibial plafond fractures treated with open reduction and internal fixation. Arch Orthop Trauma Surg. 1991;110(6):277–283. doi: 10.1007/BF00443458. [DOI] [PubMed] [Google Scholar]
- 12.Kellam JF, Waddell JP. Fractures of the distal tibial metaphysis with intra-articular extension-the distal tibial explosion fracture. J Trauma. 1979;19(8):593–601. doi: 10.1097/00005373-197908000-00007. [DOI] [PubMed] [Google Scholar]
- 13.Marsh JL, Bonar S, Nepola JV, Decoster TA, Hurwitz SR. Use of an articulated external fixator for fractures of the tibial plafond. J Bone Joint Surg Am. 1995;77(10):1498–1509. doi: 10.2106/00004623-199510000-00004. [DOI] [PubMed] [Google Scholar]
- 14.Marsh JL, McKinley T, Dirschl D, Pick A, Haft G, Anderson DD, Brown T. The sequential recovery of health status after tibial plafond fractures. J Orthop Trauma. 2010;24(8):499–504. doi: 10.1097/BOT.0b013e3181c8ad52. [DOI] [PMC free article] [PubMed] [Google Scholar]
- 15.Marsh JL, Weigel DP, Dirschl DR. Tibial plafond fractures. How do these ankles function over time? J Bone Joint Surg Am. 2003;85-A(2):287–295. [PubMed] [Google Scholar]
- 16.Borrelli J, Ricci WM. Acute effects of cartilage impact. Clin Orthop Relat Res. 2004;(423):33–39. doi: 10.1097/01.blo.0000132627.13539.02. [DOI] [PubMed] [Google Scholar]
- 17.Buckwalter JA, Brown TD. Joint injury, repair, and remodeling: roles in post-traumatic osteoarthritis. Clin Orthop Relat Res. 2004;(423):7–16. [PubMed] [Google Scholar]
- 18.McKinlcy TO, Rudert MJ, Koos DC, Tochigi Y, Baer TE, Brown TD. Pathomechanic determinants of posttraumatic arthritis. Clin Orthop Relat Res. 2004;(427 Suppl):S78–S88. doi: 10.1097/01.blo.0000143817.74887.55. [DOI] [PubMed] [Google Scholar]
- 19.Trumble TE, Schmitt SR, Vedder NB. Factors affecting functional outcome of displaced intra-articular distal radius fractures. J Hand Surg [Am] 1994;19(2):325–340. doi: 10.1016/0363-5023(94)90028-0. [DOI] [PubMed] [Google Scholar]
- 20.Bardett CS, D’Amato MJ, Weiner LS. Fractures of the Tibial Pilon. In: Browner BD, Jupiter JB, Levine AM, Trafton PG, editors. Skeletal trauma. Philadelphia, PA: W. B. Saunders Company; 1998. pp. 2295–2325. [Google Scholar]
- 21.Muller ME, Nazarian S, Koch P, Schatzker J. Manual of Internal Fixation. 3rd edition. New York: Springer-Verlag; 1991. Techniques Recommended by the AO-ASIF Group. [Google Scholar]
- 22.Swiontkowski MF, Sands AK, Agel J, Diab M, Schwappach JR, Kreder HJ. Interobserver variation in the AO/OTA fracture classification system for pilon fractures: is there a problem? J Orthop Trauma. 1997;11(7):467–470. doi: 10.1097/00005131-199710000-00002. [DOI] [PubMed] [Google Scholar]
- 23.Martin JS, Marsh JL, Bonar SK, DeCoster TA, Found EM, Brandser EA. Assessment of the AO/ ASIF fracture classification for the distal tibia. J Orthop Trauma. 1997;11(7):477–483. doi: 10.1097/00005131-199710000-00004. [DOI] [PubMed] [Google Scholar]
- 24.Beardsley CL, Marsh JL, Brown TD. A synthetic material mimicking the fragmentation of bone. 22nd Annual Mtg of the Am Soc of Biomech; 1998. Paper #483. [Google Scholar]
- 25.Beardsley CL, Heiner AD, Brandser EA, Marsh JL, Brown TD. High density polyetherurethane foam as a fragmentation and radiographic surrogate for cortical bone. Iowa Orthop J. 2000;20:24–30. [PMC free article] [PubMed] [Google Scholar]
- 26.Gilvarry JJ. Fracture of brittle solids. I. Distribution function for fragment size in single fracture (theoretical) Journal of Applied Physics. 1961;32:391. [Google Scholar]
- 27.Beardsley CL, Brown TD, Brandser E, Marsh JL. Toward objective measurement of fracture comminution severity via image analysis. Fourth Combined ORS Meetings of USA Canada, Europe, and Japan.2001. [Google Scholar]
- 28.Beardsley CL, Bertsch CR, Marsh JL, Brown TD. Interfragmentary surface area as an index of comminution energy: proof of concept in a bone fracture surrogate. J Biomech. 2002;35(3):331–338. doi: 10.1016/s0021-9290(01)00214-7. [DOI] [PubMed] [Google Scholar]
- 29.Beardsley C, Marsh JL, Brown T. Quantifying comminution as a measurement of severity of articular injury. Clin Orthop Relat Res. 2004;(423):74–78. doi: 10.1097/01.blo.0000131637.04391.40. [DOI] [PubMed] [Google Scholar]
- 30.Anderson DD, Muehling V, Marsh J, Brown T. Precise identification of bone fragment boundaries to assist in reduction of highly comminuted fractures. Computer-Aided Surgery. 2004;9(3):116. [Google Scholar]
- 31.Beardsley CL, Anderson DD, Marsh JL, Brown TD. Interfragmentary surface area as an index of comminution severity in cortical bone impact. J Orthop Res. 2005;23(3):686–690. doi: 10.1016/j.orthres.2004.09.008. [DOI] [PMC free article] [PubMed] [Google Scholar]
- 32.Anderson DD, Beardsley CL, Marsh JL, Brown TD. Fracture energy determination incorporating local bone densities from CT scans. Fifth Combined ORS Meetings of USA Canada, Europe, and Japan; 2004. Paper #27. [Google Scholar]
- 33.Currey JD. Changes in the impact energy absorption of bone with age. J Biomech. 1979;12(6):459–469. doi: 10.1016/0021-9290(79)90031-9. [DOI] [PubMed] [Google Scholar]
- 34.Currey JD, Brear K, Zioupos P. The effects of ageing and changes in mineral content in degrading the toughness of human femora. J Biomech. 1996;29(2):257–260. doi: 10.1016/0021-9290(95)00048-8. [DOI] [PubMed] [Google Scholar]
- 35.Gibson LJ, Ashby MF. Cellular solids: structure and properties. Cambridge Univ Pr. 1999 [Google Scholar]
- 36.Snyder SM, Schneider E. Estimation of mechanical properties of cortical bone by computed tomography. J Orthop Res. 1991;9(3):422–431. doi: 10.1002/jor.1100090315. [DOI] [PubMed] [Google Scholar]
- 37.Thomas TP, Anderson DD, Marsh JL, Brown TD. Displaced soft tissue volume as a metric of comminuted fracture severity. 31st Annual Mtg of the Am Soc of Biomech; 2007. Paper #309. [Google Scholar]
- 38.DeCoster TA, Willis MC, Marsh JL, Williams TM, Nepola JV, Dirschl DR, Hurwitz SR. Rank order analysis of tibial plafond fractures: does injury or reduction predict outcome? Foot Ankle Int. 1999;20(l):44–49. doi: 10.1177/107110079902000110. [DOI] [PubMed] [Google Scholar]
- 39.Williams TM, Nepola JV, DeCoster TA, Hurwitz SR, Dirschl DR, Marsh JL. Factors affecting out-come in tibial plafond fractures. Clin Orthop Relat Res. 2004;(423):93–98. doi: 10.1097/01.blo.0000127922.90382.f4. [DOI] [PubMed] [Google Scholar]
- 40.Anderson DD, Mosqueda T, Thomas T, Hermanson EL, Brown TD, Marsh JL. Quantifying tibial plafond fracture severity: absorbed energy and fragment displacement agree with clinical rank ordering. J Orthop Res. 2008;26(8):1046–1052. doi: 10.1002/jor.20550. [DOI] [PMC free article] [PubMed] [Google Scholar]
- 41.Thomas TP, Anderson DD, Marsh JL, Brown TD. A new technique for expedited fracture severity assessment. 30th Annual Mtg of the Am Soc of Biomech; 2006. Paper #236. [Google Scholar]
- 42.Thomas TP, Anderson DD, Marsh JL, Brown TD. A method for the estimation of normative bone surface area to aid in objective CT-based fracture severity assessment. Iowa Orthop J. 2008;28:9–13. [PMC free article] [PubMed] [Google Scholar]
- 43.Dirschl DR, Adams GL. A critical assessment of factors influencing reliability in the classification of fractures, using fractures of the tibial plafond as a model. J Orthop Trauma. 1997;11(7):471–476. doi: 10.1097/00005131-199710000-00003. [DOI] [PubMed] [Google Scholar]
- 44.Kreder HJ, Hanel DP, McKee M, Jupiter J, McGillivary G, Swiontkowski MF. X-ray film measurements for healed distal radius fractures. J Hand Surg [Am] 1996;21(l):31–39. doi: 10.1016/S0363-5023(96)80151-1. [DOI] [PubMed] [Google Scholar]
- 45.Anderson DD, Bell AL, Gaffney MB, Imbriglia JE. Contact stress distributions in malreduced intra articular distal radius fractures. J Orthop Tr. 1996;10(5):331–337. doi: 10.1097/00005131-199607000-00007. [DOI] [PubMed] [Google Scholar]
- 46.Brown TD, Anderson DD, Nepola JV, Singerman RJ, Pedersen DR, Brand RA. Contact stress aberrations following imprecise reduction of simple tibial plateau fractures. J Orthop Res. 1988;6(6):851–862. doi: 10.1002/jor.1100060609. [DOI] [PubMed] [Google Scholar]
- 47.Fitzpatrick DC, Otto JK, McKinley TO, Marsh JL, Brown TD. Kinematic and contact stress analysis of posterior malleolus fractures of the ankle. J Orthop Trauma. 2004;18(5):271–278. doi: 10.1097/00005131-200405000-00002. [DOI] [PubMed] [Google Scholar]
- 48.Huber-Betzer H, Brown TD, Mattheck C. Some effects of global joint morphology on local stress aberrations near imprecisely reduced intra-articular fractures. J Bi. 1990;23(8):811–822. doi: 10.1016/0021-9290(90)90028-2. [DOI] [PubMed] [Google Scholar]
- 49.Anderson DD, Deshpande BR, Daniel TE, Baratz ME. A three-dimensional finite element model of the radiocarpal joint: distal radius fracture step-off and stress transfer. Iowa Orthop J. 2005;25:108–117. [PMC free article] [PubMed] [Google Scholar]
- 50.Keyak JH, Meagher JM, Skinner HB, Mote CD. Automated three-dimensional finite element modelling of bone: anew method. J Biomed Eng. 1990;12(5):389–397. doi: 10.1016/0141-5425(90)90022-f. [DOI] [PubMed] [Google Scholar]
- 51.Grosland NM, Brown TD. A voxel-based formulation for contact finite element analysis. Comput Methods Biomech BiomedEngin. 2002;5(l):21–32. doi: 10.1080/10255840290032180. [DOI] [PubMed] [Google Scholar]
- 52.Anderson DD, Goldsworthy JK, Shivanna K, Grosland NM, Pedersen DR, Thomas TP, Tochigi Y, Marsh JL, Brown TD. Intra-articular contact stress distributions at the ankle throughout stance phase-patient-specific finite element analysis as a metric of degeneration propensity. Biomech Model Mechanobiol. 2006;5(2-3):82–89. doi: 10.1007/s10237-006-0025-2. [DOI] [PMC free article] [PubMed] [Google Scholar]
- 53.Millington SA, Grabner M, Wozelka R, Anderson DD, Hurwitz SR, Crandall JR. Quantification of ankle articular cartilage topography and thickness using a high resolution stereophotography system. Osteoarthritis Ca. 2007;15(2):205–211. doi: 10.1016/j.joca.2006.07.008. [DOI] [PubMed] [Google Scholar]
- 54.Anderson DD, Goldsworthy JK, Li W, James Rudert M, Tochigi Y, Brown TD. Physical validation of a patient-specific contact finite element model of the ankle. J Biomech. 2007;40(8):1662–1669. doi: 10.1016/j.jbiomech.2007.01.024. [DOI] [PMC free article] [PubMed] [Google Scholar]
- 55.Brown TD, Rudert MJ, Grosland NM. New methods for assessing cartilage contact stress after articular fracture. Clin Orthop Relat Res. 2004;(423):52–58. doi: 10.1097/01.blo.0000132633.38338.8b. [DOI] [PubMed] [Google Scholar]
- 56.Goldsworthy JK, Anderson DD, Pedersen DR, Tochigi Y, Brown TD. Achieving anatomically-correct rotation in patient-specific computer modeling of the ankle joint. 52nd Annual Mtg of the ORS; 2006. Paper #1893. [Google Scholar]
- 57.Tochigi Y, Sun JS, Amendola A, Saltzman CL. Ankle alignment on lateral radiographs. Part 2: reliability and validity of measures. Foot Ankle Int. 2006;27(2):88–92. doi: 10.1177/107110070602700203. [DOI] [PMC free article] [PubMed] [Google Scholar]
- 58.Stauffer RN, Chao EY, Brewster RC. Force and motion analysis of the normal, diseased, and prosthetic ankle joint. Clin Orthop Relat Res. 1977;(127):189–196. [PubMed] [Google Scholar]
- 59.Hadley NA, Brown TD, Weinstein SL. The effects of contact pressure elevations and aseptic necrosis on the long-term outcome of congenital hip dislocation. J Orthop Res. 1990;8(4):504–513. doi: 10.1002/jor.1100080406. [DOI] [PubMed] [Google Scholar]
- 60.Maxian TA, Brown TD, Weinstein SL. Chronic stress tolerance levels for human articular cartilage: two nonuniform contact models applied to long-term follow-up of CDR. J Biomech. 1995;28(2):159–166. doi: 10.1016/0021-9290(94)00054-8. [DOI] [PubMed] [Google Scholar]
- 61.Li W, Anderson DD, Goldsworthy JK, Marsh JL, Brown TD. Patient-specific finite element analysis of chronic contact stress exposure after intraarticular fracture of the tibial plafond. J Orthop Res. 2008;26(8):1039–1045. doi: 10.1002/jor.20642. [DOI] [PMC free article] [PubMed] [Google Scholar]
- 62.Macko VW, Matthews LS, Zwirkoski P, Goldstein SA. The joint-contact area of the ankle. The contribution of the posterior malleolus. J Bone Joint Surg Am. 1991;73(3):347–351. [PubMed] [Google Scholar]
- 63.Wan L, de Asia RJ, Rubash HE, Li G. Determination of in-vivo articular cartilage contact areas of human talocrural joint under weightbearing conditions. Osteoarthritis Cartilage. 2006;14(12):1294–1301. doi: 10.1016/j.joca.2006.05.012. [DOI] [PubMed] [Google Scholar]
- 64.Vrahas M, Fu F, Veenis B. Intraarticular contact stresses with simulated ankle malunions. J Orthop Trauma. 1994;8(2):159–166. doi: 10.1097/00005131-199404000-00014. [DOI] [PubMed] [Google Scholar]
- 65.Anderson DD, Iyer KS, Segal NA, Lynch JA, Brown TD. Implementation of discrete element analysis for subject-specific, population-wide investigations of habitual contact stress exposure. J Appl Biomech. 2010;26(2):215–223. doi: 10.1123/jab.26.2.215. [DOI] [PMC free article] [PubMed] [Google Scholar]
- 66.Domsic RT, Saltzman CL. Ankle osteoarthritis scale. Foot Ankle Int. 1998;19(7):466–471. doi: 10.1177/107110079801900708. [DOI] [PubMed] [Google Scholar]
- 67.Thomas TP, Anderson DD, Mosqueda TV, Van Hofwegen CJ, Hillis SL, Marsh JL, Brown TD. Objective CT-based metrics of articular fracture se-verity to assess risk for posttraumatic osteoarthritis. J Orthop Trauma. 2010;24(12):764–769. doi: 10.1097/BOT.0b013e3181d7a0aa. [DOI] [PMC free article] [PubMed] [Google Scholar]
- 68.Anderson DD, Van Hofwegen C, Marsh JL, Brown TO. Is elevated contact stress predictive of post-traumatic osteoarthritis for imprecisely reduced tibial plafond fractures? J Orthop Res. 2011;29(l):33–39. doi: 10.1002/jor.21202. [DOI] [PMC free article] [PubMed] [Google Scholar]
- 69.El-Khoury GY, Alliman KJ, Lundberg HJ, Rudert MJ, Brown TO, Saltaman CL. Cartilage thickness in cadaveric ankles: measurement with double-contrast multi-detector row CT arthrography versus MR imaging. Radiology. 2004;233(3):768–773. doi: 10.1148/radiol.2333031921. [DOI] [PubMed] [Google Scholar]
- 70.Thomas TP, Van Hofwegen CJ, Anderson DD, Brown TO, Marsh JL. Utility of double-contrast multi-detector CT scans to assess cartilage thick-ness after tibial plafond fracture. Orthop Res Rev. 2009;2009(l):23–29. doi: 10.2147/orr.s7387. [DOI] [PMC free article] [PubMed] [Google Scholar]
- 71.Olson SA, Guilak F. From articular fracture to posttraumatic arthritis: a black box that needs to be opened. J Orthop Trauma. 2006;20(10):661–662. doi: 10.1097/01.bot.0000245683.89152.55. [DOI] [PubMed] [Google Scholar]
- 72.Masrouha KZ, Anderson DD, Thomas TP, Kuhl LL, Brown TO, Marsh JL. Acute articular fracture severity and chronic cartilage stress challenge as quantitative risk factors for post-traumatic osteoarthritis: illustrative cases. Iowa Orthop J. 2010;30:47–54. [PMC free article] [PubMed] [Google Scholar]
- 73.Thomas TP, Anderson DD, Willis AR, Liu P, Marsh JL, Brown TO. ASB Clinical Biomechanics Award Paper 2010 Virtual pre-operative reconstruction planning for comminuted articular fractures. Clin Biomech (Bristol, Av. 2011;26(2):109–115. doi: 10.1016/j.clinbiomech.2010.12.008. [DOI] [PMC free article] [PubMed] [Google Scholar]
- 74.D'Lima DD, Hashimoto S, Chen PC, Lota MK, Cohvell CWJ. Prevention of chondrocyte apoptosis. J Bone Joint Surg Am. 2001;83-A(Suppl 2Pt 1):25–26. doi: 10.2106/00004623-200100021-00006. [DOI] [PubMed] [Google Scholar]
- 75.Martin JA, McCabe D, Walter M, Buckwalter JA, McKinley TO. N acetylcysteine inhibits post-impact chondrocyte death in osteochondral explants. J Bone Joint Surg Am. 2009;91(8):1890–1897. doi: 10.2106/JBJS.H.00545. [DOI] [PMC free article] [PubMed] [Google Scholar]
- 76.Ramakrishnan P, Hecht BA, Pedersen DR, Lavery MR, Maynard J, Buckwalter JA, Martin JA. Oxidant conditioning protects cartilage from mechanically induced damage. J Orthop Res. 2010;28(7):914–920. doi: 10.1002/jor.21072. [DOI] [PMC free article] [PubMed] [Google Scholar]
- 77.Rundell SA, Baars DC, Phillips DM, Haut RC. The limitation of acute necrosis in retro-patellar cartilage after a severe blunt impact to the in vivo rabbit patello-femoral joint. J Orthop Res. 2005;23(6):1363–1369. doi: 10.1016/j.orthres.2005.06.001.1100230618. [DOI] [PubMed] [Google Scholar]
- 78.Tochigi Y, Baer TE, Zhang P, Martin JA, Brown TO. Development of a large survival animal model of human intraarticular fracture: A new technique to replicate cell-level cartilage pathology in the porcine hock in vivo. 56th Annual Mtg of the ORS; 2010. Paper #355. [Google Scholar]


