Abstract
Epicardial fat volume (EFV) quantified on non-contrast cardiac CT (NCT) relates to cardiovascular prognosis. We sought to define the upper normal limit of body surface area (BSA)-indexed EFV in a healthy population and to validate it as a predictor of major adverse cardiovascular events (MACE). We analyzed NCT scans of 226 healthy, low Framingham risk score (≤6%, FRS) people performed for coronary calcium scoring (CCS). EFV was quantified using validated software and indexed (EFVi) to BSA. We defined the 95th-percentile as the upper normal limit. Subsequently, we re-analyzed a separate cohort of 232 participants from a previously published case-control study with 4-year follow-up and 58 cases of MACE to test the additive value of abnormally high EFVi for predicting MACE. Of the 226 healthy participants, 51% were men (mean age 52±9 years). EFV correlated to BSA (r=0.373, p<0.0001). Median, range, and 25th and 75th-percentiles of the non-normally distributed EFVi were 33.3, 10.8–96.6, and 24.5 and 45.5cm3/m2. The 95th-percentile definition of the upper normal limit of EFVi was 68.1cm3/m2. Regarding prediction of MACE, EFVi values higher than the newly-defined threshold emerged as a significant and independent predictor after controlling for confounders (OR 2.8, 95% CI 1.3–6.4, p=0.012), and trended in its additive value to the combination of CCS ≥400 and FRS (ROC-AUC 0.714 vs. 0.675, p=0.1277). In conclusion, in a healthy population, we determined 68.1cm3/m2 as the 95th-percentile threshold for abnormally high EFVi. EFVi exceeding this value independently predicted MACE and trended to add to CCS and FRS in this prediction.
Keywords: epicardial fat volume, body surface area, normal limits, threshold
Recently, multiple studies have shown a deleterious relationship between epicardial fat burden and coronary atherosclerosis, arrhythmogenesis, and major adverse cardiovascular events (MACE),1–3 which generated interest in quantifying epicardial adipose tissue. Early reports validated echocardiographically measured epicardial fat thickness.4 More recent reports have used non-contrast enhanced cardiac computed tomography (NCT) to measure epicardial fat volume (EFV) and have shown its reproducibility and correlation to CAD presence, severity, and prognosis.5–7 Whether body surface area (BSA)-indexed EFV (EFVi) values predictive of MACE can be identified by using healthy population-defined normal limits remains unknown. Therefore, the aim of this study was to determine the upper normal threshold of EFVi on NCT in a healthy population and to test its ability to predict MACE.
METHODS
The DERIVATION cohort consisted of 226 healthy consecutive participants who volunteered to undergo NCT for coronary calcium scoring (CCS) as part of the EISNER (Early Identification of Subclinical Atherosclerosis by Noninvasive Imaging Research) cohort. Inclusion criteria included: asymptomatic status, no known cardiovascular disease, diabetes mellitus or smoking, a CCS of 0, low-density lipoprotein levels <160 mg/dl, triglycerides levels <500 mg/dl, and a Framingham’s risk-score (FRS) of ≤6%. Exclusion criteria were pericardial effusion or thickening and a lower-than-excellent image quality on NCT. All participants provided written consent according to our Institutional Review Board policy.
NCT performed for CCS screening was used to quantify EFV as previously described.8 Briefly, NCT was acquired using either an electron-beam (e-Speed, GE Healthcare, Milwaukee, WI, USA) or a 4-slice CT scanner (Somatom Volumezoom, Siemens Medical Solutions, Forchheim, Germany). Scan parameters included: heart-rate dependent ECG-triggering (typically 45–60% of R-R interval), 35cm field-of-view, and 512×512 matrix size. Tube voltage was 120kVp. Slice thickness was 2.5mm. Foci of coronary calcification were identified by an experienced technician, using semiautomatic commercial software on a NetraMD workstation (ScImage, Los Altos, CA, USA). Using the Agatston method, the software calculated the total CCS.9 All NCT images and scoring were reviewed by an expert reader.
Acquired NCT images were transferred to a separate workstation. Each NCT was evaluated by a blinded, experienced reader, who quantified EFV using the validated QFAT software (Cedars-Sinai Medical Center, Los Angeles, CA, USA, Figure 1).10 QFAT utilizes algorithms for automatic thoracic cavity and heart-segmentation and quantification of thoracic fat, as previously described.11 Image data was processed as follows: first, the upper and lower slice limits were manually defined using axial views. The upper slice limit was marked at the bifurcation of the pulmonary artery trunk to its right main pulmonary artery stem, and the lower slice limit was chosen as the last slice containing the posterior descending coronary artery in the inferior atrioventricular groove. Next, the reader defined 5–10 control points on the pericardium in sequential axial views and the software automatically generated a smooth closed pericardial contour and calculated EFV. Contiguous 3D voxels between the HU limits of 190 to 30 weredefined as fat voxels.12 EFV was reported in centimeter-cube (cm3) and indexed to BSA (EFVi).
Figure 1. EFV measurement using QFAT software.
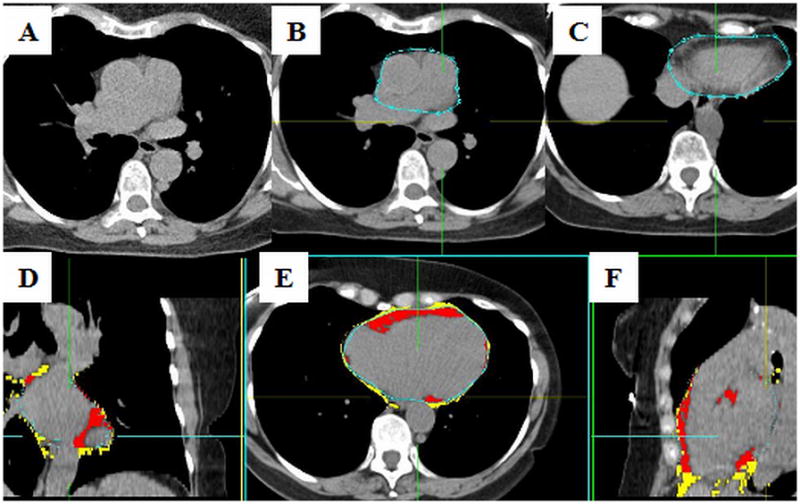
Legends: A–NCT; B– pericardial contours drawn at the most superior slice, at the bifurcation of the main pulmonary artery to its right main stem; C– pericardial contours drawn at the most inferior slice, where the posterior descending coronary artery in the inferior atrioventricular groove is last seen (A, B and C are axial views); D, E and F– coronal, axial and sagital views, respectively, showing the EFV in red, and the thoracic fat volume in yellow
Legends: EFV– epicardial fat volume; NCT– non-contrast enhanced cardiac computed tomography; QFAT– quantification of epicardial fat software (Cedars-Sinai Medical Center, Los Angeles, CA, USA)
To assess the clinical utility of the newly derived upper normal EFVi threshold, we analyzed a separate EISNER population previously published by our group.13 In this case-control study, each of 58 patients with MACE (“EVENT”) were matched by propensity scores to 3 same-sex event-free controls (“CONTROL”), generating a total of 232 patients. Briefly, 79% were males, mean age was 61±9 years and mean FRS was 13±7, without significant differences between the EVENT and the CONTROL subgroups. This prior work showed that increased EFV (a non-indexed value of 125cm3) trended to predict MACE at 4 years of follow-up, independent of CCS ≥400 and FRS. MACE consisted of cardiovascular death, myocardial infarction, stroke and percutaneous or surgical coronary artery revascularization. In this cohort, we re-analyzed the patients using the newly derived upper normal threshold of EFVi to assess the ability of higher than normal EFVi to discriminate between those who suffered MACE and those who did not.
The distribution of EFVi in the healthy DERIVATION cohort was found to be non-normal, therefore reported as median with inter-quartile range, and non-parametric statistical tests were used: Spearman for correlations between EFV and BSA and between EFVi and age, and Mann-Whitney for correlation between EFVi and sex. An abnormally high EFVi was defined as >95th-percentile, according to the threshold definition recommended for any range of biological values.14 Mann-Whitney test was used to compare medians of EFVi between the EVENT and the CONTROL cohorts. Chi-square test was used for analyzing the difference in frequencies of high EFVi between the same cohorts. Odds ratio (OR) with 95% confidence interval (CI) of the newly defined abnormal threshold were calculated for the prediction of MACE after adjusting for CCS ≥400 and FRS, using a multivariable logistic regression model. Receiver operator characteristic-areas under curve (ROC AUC) were used to compare prediction of MACE by FRS, CCS ≥ 400 and abnormally elevated EFVi to prediction by FRS and CCS≥400 alone. FRS was considered as a continuous variable. CCS was considered as a clinically-driven, binary variable with a threshold of 400. Elevated EFVi was present if EFVi exceeded the 95th-percentile calculated in the DERIVATION cohort. We also repeated this analysis to test the 90th-percentile as a cutoff and also using absolute rather than indexed EFV, as was suggested by Thanassoulis et al.15 All p values were two-tailed and considered significant if <0.05.
For quality control, each NCT, CCS and pericardial contours and upper and lower slice limits were rechecked. Cases in which image quality was not excellent and epicardial fat border determination was discrepant between the software and the reader (n=4) were excluded.
RESULTS
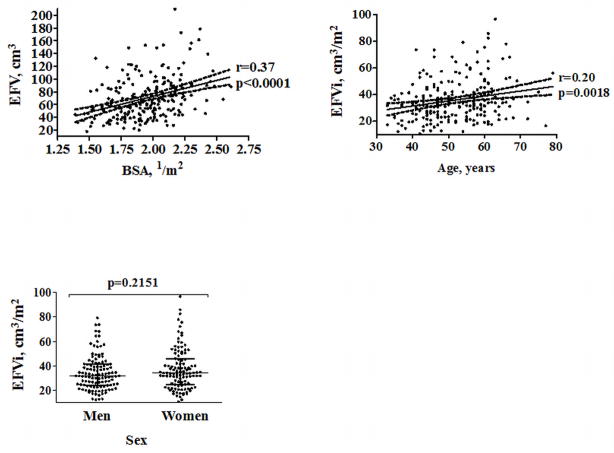
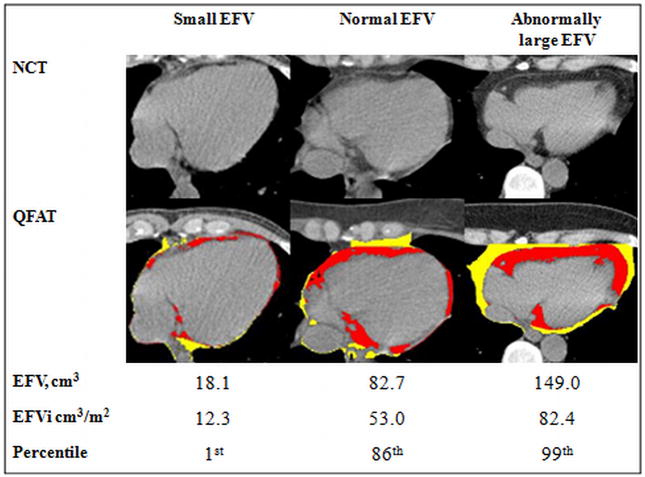
Demographic characteristics of the DERIVATION cohort are summarized in Table 1. Median, range and 25th and 75th-percentiles of EFVi were 33.3, 10.8–96.6, 24.5 and 42.1cm3/m2, respectively. EFV correlated modestly to BSA (r=0.37, p<0.0001). There was no significant difference in median EFVi between men and women (31.8 [24.2, 41.3] vs. 34.2 [24.8, 45.5] cm3, median [inter-quartile range], p=0.2151). There was a weak correlation between EFVi and age (r=0.20, p=0.0018, Figure 2). The 95th-percentile of EFVi distribution was 68.1cm3/m2. Examples of patients with normal and abnormal values of EFVi are shown in Figure 3.
Table 1.
General characteristics of the DERIVATION cohort (n=226)*
| Age (years) | 52±9 |
| Males | 116 (51%) |
| Body mass index (Kg/m2) | 26.8±4.9 |
| Body surface area (1/m2) | 1.9±0.2 |
| Hypertension | 77 (34.1%) |
| Hyperlipidemia | 60 (26.5%) |
| Diabetes mellitus | 0 (0%) |
| Smoking | 0 (0%) |
| Family history of premature CAD | 77 (34.1%) |
| Framingham’s risk score, median [range] | 2.0 [0.5–6] |
| Epicardial fat volume (cm3), median [range] | 64.8 [18.1–209.7] |
| Indexed epicardial fat volume (cm3/m2), median [range] | 33.3 [10.8–96.6] |
| Indexed epicardial fat volume, 95th percentile (cm3/m2) | 68.1 |
All values represent the mean, unless otherwise specified as median.
Figure 2. Correlation of EFVi with BSA and age, and association with sex .
Legends: BSA– body surface area; EFV– epicardial fat volume; EFVi– EFV indexed to BSA
*The 2 upper figures show trend-lines with their 95% confidence interval. The lower figure shows medians and 25th and 75th-percentiles limits
Figure 3. Examples of NCT scans and the corresponding EFV, EFVi, and percentiles of EFVi of patients with small, normal and abnormally high EFVi values.
Legends: EFVi epicardial fat volume indexed to body surface area; NCT– non-contrast enhanced cardiac computed tomography; QFAT– quantification of epicardial fat software (Cedars-Sinai Medical Center, Los Angeles, CA, USA); Red area– epicardial fat; Yellow area– thoracic fat
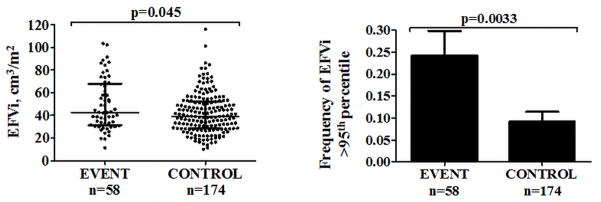
Demographic and risk factor data of the EVENT and CONTROL patients were previously reported.13 There were no significant differences in age, CCS, and prevalence of traditional risk factors between the subgroups. EVENT patients had significantly greater median EFVi (42.7 [31.3–67.9] vs. 39.2 [28.5–52.3] cm3, median [range], p=0.045) and greater frequencies of abnormally high EFVi (24.1% vs. 9.2%, χ2=10.4, df=1, p=0.0033, Figure 4) than CONTROL patients. When repeating this analysis to test the 90th-percentile as a cutoff, valuing 57.0cm3, the difference between the frequencies was weaker (32.8% in EVENT vs. 18.4% in CONTROL, χ2=5.2, df=1, p=0.043). Abnormally high EFVi was significantly associated with MACE (OR 3.1, 95% CI 1.4–6.9, p=0.0033) and remained so after adjustments for CCS≥400 and FRS (OR 2.8, 95% CI 1.3–6.4, p=0.012).
Figure 4. Comparison of EFVi between EVENT and CONTROL in the VALIDATION cohort.
Legends: EFVi epicardial fat volume indexed to body surface area
*The left figure shows medians and 25th and 75th-percentile limits. The right figure shows prevalence with standard error
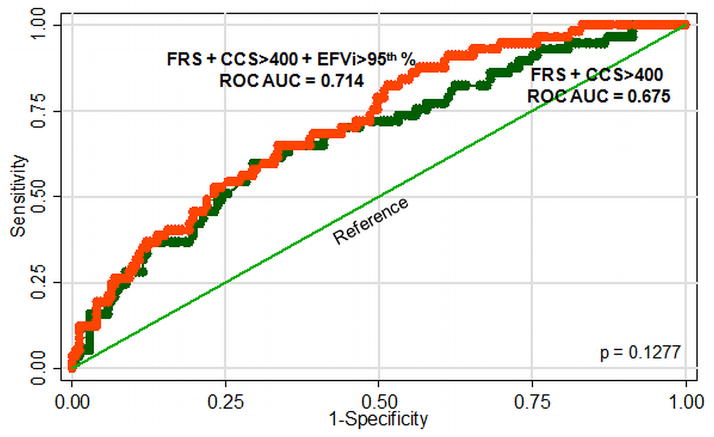
Comparison of ROC curves showed that the area-under-the-curve for FRS + CCS≥400 + abnormally high EFVi trended to be higher than for FRS + CCS≥400 alone (0.714 vs. 0.675 respectively, p=0.1277, Figure 5). When ROC curves were constructed using the 90th-percentile as the upper normal limit, AUCs were less different (0.690 vs. 0.675, respectively, p=0.3745). Repeating the multivariable regression model and the ROC AUC analysis using log(CCS) or absolute instead of indexed values of EFV was less predictive of MACE (not shown).
Figure 5. ROC curves constructed to compare the additive predictive value of abnormally high EFVi to FRS and CCS≥400. Addition of abnormally high EFVi trended to increase AUC from 0.675 to 0.714 but did not reach statistical significance.
Legends: CCS– coronary calcium score; EFVi– epicardial fat volume indexed to body surface area; FRS– Framingham’s risk score; ROC AUC– receiver operator characteristics-area under curve
DISCUSSION
In this dual cohort study, we determined the upper threshold of EFVi from NCT in a healthy population and applied it in a separate population assessed for MACE. EFVi exceeding the newly defined upper normal threshold was significantly and independently associated with MACE and trended to predict MACE better when added to the combination of FRS and CCS. To our knowledge, the upper normal threshold for anthropometric-indexed-EFV in a healthy population and its validation regarding MACE has not been reported before.
Distribution of EFVi was non-normal, and the upper normal limit was calculated at 68.1cm3/m2. This value was not affected by sex and only weakly affected by age, and corresponds to our previously reported non-indexed cutoff of 125cm3 (given our mean BSA of 1.9m2) as a significant and independent predictor of subsequent cardiovascular events.13,16 There are several differences between our work and a recent study evaluating normal limits for epicardial fat.15 We adopted the 95th-percentile value, which has been strongly recommended for defining normal limits of biological data,14 to identify abnormally high EFVi, whereas the prior study calculated the 90th-percentile as the cutoff for normal ranges. Furthermore, we adjusted EFV to anthropometric data and evaluated the association of this indexed value with MACE. We used slightly different definitions for the attenuation boundaries of fatty tissue (−30 to −190 vs. −45 to −195 HU), as supported by numerous studies,12,17 and our data was derived from healthier volunteers, as strengthened by our inclusion criteria.
Systematic evidence for EFV as a novel marker for cardiovascular risk emerged only in the past decade. In 2001, Taguchi et al. showed that, in Japanese men, EFV measured on NCT showed a stronger relationship than other fat depots to the presence or cardiac risk factors in predicting CAD and its severity.1 Recently, reports by other investigators suggest that epicardial fat may act as a paracrine organ that influences the coronary arteries by promoting chronic inflammation 18 and endothelial dysfunction.19 The paracrine effect hypothesis was augmented by Mahabadi et al., who showed that segmental pericoronary fat is related to atherosclerosis in the local arterial segment.20 A study by Ding et al.,21 who measured pericardial rather than epicardial fat volume and only within 15mm above and 30mm below the left main coronary artery, demonstrated that increased pericardial fat predicts a higher risk of future CAD; in our study, the full vertical length of the heart was included to measure directly the epicardial fat bounded by the pericardium, and not all pericardial fat. In 2010, our group showed that EFV was related to myocardial hypoperfusion, as measured by single photon emission computed tomography-myocardial perfusion imaging 16 and that adding EFV measurement with a non-indexed cutoff value higher than 125cm3 to CCS≥400 and FRS, trended to predict MACE better than relying on CCS≥400 and FRS alone.13
NCT is widely used for determining CCS. The ability to obtain additional risk-stratifying information from EFV without more testing could add to the clinical value of NCT. NCT-aided EFV measurement has been shown to be reproducible and independently associated with coronary atherosclerosis, cardiovascular risk 6,7,22,23 and depressed myocardial function.24 It has further been shown that EFV is associated with arrhythmogenesis. Lin et al. have suggested that epicardial fat contains arrhythmogenic foci that induce atrial fibrillation (AF).25 Other investigators have demonstrated that EFV is correlated to the prevalence of AF even after adjusting for traditional AF risk factors.3,26
The mechanism of the deleterious effect of epicardial fat on the coronary arteries has been addressed in several articles. Baker et al. reported that epicardial and omental fat have a comparable pathogenic mRNA profile 18 and furthering the work of Mahabadi et al. suggested that the epicardial fat exerts a paracrine effect on the coronary arteries by producing a state of insulin resistance, through the release of both pro and anti-inflammatory cytokines into the coronary artery circulation.27 It has been suggested that visceral and epicardial fat both contribute to atherosclerosis, the former by producing a state of insulin resistance and hepatic production of pro-inflammatory factors, and the latter in a paracrine manner.28 Tadros et al. recently concluded that EFV correlates with inflammatory markers in the Framingham Heart Study.29
We are aware of several limitations of this study. Since the visceral and parietal pericardium are in very close proximity, the pericardial contours generated likely included some parietal pericardium and pericardial space. However, none of the patients in the DERIVATION cohort had pericardial effusion or pericardial thickening, therefore effect of this limitation is expected to be minimal. Definitions of cranial and caudal borders of epicardial fat were somewhat arbitrary but meant to be easily replicable. Application of findings from this study is limited to EFV calculated using these boundaries. Severe obesity may not be appropriately reflected by BSA, thus findings in this study may not be applicable to such patients. The VALIDATION cohort was a case-controlled population. The case-control approach results in the possibility that there could be confounders not accounted for. The MACE rate of 25% in this cohort is far higher than that expected in the target population for EFVi measurement and was strictly used to illustrate the potential predictive capability of abnormally high EFVi. Nevertheless, the 2 groups were recruited from the EISNER cohort, meaning that they resemble in means of ethnicity and geographical location, and the DERIVATION cohort is composed of asymptomatic volunteers who are as close to the “normal” population as possible. Lastly, most new assays are first measured in a healthy population, to derive the normal limits, and then applied on the general population, using the cutoff derived from the healthy population.
Identifying a standardized approach to defining abnormal EFV burden could aid in patient risk stratification, and may become applicable in clinical practice. In this study, we provide a threshold determination and case-control validation of abnormal EFVi burden which could aid in the clinical application of this measurement. Additional larger and prospective event-based studies will be helpful in further validating this threshold.
Acknowledgments
Sources of Funding
Haim Shmilovich MD is a fellow of Save a Heart Foundation, Los Angeles, CA, USA, and receives a fellowship grant from the American Physician Fellowship for Medicine in Israel.
This work was supported by a grant from the National Institute of Biomedical Imaging and Bioengineering (R21EB006829, Damini Dey PhD), and the Eisner, Glazer, and Lincy Foundations, Beverly Hills, CA, USA (Daniel S Berman MD FACC). The EISNER1 cohort used was partially supported by the NIH NCRR GCRC grant (M01-RR00425).
Footnotes
Disclosure and Conflicts of Interest: None
Publisher's Disclaimer: This is a PDF file of an unedited manuscript that has been accepted for publication. As a service to our customers we are providing this early version of the manuscript. The manuscript will undergo copyediting, typesetting, and review of the resulting proof before it is published in its final citable form. Please note that during the production process errors may be discovered which could affect the content, and all legal disclaimers that apply to the journal pertain.
References
- 1.Taguchi R, Takasu J, Itani Y, Yamamoto R, Yokoyama K, Watanabe S, Masuda Y. Pericardial fat accumulation in men as a risk factor for coronary artery disease. Atherosclerosis. 2001;157:203–209. doi: 10.1016/s0021-9150(00)00709-7. [DOI] [PubMed] [Google Scholar]
- 2.Ahn S, Lim H, Joe D, Kang S, Choi B, Choi S, Yoon M, Hwang G, Tahk S, Shin J. Relationship of epicardial adipose tissue by echocardiography to coronary artery disease. Heart. 2008;94:e7. doi: 10.1136/hrt.2007.118471. [DOI] [PubMed] [Google Scholar]
- 3.Thanassoulis G, Massaro J, O'Donnell C, Hoffmann U, Levy D, Ellinor P, Wang T, Schnabel R, Vasan R, Fox C, Benjamin E. Pericardial fat is associated with prevalent atrial fibrillation: the Framingham Heart Study. Circ Arrhythm Electrophysiol. 2010;3:345–350. doi: 10.1161/CIRCEP.109.912055. [DOI] [PMC free article] [PubMed] [Google Scholar]
- 4.Iacobellis G, Ribaudo M, Assael F, Vecci E, Tiberti C, Zappaterreno A, Di Mario U, Leonetti F. Echocardiographic epicardial adipose tissue is related to anthropometric and clinical parameters of metabolic syndrome: a new indicator of cardiovascular risk. J Clin Endocrinol Metab. 2003;88:5163–5168. doi: 10.1210/jc.2003-030698. [DOI] [PubMed] [Google Scholar]
- 5.Nichols JH, Samy B, Nasir K, Fox CS, Schulze PC, Bamberg F, Hoffmann U. Volumetric measurement of pericardial adipose tissue from contrast-enhanced coronary computed tomography angiography: a reproducibility study. J Cardiovasc Comput Tomogr. 2008;2:288–295. doi: 10.1016/j.jcct.2008.08.008. [DOI] [PMC free article] [PubMed] [Google Scholar]
- 6.Wang T, Lee W, Shih F, Huang C, Chang Y, Chen W, Lee Y, Chen M. Relations of epicardial adipose tissue measured by multidetector computed tomography to components of the metabolic syndrome are region-specific and independent of anthropometric indexes and intraabdominal visceral fat. J Clin Endocrinol Metab. 2009;94:662–669. doi: 10.1210/jc.2008-0834. [DOI] [PubMed] [Google Scholar]
- 7.Ueno K, Anzai T, Jinzaki M, Yamada M, Jo Y, Maekawa Y, Kawamura A, Yoshikawa T, Tanami Y, Sato K, Kuribayashi S, Ogawa S. Increased epicardial fat volume quantified by 64-multidetector computed tomography is associated with coronary atherosclerosis and totally occlusive lesions. Circ J. 2009;73:1927–1933. doi: 10.1253/circj.cj-09-0266. [DOI] [PubMed] [Google Scholar]
- 8.Berman DS, Wong ND, Gransar H, Miranda-Peats R, Dahlbeck J, Hayes SW, Friedman JD, Kang X, Polk D, Hachamovitch R, Shaw L, Rozanski A. Relationship between stress-induced myocardial ischemia and atherosclerosis measured by coronary calcium tomography. J Am Coll Cardiol. 2004;44:923–930. doi: 10.1016/j.jacc.2004.06.042. [DOI] [PubMed] [Google Scholar]
- 9.Agatston A, Janowitz W, Hildner F, Zusmer N, Viamonte MJ, Detrano R. Quantification of coronary artery calcium using ultrafast computed tomography. J Am Coll Cardiol. 1990;15:827–832. doi: 10.1016/0735-1097(90)90282-t. [DOI] [PubMed] [Google Scholar]
- 10.Dey D, Wong N, Tamarappoo B, Nakazato R, Gransar H, Cheng V, Ramesh A, Kakadiaris I, Germano G, Slomka P, Berman D. Computer-aided non-contrast CT-based quantification of pericardial and thoracic fat and their associations with coronary calcium and Metabolic Syndrome. Atherosclerosis. 2010;209:136–141. doi: 10.1016/j.atherosclerosis.2009.08.032. [DOI] [PMC free article] [PubMed] [Google Scholar]
- 11.Dey D, Suzuki Y, Suzuki S, Ohba M, Slomka P, Polk D, Shaw L, Berman D. Automated quantitation of pericardiac fat from noncontrast CT. Invest Radiol. 2008;43:145–153. doi: 10.1097/RLI.0b013e31815a054a. [DOI] [PubMed] [Google Scholar]
- 12.Wheeler G, Shi R, Beck S, Langefeld C, Lenchik L, Wagenknecht L, Freedman B, Rich S, Bowden D, Chen M, Carr J. Pericardial and visceral adipose tissues measured volumetrically with computed tomography are highly associated in type 2 diabetic families. Invest Radiol. 2005;40:97–101. doi: 10.1097/00004424-200502000-00007. [DOI] [PubMed] [Google Scholar]
- 13.Cheng V, Dey D, Tamarappoo B, Nakazato R, Gransar H, Miranda-Peats R, Ramesh A, Wong N, Shaw L, Slomka P, Berman D. Pericardial fat burden on ECG-gated noncontrast CT in asymptomatic patients who subsequently experience adverse cardiovascular events. JACC Cardiovasc Imaging. 2010;3:352–360. doi: 10.1016/j.jcmg.2009.12.013. [DOI] [PMC free article] [PubMed] [Google Scholar]
- 14.Poulsen OM, Holst E, Christensen JM. Calculation and application of coverage intervals for biological reference values. Pure Appl Chem. 1997;69:1601–1611. [Google Scholar]
- 15.Thanassoulis G, Massaro JM, Hoffmann U, Mahabadi AA, Vasan RS, O'Donnell CJ, Fox CS. Prevalence, distribution, and risk factor correlates of high pericardial and intrathoracic fat depots in the Framingham heart study. Circ Cardiovasc Imaging. 2010;3:559–566. doi: 10.1161/CIRCIMAGING.110.956706. [DOI] [PMC free article] [PubMed] [Google Scholar]
- 16.Tamarappoo B, Dey D, Shmilovich H, Nakazato R, Gransar H, Cheng V, Friedman J, Hayes S, Thomson L, Slomka P, Rozanski A, Berman D. Increased Pericardial Fat Volume Measured From Noncontrast CT Predicts Myocardial Ischemia by SPECT. JACC Cardiovasc Imaging. 2010;3:1104–1112. doi: 10.1016/j.jcmg.2010.07.014. [DOI] [PMC free article] [PubMed] [Google Scholar]
- 17.Yoshizumi T, Nakamura T, Yamane M, Islam A, Menju M, Yamasaki K, Arai T, Kotani K, Funahashi T, Yamashita S, Matsuzawa Y. Abdominal fat: standardized technique for measurement at CT. Radiology. 1999;211:283–286. doi: 10.1148/radiology.211.1.r99ap15283. [DOI] [PubMed] [Google Scholar]
- 18.Baker A, Silva N, Quinn D, Harte A, Pagano D, Bonser R, Kumar S, McTernan P. Human epicardial adipose tissue expresses a pathogenic profile of adipocytokines in patients with cardiovascular disease. Cardiovasc Diabetol. 2006;5:1. doi: 10.1186/1475-2840-5-1. [DOI] [PMC free article] [PubMed] [Google Scholar]
- 19.Aydin H, Toprak A, Deyneli O, Yazici D, Tarçin O, Sancak S, Yavuz D, Akalin S. Epicardial fat tissue thickness correlates with endothelial dysfunction and other cardiovascular risk factors in patients with metabolic syndrome. Metab Syndr Relat Disord. 2010;8:229–234. doi: 10.1089/met.2009.0080. [DOI] [PubMed] [Google Scholar]
- 20.Mahabadi A, Reinsch N, Lehmann N, Altenbernd J, Kälsch H, Seibel R, Erbel R, Möhlenkamp S. Association of pericoronary fat volume with atherosclerotic plaque burden in the underlying coronary artery: a segment analysis. Atherosclerosis. 2010;211:195–199. doi: 10.1016/j.atherosclerosis.2010.02.013. [DOI] [PubMed] [Google Scholar]
- 21.Ding J, Hsu F, Harris T, Liu Y, Kritchevsky S, Szklo M, Ouyang P, Espeland M, Lohman K, Criqui M, Allison M, Bluemke D, Carr J. The association of pericardial fat with incident coronary heart disease: the Multi-Ethnic Study of Atherosclerosis (MESA) Am J Clin Nutr. 2009;90:499–504. doi: 10.3945/ajcn.2008.27358. [DOI] [PMC free article] [PubMed] [Google Scholar]
- 22.Greif M, Becker A, von Ziegler F, Lebherz C, Lehrke M, Broedl U, Tittus J, Parhofer K, Becker C, Reiser M, Knez A, Leber A. Pericardial adipose tissue determined by dual source CT is a risk factor for coronary atherosclerosis. Arterioscler Thromb Vasc Biol. 2009;29:781–786. doi: 10.1161/ATVBAHA.108.180653. [DOI] [PubMed] [Google Scholar]
- 23.Konishi M, Sugiyama S, Sugamura K, Nozaki T, Ohba K, Matsubara J, Matsuzawa Y, Sumida H, Nagayoshi Y, Nakaura T, Awai K, Yamashita Y, Jinnouchi H, Matsui K, Kimura K, Umemura S, Ogawa H. Association of pericardial fat accumulation rather than abdominal obesity with coronary atherosclerotic plaque formation in patients with suspected coronary artery disease. Atherosclerosis. 2010;209:573–578. doi: 10.1016/j.atherosclerosis.2009.10.008. [DOI] [PubMed] [Google Scholar]
- 24.Sacks H, Fain J. Human epicardial adipose tissue: a review. Am Heart J. 2007;153:907–917. doi: 10.1016/j.ahj.2007.03.019. [DOI] [PubMed] [Google Scholar]
- 25.Lin Y, Chen Y, Chen S. Potential atrial arrhythmogenicity of adipocytes: implications for the genesis of atrial fibrillation. Med Hypotheses. 2010;74:1026–1029. doi: 10.1016/j.mehy.2010.01.004. [DOI] [PubMed] [Google Scholar]
- 26.Al Chekakie M, Welles C, Metoyer R, Ibrahim A, Shapira A, Cytron J, Santucci P, Wilber D, Akar J. Pericardial fat is independently associated with human atrial fibrillation. J Am Coll Cardiol. 2010;56:784–788. doi: 10.1016/j.jacc.2010.03.071. [DOI] [PubMed] [Google Scholar]
- 27.Iacobellis G, Willens H, Barbaro G, Sharma A. Threshold values of high-risk echocardiographic epicardial fat thickness. Obesity. 2008;16:887–892. doi: 10.1038/oby.2008.6. [DOI] [PubMed] [Google Scholar]
- 28.Berman DS, Cheng VY, Dey D. Not all body fat weighs equally in the acceleration of coronary artery disease. JACC Cardiovasc Imaging. 2010;3:918–920. doi: 10.1016/j.jcmg.2010.08.002. [DOI] [PMC free article] [PubMed] [Google Scholar]
- 29.Tadros T, Massaro J, Rosito G, Hoffmann U, Vasan R, Larson M, Keaney JJ, Lipinska I, Meigs J, Kathiresan S, O'Donnell C, Fox C, Benjamin E. Pericardial fat volume correlates with inflammatory markers: the Framingham Heart Study. Obesity. 2010;18:1039–1045. doi: 10.1038/oby.2009.343. [DOI] [PMC free article] [PubMed] [Google Scholar]


