

Abstract
Objective
To test the hypothesis that heart rate characteristics (HRC) monitoring improves neonatal outcomes.
Study design
Two-group, parallel, individually randomized controlled clinical trial of 3003 very low birth weight infants in 9 NICUs. In one group, HRC monitoring was displayed; in the other, it was masked. The primary outcome was number of days alive and ventilator-free in the 120 days after randomization. Secondary outcomes were mortality, number of ventilator days, NICU stay and antibiotic use.
Results
Mortality was reduced in infants whose HRC monitoring was displayed, from 10.2% to 8.1% (HR = 0.78, 95% CI = 0.61 to 0.99, P = 0.04, number needed to monitor 48), and there was a trend toward increased days alive and ventilator-free (95.9 of 120 days compared to 93.6 in controls, P = 0.08). Mortality benefit was concentrated in infants with birth weight <1000g (HR=0.74, 95% CI 0.57 to 0.95, P=0.02, number needed to monitor 23). There were no significant differences in the other outcomes.
Conclusion
Heart rate characteristics monitoring can reduce mortality in very low birth weight infants.
Keywords: Neonatal sepsis, sample entropy, predictive monitoring, heart rate variability
Late-onset neonatal sepsis is an important cause of morbidity and mortality among very low birth weight infants in a neonatal intensive care unit (NICU) (1). Signs of illness are subtle and nonspecific, so a clear-cut clinical presentation may appear only late in the course, (2) by which time severe illness is present.
Reduced variability and transient decelerations in heart rate may be present in the hours to days prior to diagnosis of late-onset proven or clinical neonatal sepsis (3). Although the precise mechanisms are not known, one possibility is vagal activation in response to infection via the cholinergic anti-inflammatory pathway (4–6). These abnormal heart rate characteristics in response to systemic infection and inflammation have been characterized mathematically, and the resulting heart rate characteristics index is the fold-increase in risk of sepsis during the next 24 hours (7, 8). This risk assessment is estimated by an externally validated multivariable logistic regression that is derived from calculations of the standard deviation of the heartbeat intervals along with novel measures of sample asymmetry (9) and sample entropy (10–12). The index can be computed in real time and displayed continuously at the bedside.
Monitoring the heart rate characteristics index score in high-risk premature infants might result in improved outcomes through early warning of subacute potentially catastrophic illnesses characterized by systemic inflammation such as sepsis. Such early warning might lead to patient-specific testing and intervention including, in some cases, early antibiotic therapy. To test this hypothesis, we performed a two-group, parallel, individually randomized controlled clinical trial.
Methods
Very low birth weight (<1500 grams birth weight) infants at 9 hospitals were randomized to display or not to display the heart rate characteristics monitor results. This was a parallel group study with 1:1 randomization. Initially, all inborn and outborn babies with birth weights < 1500 grams were eligible. After enrolling 257 infants, we further restricted inclusion criteria for outborn infants to include only very low birth weight infants who had been transferred to a study center at < 33 weeks post-menstrual age. This modification was made to exclude the rare more mature very low birth weight infant at low risk for neonatal sepsis who was transferred to a study center for a short (often surgical) stay. The initial University of Virginia Institutional Review Board did not require informed consent. After the first 186 infants were enrolled there, informed consent was added to the protocol at the request of an NIH Special Emphasis group.
From 4/2004 to 5/2010 we randomized 3003 infants. The study was conducted in the NICUs of the University of Virginia, Wake Forest University, University of Alabama at Birmingham, Vanderbilt University, University of Miami / Jackson Memorial Hospital, Greenville SC Hospital System, Winnie Palmer Children’s Hospital (Orlando, FL), and Pennsylvania State University. Institutional review boards approved the protocol at each study site.
Heart rate characteristics monitoring
We used the HeRO™ monitoring system provided by Medical Predictive Science Corporation (MPSC), Charlottesville, VA, in a special study mode that linked randomization status to display features. Prior to the study, the system received 510(k) FDA clearance for reporting the heart rate characteristics index as a measure of reduced variability and transient decelerations. The monitors displayed an index showing the fold-increase in the risk of developing neonatal sepsis in the next 24 hours, as derived and verified from data collected prior to the study at the University of Virginia and Wake Forest University (7). Values were updated hourly and included a graph of the 5-day trend, thus permitting the clinicians to quickly evaluate changes in the index. Although physicians, nurse practitioners, and bedside nurses were instructed that a rising heart rate characteristics monitoring score should lead to a bedside evaluation and consideration for blood tests, specific actions were not required by the study protocol. All patients received conventional bedside vital sign and waveform monitoring. For control patients, the heart rate characteristics monitor results were recorded, but not displayed. For infants whose heart rate characteristics monitoring results were displayed, the heart rate characteristics index was shown on separate monitors.
Outcomes
The primary outcome measure was the number of days alive and off the ventilator in the 120 days following randomization (13, 14), calculated as 120 days minus the number of days on ventilator minus number of days deceased. We also evaluated four secondary outcomes: in-hospital mortality, number of ventilator days, length of NICU stay, and number of days on antibiotics. Follow-up at 120 days was made by telephone and mail. We also evaluated outcomes at the time of discharge from the NICU or the hospital, for which data certainty was complete. Results did not differ for these two approaches. We noted dates and times of blood cultures drawn for the suspicion of sepsis, and the use and type of all parenteral antibiotics not including acyclovir or fluconazole used for antifungal prophylaxis.
Database management
Research staff at each institution entered dates and times of death, mechanical ventilation, antibiotic doses, and NICU and hospital admission and discharge into a dedicated computerized database overseen by the University of Virginia Clinical Trials Office (CTO) and using study software developed by MPSC in accordance with a 1999 FDA Guidance (15). Personnel from the CTO collected patient enrollment and death data directly from the study centers every week by fax, verified every death from the medical record, and made yearly site-monitoring visits to compare the database and clinical records of a random 10% selection of the study infants. In addition, CTO personnel regularly submitted quality-checking database queries. Study site personnel made required corrections in the database for patients discharged within the past 6 months. Thereafter, MPSC made the corrections to the database records, following a written request from the site personnel or from the CTO. Audit trails were maintained for all database entries and for corrections to originally reported data. Raw data were submitted for analysis by the independent statistician (GJS) for DSMB meetings and for the final report.
Sample size
We reasoned that an increase of 2.0 days of life without mechanical ventilation was clinically meaningful, and we estimated that a total sample size of 3000 was sufficient to test this hypothesis with α=0.05 and 1-β=0.90. The independent statistician (GJS) reported interim analyses to the Data Safety Monitoring Board (DSMB) after each increment of 300 completed patients, excluding cases with missing outcome data. The latest report prepared for DSMB review was submitted February 2010, described outcomes of the first 2400 randomized patients, and presented an analysis corrected for all the interim analyses. The mortality difference approached statistical significance toward the end of the DSMB review, but never crossed the threshold for stopping the trial.
Randomization and masking
Patients were first stratified by birth weight at 1000g and then randomized in 8-subject blocks at each site using computer-generated sequences. Once randomized, heart rate characteristics monitor data were displayed immediately for the study group and masked for the control group. Research coordinators and study physicians recruited participants and obtained informed parental consent. NICU healthcare personnel were aware of the assignment to the study group, had continuous access to heart rate characteristics monitoring results when displayed, and were masked to the heart rate characteristics index of the control infants. There were no other protocol-defined differences in the care.
Statistical methods
The statistical significance of differences between the control and study group baseline characteristics were assessed using single factor analysis of variance tests to compare means for continuous variables, and chi-square tests to compare proportions. The statistical significance of differences between groups in mean number of days alive and off the ventilator, days in NICU, ventilator days and days on antibiotics was tested using single factor analysis of variance. Differences in survival between the study and control groups were assessed using proportional hazards regression analysis and the log rank test statistic, with both left truncation and right censoring. Cases in the analysis are left truncated based on the study enrollment date (date of consent) and right censored based on the end of follow-up (either date of death, discharge from hospital, or discharge from NICU). Hazard ratios are reported with 95% confidence intervals. The significance of the difference in rates of blood cultures was tested using a large sample Z-test. All statistical test results were considered to be significant at the p < 0.05 threshold. All calculations were performed using SAS 9.2 (SAS Institute Inc., SAS Campus Drive, Cary, North Carolina 27513, USA.). The trial is registered at ClinicalTrials.gov (NCT00307333).
Subgroup analysis
We assessed the heterogeneity of treatment effect for the pre-specified subgroup of extremely low birth weight (<1000g, ELBW) infants, who are at highest risk for mortality. The statistical significance of difference in treatment effect was assessed in the Cox proportional hazards regression model by testing significance of the interaction term combining effects of the intervention and ELBW status.
Results
We screened 5,995 infants for eligibility (Figure 1). A total of 3003 infants were randomized from April 2004 through May 2010. A total of 2,989 infants were included in the analysis. Before unblinding and analysis, we excluded 14 randomized infants for birth weight ≥ 1500 grams (4 study, 1 control), error in randomization (3, all from the study group), consent withdrawn (2 study, 1 control) or because of sustained cardiac arrhythmia (2 study, 1 control). There were no significant differences between the control and study groups by birth weight, gestational age, study site, sex, race, Apgar score, admission diagnosis (Table), or in any other characteristic measured at enrollment.
Figure 1.
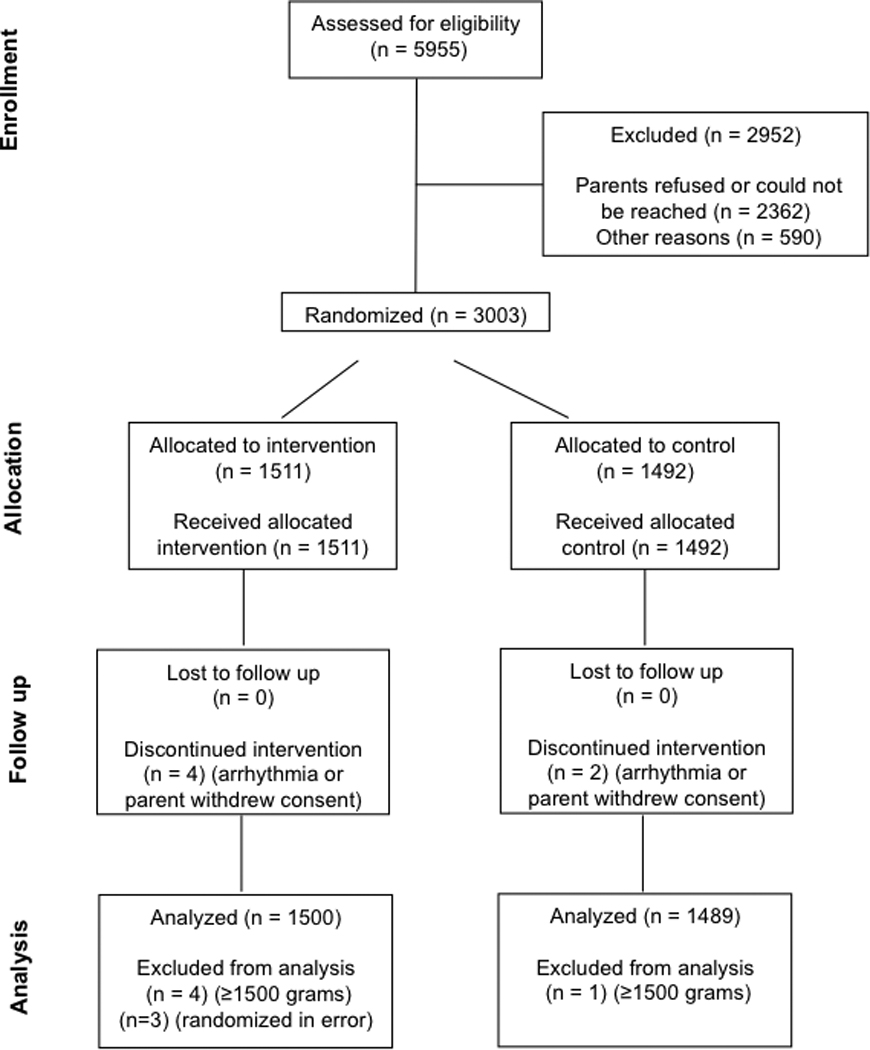
CONSORT diagram
Table 1.
Characteristics and outcomes
| Infants whose heart rate characteristics monitoring results were displayed (n=1500) |
Control (n=1489) |
P value |
|
|---|---|---|---|
| CHARACTERISTICS | |||
| Birth weight, mean (S.D.), g | 999 (283) | 986 (289) | 0.22 |
| Gestational age, mean (S.D.), weeks | 28 (2.8) | 28 (2.8) | 0.54 |
| Male sex, No. (%) | 791 (52.7) | 767 (51.5) | 0.49 |
| Race* | 0.56 | ||
| Non-Hispanic white, No. (%) | 785 (52.3) | 727 (48.8) | |
| Non-Hispanic black, No. (%) | 533 (35.5) | 563 (37.8) | |
| Hispanic, No. (%) | 144 (9.6) | 154 (10.3) | |
| Other or unknown, No. (%) | 38 (2.5) | 45 (3.0) | |
| Apgar score <3 at 5 minutes, No. (%) | 59 (3.9) | 54 (3.6) | 0.66 |
| Extremely low birth weight <1000g, No. (%) | 756 (50.5) | 757 (50.8) | 0.84 |
| OUTCOMES | |||
| Days alive and off the ventilator, mean (S.D.) | 95.9 (35.1) | 93.6 (37.8) | 0.08 |
| Hazard ratio for inpatient death (95% CI)** | 0.78 (0.61 to 0.99) | 1.28 (1.01 to 1.62) | 0.04 |
| Days on ventilator, mean (S.D.) | 12.9 (22.8) | 13.0 (23.3) | 0.91 |
| Days in NICU, mean (S.D.) | 59.6 (33.7) | 58.7 (34.5) | 0.47 |
| Days on antibiotics, mean (S.D.) | 15.7 (19.4) | 15.0 (19.1) | 0.31 |
| Days on ventilator for survivors, mean (S.D.) | 12.2 (22.4) | 12.3 (23.3) | 0.91 |
| SUBGROUP ANALYSIS OF MORTALITY | |||
| Hazard Ratio for inpatient mortality: BW<1000g | 0.74 (0.57 to 0.95) | 1.36 (1.05 to 1.76) | 0.02 |
| Hazard Ratio for inpatient mortality: BW>1000g | 1.11 (0.60 to 2.06) | 0.89 (0.49 to 1.66) | 0.73 |
| Interaction term for ELBW | 0.22 | ||
A single P value is given for the race comparisons.
Each hazard ratio is relative to the other group.
Infants meeting the eligibility criteria for the trial were enrolled at average age 3.8 days. They were followed beginning on the day of enrollment until the date of their discharge from the hospital or until death, up to 120 days after enrollment. An average of 61 days of inpatient data was available for each infant. There were no statistically significant differences in the number of days of follow-up available between patients in the study and control groups.
An example of heart rate characteristics monitoring display
Figure 2 is a screen display of the HRC monitor for a patient before the trial. The top panel is a 5-day plot of the fold-increase in risk of illness in the next 24 hours, with 1-fold representing the average risk. In this infant, between 10/22 and 10/23, there was a rise to 4-fold risk. The bottom panel is 30 minutes of heart rate at the time of rising HeRO score, noted by the yellow line. There are very pronounced abnormal heart rate characteristics of reduced variability and transient decelerations. This is the scenario central to the use of the monitor. The risk of illness had been low - less than 1-fold the average risk of illness in the subsequent 24 hours - and then rose. The suggested reaction was to evaluate the infant. This infant developed mild feeding intolerance near the time of the HRC peak, and a blood culture at that time grew Staph aureus.
Figure 2.
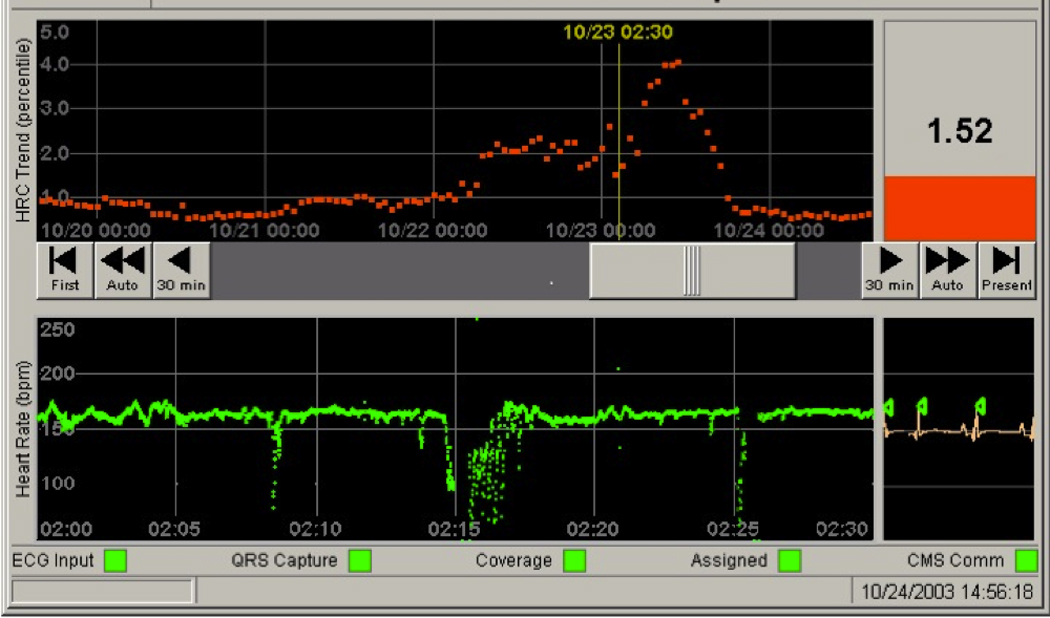
Screen display of the monitor as used in the study.
Primary and secondary outcomes
Infants whose heart rate characteristics were displayed had an average of 2.3 more days alive and off the ventilator (P = 0.083, Table). There were 274 deaths (9.5%) in the 120-day follow-up period, with 152 (10.2%) in the control group and 122 (8.1%) in the study group, an absolute risk reduction of 2.1%. The infants whose heart rate characteristics monitoring results were displayed had a 22% lower relative hazard of inpatient death (HR = 0.78, 95% CI 0.61 to 0.99, P = 0.04). Assuming that our 120-day follow-up was complete for known survivors, the results are the same (HR=0.77, 95% CI 0.61 – 0.99, P = 0.04). No center found higher mortality in the infants whose heart rate characteristics monitoring results were displayed. We found no statistically significant differences between groups in the mean number of days on ventilator for survivors, mean number of days in NICU, or mean number of days on antibiotics (Table). Figure 3, A presents a plot of the survival probability functions for each group of very low birth weight infants over the total period of available follow-up.
Figure 3.


A, Survival of very low birth weight infants as a function of time in the infants whose heart rate characteristics monitoring results were displayed (top) and conventional monitoring-only group (bottom). B, Predictiveness curve of the HRC index as a risk model and classifier for neonatal sepsis. The solid line represents 2M HRC index values normalized by the average risk of 0.62% and plotted from lowest to highest with units of fold-increase in risk. The open circles are the proportion of infants per decile with proven sepsis in the next 24 hours.
Subgroup analysis: ELBW infants
We assessed whether the effect of HRC monitoring on in-hospital mortality differed between ELBW infants and infants with birth weight 1000–1500g. This subgroup analysis was justified by the stratification categories defined in the study design. The statistical significance for a difference was assessed in the proportional hazards regression model by including an interaction term between group assignment and ELBW status. The table summarizes the subgroup analysis results. In the stratified analysis, the 1513 ELBW infants whose heart rate characteristics monitoring results were displayed had a 26% lower relative hazard of death (HR = 0.74, 95% CI 0.57 to 0.95, P = 0.02). A test for interaction showed no statistically significant difference in the effect of HRC monitoring on survival of ELBW infants compared to those with birth weights over 1000g (P=0.22). We attribute this finding to the disproportionately large number of deaths in the ELBW group. The 233 deaths among the ELBW infants represented 85% of deaths among study participants. Among ELBW infants, 17.6% (133 of 757) in the control group died as compared to 13.2% (100 of 756) in the HRC monitored group, an absolute risk reduction of 4.4%. No other subgroup analysis was conducted.
Is the mortality benefit of heart rate characteristics monitoring related to sepsis?
Heart rate characteristics monitoring is predicated on the idea that neonatal sepsis is preceded by subclinical reduced variability and transient decelerations of heart rate. Thus we explored the idea that the mortality benefit in this trial was due to early diagnosis of neonatal sepsis. We plotted the observed risk of culture-proven sepsis in the next 24 hours as a function of the risk that was predicted by the heart rate characteristics index. Figure 3, B shows the resulting predictiveness curve (16, 17), which shows the distribution of observed risk of sepsis in the next 24 hours binned in deciles (open circles) and the heart rate characteristics index (line) plotted from lowest to highest. This display combines features of both risk assessment and diagnostic classification across the entire range of possible results, improving on standard concepts of sensitivity and specificity. We found good agreement of the observed and expected risks, affirming the validity of the HRC index as a risk measure for imminent sepsis.
The incidence of proven sepsis was not different in the infants whose heart rate characteristics monitoring results were displayed (358/1500 compared to 379/1489, P=0.34). To test the possibility that altered detection or management of sepsis contributed to the mortality benefit, we compared the effect of heart rate characteristics monitoring on outcomes of infants who had at least one sepsis episode. We found that the mortality rate in the 30 days following the first episode of proven sepsis was 10.0% in the infants whose heart rate characteristics monitoring results were displayed compared with 16.1% in the control infants, an absolute risk reduction of 6.1% (36/358 vs. 61/379, P=0.01).
We also tested the possibility that heart rate characteristics monitoring led to more sepsis work-ups and courses of antibiotics. Infants whose heart rate characteristics monitoring results were displayed had 10% more blood cultures drawn for the suspicion of sepsis (1.8 per month compared with 1.6, P=0.05) and 5% more days on antibiotics (15.7 compared with 15.0, P=0.31, Table).
Discussion
In this large, simple randomized trial (18), we tested the hypothesis that heart rate characteristics monitoring, which detects the abnormal reduced variability and transient decelerations that often precede late-onset neonatal sepsis, can improve outcomes in VLBW infants. The 2.3 day increase of the composite primary outcome measure of days alive and not on a ventilator in the infants whose heart rate characteristics monitoring results were displayed was not statistically significant (P=0.08). We found, however, a clinically significant 22% relative reduction in mortality in infants whose heart rate characteristics monitoring results were displayed (P=0.04), from 10.2% to 8.1%. There were no significant differences in the number of days in NICU or days on antibiotics.
The patient population in this trial was very similar to that reported in 2002 by Stoll and coworkers from the NICHD Neonatal Research Network report on late-onset neonatal sepsis. Importantly, our trial produced very similar rates of mortality (9.2% in this study vs 9.6% in the earlier one), rate of sepsis (25% vs 21%), overall mortality in infants with sepsis (19.3% vs 18.4%), mortality in infants without sepsis (6.6% vs 7.2%), days on ventilator (13 vs 14), and days in the NICU (59 vs 65) (1).
Previously, we reported that reduced variability and transient decelerations occur early in the course of neonatal sepsis (3); developed time-series measures optimized to detect these abnormal heart rate characteristics (9–11, 19–22); developed a multivariable logistic regression model at the University of Virginia and validated it externally at Wake Forest University (7) and showed that the resulting heart rate characteristics index added information to lab tests and clinical signs (17, 23, 24). Concerns remained, though, regarding widespread use of heart rate characteristics monitoring in hospitalized infants. Because the monitoring might lead to earlier diagnosis and therapy of sepsis, it might also lead to unnecessary sepsis evaluations, excessive blood cultures or antibiotic use. To address these concerns, we randomized infants to real-world use of heart rate characteristics monitoring. Rather than specify protocols for numerical interpretation, or for diagnostic testing or therapy, we educated the study personnel and NICU staff in the development, meaning and interpretation of the heart rate characteristics index, and the fact that a rising score might indicate sepsis. Clinicians were then free to respond independently to an abnormal heart rate characteristics index value. The index is presented as fold-increase in risk, allowing natural and intuitive interpretation, rather than as a value with more arbitrary units requiring thresholds and guidelines for its use.
The strengths of this study include its large sample size, patient similarities to other large studies of very low birth weight infants (1), simple design, and clinical relevance. A debatable weakness is the lack of a mandated intervention if the heart rate characteristics index rose, or a specified definition of what constituted a significant rise. The study design, though, recapitulates the intended real-world use of HRC monitoring as an additional piece of data to be used in the context of the individual infant with complex illness and high, changing risks.
The mechanism by which display of HRC monitoring results reduced mortality was not studied. One possible explanation is that sepsis was suspected and treated earlier. To address this possibility accurately requires knowing the time of sepsis initiation in a premature infant. Because this is unknowable, we cannot measure time-to-diagnosis and directly test this important hypothesis. We found, however, indirect evidence of a role for improved diagnosis and treatment of sepsis in that the group of infants whose heart rate characteristics monitoring results were displayed had more than 30% fewer deaths in the 30 days after first diagnosis of proven sepsis (P=0.01), at the cost of a 10% increase in blood cultures (P=0.05) and 5% in antibiotic days (P=0.31). Alternative mechanisms include the use of HRC monitoring as an index of systemic inflammation, allowing the possibility of early diagnosis and intervention of not only sepsis but of other infections or of common noninfectious problems such as necrotizing enterocolitis.
The mechanism by which reduced variability and transient decelerations of the heart rate occur in neonatal illness is not known. A current concept is that the most severe and life-threatening aspects of sepsis are due not to the infecting organisms but rather to an exaggerated and dysregulated immune response, the so-called systemic inflammatory response syndrome proposed originally by Bone and coworkers (25). This has been an extremely useful framework for understanding why antibiotics are not always curative unless given very early in the course of illness, and underscoring the need for improved early detection of infection. An even more current concept is that of the cholinergic anti-inflammatory pathway proposed by Tracey and coworkers (4), a strikingly original framework for understanding how the body attempts to limit the pro- and anti-inflammatory responses to infection. Because the heart rate and its variability are exquisitely controlled by cholinergic activity of the vagal nerve, this point of view predicts that heart rate variability will be altered early in the course of severe infection. A complementary and even more general point of view has been put forward by Buchman et al and (26–28) Goldberger et al (29, 30). Their view is of the body as a complex system in the sense of non-linear dynamics and chaos theory, and that physiological rhythms simplify during illness. This justifies our approach, especially the use of entropy measures (10).
In summary, VLBW infants in this randomized trial who had heart rate characteristics monitoring results displayed had lower in-hospital mortality than VLBW infants who did not have these results displayed, 8.1% compared to 10.2%. In ELBW infants, mortality was similarly lower in the monitored group, 13.2% versus 17.6%. One life was saved for every 48 VLBW and for every 23 ELBW infants monitored.
Acknowledgments
Acknowledgments available at www.jpeds.com.
Supported by NIH (grant R01-HD48562 to J.M.) and by Medical Predictive Science Corporation, Charlottesville, VA, which provided study hardware and software for heart rate characteristics monitoring and for study data collection and management. Neither of these funding sources had any role in the design of the study, in the analysis and interpretation of the data, in the decision to submit the manuscript, or in the preparation, review, or approval of it. J.M. and D.L. have consulting agreements and equity shares in Medical Predictive Science Corporation, Charlottesville, VA.
Footnotes
Publisher's Disclaimer: This is a PDF file of an unedited manuscript that has been accepted for publication. As a service to our customers we are providing this early version of the manuscript. The manuscript will undergo copyediting, typesetting, and review of the resulting proof before it is published in its final citable form. Please note that during the production process errors may be discovered which could affect the content, and all legal disclaimers that apply to the journal pertain.
The other authors declare no conflicts of interest.
References
- 1.Stoll BJ, Hansen N, Fanaroff AA, Wright LL, Carlo WA, Ehrenkranz RA, et al. Late-onset sepsis in very low birth weight neonates: the experience of the NICHD Neonatal Research Network. Pediatrics. 2002;110:285–291. doi: 10.1542/peds.110.2.285. [DOI] [PubMed] [Google Scholar]
- 2.Fanaroff AA, Korones SB, Wright LL, Verter J, Poland RL, Bauer CR, et al. Incidence, presenting features, risk factors and significance of late onset septicemia in very low birth weight infants. The National Institute of Child Health and Human Development Neonatal Research Network. Pediatr.Infect.Dis.J. 1998;17:593–598. doi: 10.1097/00006454-199807000-00004. [DOI] [PubMed] [Google Scholar]
- 3.Griffin MP, Moorman JR. Toward the early diagnosis of neonatal sepsis and sepsis-like illness using novel heart rate analysis. Pediatrics. 2001;107:97–104. doi: 10.1542/peds.107.1.97. [DOI] [PubMed] [Google Scholar]
- 4.Tracey KJ. Reflex control of immunity. Nat Rev Immunol. 2009;9:418–428. doi: 10.1038/nri2566. [DOI] [PMC free article] [PubMed] [Google Scholar]
- 5.Fairchild KD, Saucerman JJ, Raynor LL, Sivak JA, Xiao Y, Lake DE, et al. Endotoxin depresses heart rate variability in mice: cytokine and steroid effects. American Journal of Physiology. 2009;297:R1019–R1027. doi: 10.1152/ajpregu.00132.2009. [DOI] [PMC free article] [PubMed] [Google Scholar]
- 6.Fairchild KD, Srinivasan V, Moorman JR, Gaykema R, Goehler L. Pathogen-induced heart rate changes associated with cholinergic nervous system activation. American Journal of Physiology. 2011;330:R330–R339. doi: 10.1152/ajpregu.00487.2010. [DOI] [PMC free article] [PubMed] [Google Scholar]
- 7.Griffin MP, O'Shea TM, Bissonette EA, Harrell FE, Jr., Lake DE, Moorman JR. Abnormal heart rate characteristics preceding neonatal sepsis and sepsis-like illness. Pediatr Res. 2003;53:920–926. doi: 10.1203/01.PDR.0000064904.05313.D2. [DOI] [PubMed] [Google Scholar]
- 8.Griffin MP, O'Shea TM, Bissonette EA, Harrell FE, Jr., Lake DE, Moorman JR. Abnormal heart rate characteristics are associated with neonatal mortality. Pediatr Res. 2004;55:782–788. doi: 10.1203/01.PDR.0000119366.21770.9E. [DOI] [PubMed] [Google Scholar]
- 9.Kovatchev BP, Farhy LS, Cao H, Griffin MP, Lake DE, Moorman JR. Sample asymmetry analysis of heart rate characteristics with application to neonatal sepsis and systemic inflammatory response syndrome. Pediatr Res. 2003;54:892–898. doi: 10.1203/01.PDR.0000088074.97781.4F. [DOI] [PubMed] [Google Scholar]
- 10.Lake DE, Richman JS, Griffin MP, Moorman JR. Sample entropy analysis of neonatal heart rate variability. American Journal of Physiology. 2002;283:R789–R797. doi: 10.1152/ajpregu.00069.2002. [DOI] [PubMed] [Google Scholar]
- 11.Richman JS, Lake DE, Moorman JR. Sample entropy. Methods Enzymol. 2004;384:172–184. doi: 10.1016/S0076-6879(04)84011-4. [DOI] [PubMed] [Google Scholar]
- 12.Richman JS, Moorman JR. Physiological time series analysis using approximate entropy and sample entropy. American Journal of Physiology. 2000;278:H2039–H2049. doi: 10.1152/ajpheart.2000.278.6.H2039. [DOI] [PubMed] [Google Scholar]
- 13.Marshall JC, Vincent JL, Guyatt G, Angus DC, Abraham E, Bernard G, et al. Outcome measures for clinical research in sepsis: a report of the 2nd Cambridge Colloquium of the International Sepsis Forum. Crit Care Med. 2005;33:1708–1716. doi: 10.1097/01.ccm.0000174478.70338.03. [DOI] [PubMed] [Google Scholar]
- 14.Schoenfeld DA, Bernard GR. Statistical evaluation of ventilator-free days as an efficacy measure in clinical trials of treatments for acute respiratory distress syndrome. Critical Care Medicine. 2002;30:1772–1777. doi: 10.1097/00003246-200208000-00016. [DOI] [PubMed] [Google Scholar]
- 15.FDA. Guidance for Industry - Computerized Systems Used in Clinical Trials. 1999 In.
- 16.Pepe MS, Feng Z, Huang Y, Longton G, Prentice R, Thompson IM, et al. Integrating the predictiveness of a marker with its performance as a classifier. Am J Epidemiol. 2008;167:362–368. doi: 10.1093/aje/kwm305. [DOI] [PMC free article] [PubMed] [Google Scholar]
- 17.Griffin MP, Lake DE, Bissonette EA, Harrell FE, Jr., O'Shea TM, Moorman JR. Heart rate characteristics: novel physiomarkers to predict neonatal infection and death. Pediatrics. 2005;116:1070–1074. doi: 10.1542/peds.2004-2461. [DOI] [PubMed] [Google Scholar]
- 18.Yusuf S, Collins R, Peto R. Why do we need some large, simple randomized trials? Stat Med. 1984;3:409–422. doi: 10.1002/sim.4780030421. [DOI] [PubMed] [Google Scholar]
- 19.Cao H, Lake DE, Griffin MP, Moorman JR. Increased nonstationarity of neonatal heart rate before the clinical diagnosis of sepsis. Ann Biomed Eng. 2004;32:233–244. doi: 10.1023/b:abme.0000012743.81754.0b. [DOI] [PubMed] [Google Scholar]
- 20.Griffin MP, Scollan DF, Moorman JR. The dynamic range of neonatal heart rate variability. J Cardiovasc Electrophysiol. 1994;5:112–124. doi: 10.1111/j.1540-8167.1994.tb01151.x. [DOI] [PubMed] [Google Scholar]
- 21.Chang KL, Monahan KJ, Griffin MP, Lake D, Moorman JR. Comparison and clinical application of frequency domain methods in analysis of neonatal heart rate time series. Ann Biomed Eng. 2001;29:764–774. doi: 10.1114/1.1397791. [DOI] [PubMed] [Google Scholar]
- 22.Nelson JC, Rizwan u, Griffin MP, Moorman JR. Probing the order within neonatal heart rate variability. Pediatr Res. 1998;43:823–831. doi: 10.1203/00006450-199806000-00017. [DOI] [PubMed] [Google Scholar]
- 23.Griffin MP, Lake DE, Moorman JR. Heart rate characteristics and laboratory tests in neonatal sepsis. Pediatrics. 2005;115:937–941. doi: 10.1542/peds.2004-1393. [DOI] [PubMed] [Google Scholar]
- 24.Griffin MP, Lake DE, O'Shea TM, Moorman JR. Heart rate characteristics and clinical signs in neonatal sepsis. Pediatr Res. 2007;61:222–227. doi: 10.1203/01.pdr.0000252438.65759.af. [DOI] [PubMed] [Google Scholar]
- 25.Bone RC. Toward a theory regarding the pathogenesis of the systemic inflammatory response syndrome: what we do and do not know about cytokine regulation. Critical Care Medicine. 1996;24:163–172. doi: 10.1097/00003246-199601000-00026. [DOI] [PubMed] [Google Scholar]
- 26.Buchman TG. Nonlinear dynamics, complex systems, and the pathobiology of critical illness. Curr.Opin.Crit Care. 2004;10:378–382. doi: 10.1097/01.ccx.0000139369.65817.b6. [DOI] [PubMed] [Google Scholar]
- 27.Buchman TG, Stein PK, Goldstein B. Heart rate variability in critical illness and critical care. Curr.Opin.Crit Care. 2002;8:311–315. doi: 10.1097/00075198-200208000-00007. [DOI] [PubMed] [Google Scholar]
- 28.Godin PJ, Buchman TG. Uncoupling of biological oscillators: a complementary hypothesis concerning the pathogenesis of multiple organ dysfunction syndrome. Crit Care Med. 1996;24:1107–1116. doi: 10.1097/00003246-199607000-00008. [DOI] [PubMed] [Google Scholar]
- 29.Goldberger AL, Amaral LAN, Hausdorff JM, Ivanov PC, Peng CK, Stanley HE. Fractal dynamics in physiology: alterations with disease and aging. Proceedings of the National Academy of Sciences of the United States of America. 2002;99:2466–2472. doi: 10.1073/pnas.012579499. [DOI] [PMC free article] [PubMed] [Google Scholar]
- 30.Goldberger AL, West BJ, Degn H, Holden AV, Olsen LF. Chaos in biological systems. New York: Plenum Press; 1987. Chaos in physiology: health or disease? pp. 1–4. [Google Scholar]