

Abstract
Chromosomes contain DNA covered with proteins performing functions such as architectural organization and transcriptional regulation. The ability to count the number of proteins bound to various regions of the genome is essential for understanding both architectural and regulatory functions. We present a straightforward method of counting gfp-conjugated proteins bound to an individual duplex DNA molecule by calibrating to a commercially available fluorescence standard using wide-field fluorescence microscopy. We demonstrate our method using the E. coli nucleoid-associated protein Fis.
Keywords: DNA, fluorescence, protein counting, single molecule
INTRODUCTION
Given the vital roles proteins play in the genomes of all organisms, the ability to count the number of proteins bound to DNA is of significant import. Much work has been done counting and identifying cellular proteins in bulk using mass spectrometry [1,2], but this method does not allow localization of proteins. Fluorescence microscopy has been used to visually quantify [3], measure the mobility of [4] and better determine the locations of [5] proteins in E. coli. Fluorescence microscopy has also been used to visualize binding of proteins to the E. coli nucleoid [6] and to monitor the assembly dynamics of protein-DNA complexes [7]. Quantification of protein number has been attempted using the fluorescence of the molecule one wishes to quantify as the standard [3]. To date, however, no data has been presented in which single particle fluorescence is calibrated using a known external fluorescence standard, nor has any data been presented quantifying protein bound to a single DNA molecule. Here we present a method using an external standard to estimate the number of proteins bound in chromosome-like complexes along a single DNA molecule. We compare our method with equilibrium mechanical measurements of change in protein number as a function of force applied to the tether [12], demonstrating consistency between the two methods. Such measurements are of importance for understanding critical processes, such as gene regulation and chromosomal organization, via quantification of large protein-DNA complexes.
MATERIALS AND METHODS
The instrumentation and experimental setup were described previously [10]. Briefly, a sample cell is constructed from borosilicate glass capillary tubing (VitroCom, Mountain Lakes, NJ). The sample cell surfaces were passivated using 5 mg/mL casein (Sigma, St. Louis, MO) and 0.5 mg/mL casein was included in the buffer except in the case of single bead measurements. For DNA tethering experiments the surfaces were first treated with antidigoxygenin (Roche Diagnostics, Indianapolis, IN). All buffers were 20 mM HEPES, 100 mM potassium glutamate, 0.5 mM EDTA and 10 mM DTT. Samples were placed on a custom-built combined magnetic tweezers/fluorescence microscope and data collected as described previously [10].
RESULTS AND DISCUSSION
A fluorescence calibration was performed using a small fluorescent bead standard (PS Speck beads from Molecular Probes) [9]. This calibration was a two-step process, measuring bulk bead fluorescence and measuring single bead fluorescence. First, measurements of bulk solutions of beads with excitation/emission wavelengths of 505 nm/515 nm (505/515 beads) were made as a function of concentration. A series of 30 images was acquired over 15 minutes for each of a set of concentrations: 1.0 pM, 1.25 pM, 1.5 pM and 2.0 pM. A region of interest (ROI) was selected to be centered on the fluorescence excitation region and to avoid the edge pixels (Fig. 1, Inset A). The same ROI was applied to all images at each concentration for both the bulk bead and bulk protein measurements (discussed below). Background fluorescence for the bulk bead measurements was determined by imaging a flow cell under fluorescence illumination prior to adding beads. The total fluorescence within the ROI, after background subtraction, was measured for each image and averaged over all images for each concentration, and the results plotted as total fluorescence versus concentration. A linear fit to that data provided a bulk calibration standard (fluorescence per bead concentration) of (6.0 ± 0.4) × 1020 counts M−1 (Fig. 1).
Figure 1.

Plot of intensity versus concentration for the PS Speck bead standard. The beads used had excitation/emission wavelengths of 505 nm/515 nm. Insets: A. ROI image of bulk beads. B. ROI image of a single bead. Both images have had background subtracted. Errors in data and fit are one standard deviation.
To measure the total fluorescence of a single bead, 505/515 beads at a concentration of 0.6 pM were allowed to adsorb to the surface of a flow cell. The sample was then washed extensively with buffer and images of adsorbed beads were acquired. An ROI was chosen to encompass the fluorescence of a single bead that could be isolated from surrounding beads (Fig. 1, Inset B). This process was performed for a few images of different beads and resulted in a value of (1.3 ± 0.3) × 107 counts/bead.
The bulk and single-bead fluorescence values provide a standard ratio of bulk fluorescence to single particle (bead) fluorescence necessary to convert bulk protein fluorescence to the number of proteins bound to DNA. The ratio of per molar bulk fluorescence to single particle fluorescence is constant for a given fluorophore. Consequently, the fluorescent bead standard described above can be used for any protein one wishes to count, and for many different experiments as long as no changes are made to the instrument, since the error between measurements is small.
In order to count proteins bound to DNA, a bulk measurement of a fluorescence conjugate of the protein of interest was made. For our example, we used gfp-conjugated Fis (gfpFis). Several bulk measurements of gfpFis were made at 10 nM, 20 nM, 40 nM and 60 nM (Fig. 2), and the results fit to a line as for the bulk bead measurements. The linear fit resulted in a fluorescence-per-protein concentration value of (2 ± 0.09) × 1016 counts M−1. The ratio of the fluorescence intensity of a single fluorophore to a bulk solution of that fluorophore should be constant for all fluorescent molecules on any given instrument with fixed illumination intensity and camera exposure time:
| (1) |
Figure 2.

Plot of intensity versus concentration for four concentrations of gfpFis imaged in bulk solution. Errors in data and fit are one standard deviation. Inset: example image of bulk gfpFis
From this relation we can calculate the fluorescence of a single gfp molecule. Using gfpFis we obtain a value of 433 counts/gfpFis dimer. This value can now be used to determine the number of proteins bound to a single DNA molecule after a fluorescence measurement of bound protein is obtained.
To measure the fluorescence from gfpFis bound to DNA, we used a magnetic tweezers in which the DNA is stretched at constant force in the focal plane of an epifluorescence microscope [10]. Tethers were prepared and incubated with gfpFis as previously described [10]. After a buffer wash, tethers were identified and images were acquired (Fig. 3A). After background subtraction, an ROI was selected on the right-hand side of the tether to avoid residual fluorescence from the bead (Fig 3B). A region away from the gfp fluorescence, the same width as and just to the right of the tether, was chosen as the representative background. In the same manner as for the single bead standard, the average of the pixel values in the background region was calculated and subtracted from the entire image. The total fluorescence of the final ROI (Fig. 3C) was then determined for several tethers.
Figure 3.
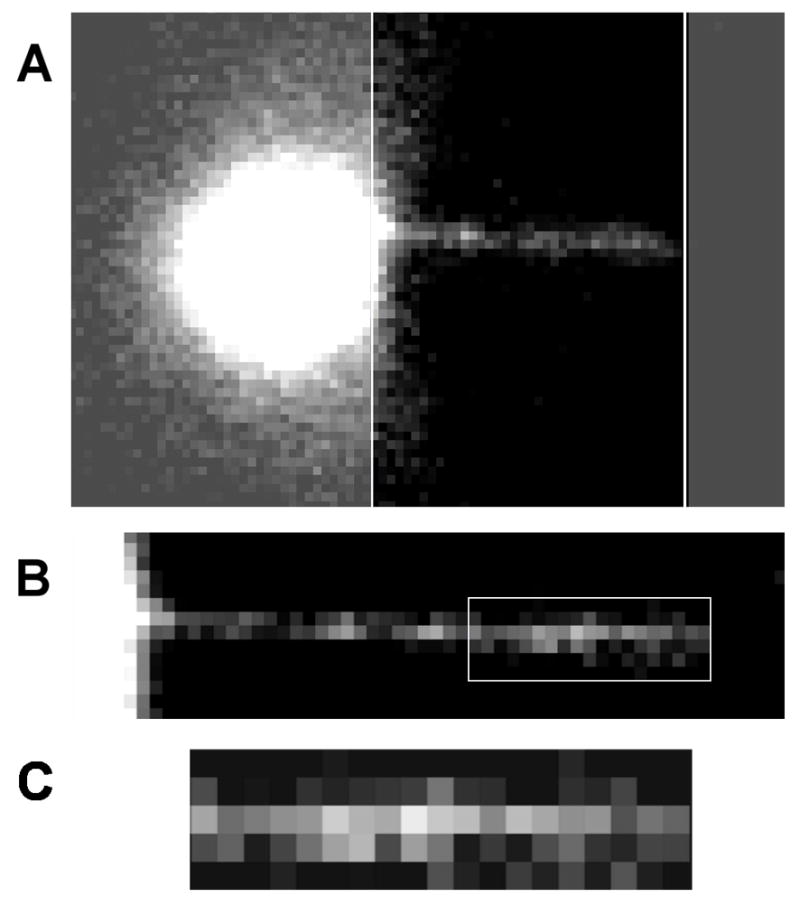
A. A λ-DNA tether with gfpFis bound prior to background subtraction. The dark region between the white lines emphasizes the tether length. B. The same tether after background subtraction. The ROI used for measurement is indicated by the white square. C. Enlargement of the ROI from (B).
Using the total fluorescence of the DNA-bound protein and the value obtained from equation 1, we can calculate the number of proteins bound to the DNA within the ROI as:
| (2) |
The resulting value is the total number of dimers bound in the ROI. For this value to have any useful meaning, the length of each tether is needed. That measurement is straightforward using the image of DNA-bound gfpFis (Fig. 3A). The white lines in Fig. 3A mark the ends of the tether which, in this case, is 11 μm long (38 pixels long at 283 nm per pixel), resulting in 5 kbases/μm for λ-DNA. For our example, s 5 μm (19 pixels) which is 25 kbases. Measurements of several tethers at two different gfpFis concentrations and 100 mM salt resulted in reasonable values of 159 ± 53 bp and 93 ± 9 bp per Fis dimer for 10 nM and 200 nM gfpFis, respectively (Table 1). These values represent an average along the length of the ROI chosen on the right side of the DNA, as illustrated in figure 3. In brief, the fluorescence in each column of pixels was summed and those totals were then averaged along the length of the ROI. That average fluorescence and the number of bps per pixel were used to determine the number of bps per gfpFis dimer. This process was repeated several times for each concentration. As evidenced by the error, the 200 nM values were more reproducible than the 10 nM values, likely due to loss of protein to the sides of the containers used and the flow cell.
TABLE 1.
Concentration of gfpFis in the binding reaction and the corresponding number of bp per gfpFis dimer indicating difference between amount measured here and biochemical data.
| gfpFis concentration (nM) | bp per gfpFis dimer |
|---|---|
|
| |
| 10 | 159 ± 53 |
| 200 | 93 ± 9 |
In the current measurements, a force of 0.7 pN is applied to the DNA molecule and protein is removed from the solution prior to imaging. For those reasons, we expect our measurements to give a significantly lower protein density than biochemical measurements suggest. Indeed, it has recently been demonstrated that force drives proteins from DNA tethers [12]. That work was done using a 6 kb plasmid and showed the change in number of proteins bound as a function of force under equilibrium conditions with protein still in solution. The new data presented here were acquired under non-equilibrium conditions in the absence of solution-phase protein and were normalized to 6 kb. Similar to the equilibrium data, we observe a decrease in protein number as greater force is applied (Fig. 4). However, the change in protein binding density with increased force is greater within an otherwise protein-free environment than observed under equilibrium conditions.
Figure 4.

Plot of change in protein number versus normalized force for equilibrium (diamonds) [12] and non-equilibrium (squares) conditions. The change in protein number was also normalized to be zero for the first data point in this illustration and the DNA length for the non-equilibrium data was normalized to 6 kb.
We have demonstrated a straightforward, accessible method of reliably estimating the number of proteins bound to duplex DNA using wide-field fluorescence microscopy. This technique can also be applied to DNA in vivo and, for example, is useful for assessing protein binding density (such as for transcription factors, of which Fis is an example) in gene-regulatory regions. Such measurements are also invaluable for assessing sequence dependence of binding in those, and other regions. Work on those topics is in progress. Our technique does not require complex, expensive equipment such as is required for TIRFM [3]. Hence, our reported technique is accessible to a broad spectrum of researchers interested in quickly quantifying proteins or other macromolecules both in vitro and in vivo, and is not limited to proteins bound to DNA. The technique is also applicable to counting proteins, or other fluorescent particles, in cells or any region in which the illumination intensity can be kept constant throughout.
HIGHLIGHTS.
Wide-field fluorescence calibration of fluorescence bead standard and bulk gfpFis.
Number of proteins bound to a single DNA molecule is determined using calibration.
Change in number of proteins bound as a function of force is measured.
Acknowledgments
Work at NU was supported by NSF Grants DMR-0715099, MCB-1022117, and by NIH Grant 1U54CA143869-01 [NU-PS-OC]. Work at UCLA was supported by NIH Grant GM038509. The authors thank Dr. Botao Xiao for generously providing the equilibrium data for figure 4.
Footnotes
Publisher's Disclaimer: This is a PDF file of an unedited manuscript that has been accepted for publication. As a service to our customers we are providing this early version of the manuscript. The manuscript will undergo copyediting, typesetting, and review of the resulting proof before it is published in its final citable form. Please note that during the production process errors may be discovered which could affect the content, and all legal disclaimers that apply to the journal pertain.
Contributor Information
John S. Graham, Email: john-graham@northwestern.edu.
John F. Marko, Email: john-marko@northwestern.edu.
References
- 1.Aebersold R, Goodlett DR. Mass spectrometry in proteomics. Chemical Reviews. 2001;101:269–296. doi: 10.1021/cr990076h. [DOI] [PubMed] [Google Scholar]
- 2.Kirkpatrick DS, Gerber SA, Gygi SP. The absolute quantification strategy: a general procedure for the quantification of proteins and post-translational modifications. Methods. 2005;35:265–273. doi: 10.1016/j.ymeth.2004.08.018. [DOI] [PubMed] [Google Scholar]
- 3.Taniguchi Y, Choi PJ, Li GW, Chen H, Babu M, Hearn J, Emili A, Xie XS. Quantifying E. coli proteome and transcriptome with single-molecule sensitivity in single cells. Science. 2010;329:533–538. doi: 10.1126/science.1188308. [DOI] [PMC free article] [PubMed] [Google Scholar]
- 4.Kumar M, Mommer MS, Sourjik V. Mobility of cytoplasmic, membrane, and DNA-binding proteins in Escherichia coli. Biophys J. 2010;98:552–559. doi: 10.1016/j.bpj.2009.11.002. [DOI] [PMC free article] [PubMed] [Google Scholar]
- 5.Cabrera JE, Jin DJ. The distribution of RNA polymerase in Escherichia coli is dynamic and sensitive to environmental cues. Molecular Microbiology. 2003;50:1493–1505. doi: 10.1046/j.1365-2958.2003.03805.x. [DOI] [PubMed] [Google Scholar]
- 6.Wery M, Woldringh CL, Rouviere-Yaniv J. HU-GFP and DAPI co-localize on the Escherichia coli nucleoid. Biochimie. 2001;83:193–200. doi: 10.1016/s0300-9084(01)01254-8. [DOI] [PubMed] [Google Scholar]
- 7.Hilario J, Amitani I, Baskin RJ, Kowalczykowski SC. Direct imaging of human Rad51 nucleoprotein dynamics on individual DNA molecules. Proc Natl Acad Sci U S A. 2009;106:361–368. doi: 10.1073/pnas.0811965106. [DOI] [PMC free article] [PubMed] [Google Scholar]
- 8.Femino AM, Fay FS, Fogarty K, Singer RH. Visualization of single RNA transcripts in situ. Science. 1998;280:585–590. doi: 10.1126/science.280.5363.585. [DOI] [PubMed] [Google Scholar]
- 9.Zucker RM. Quality assessment of confocal microscopy slide based systems: performance. Cytometry A. 2006;69:659–676. doi: 10.1002/cyto.a.20314. [DOI] [PubMed] [Google Scholar]
- 10.Graham JS, Johnson RC, Marko JF. Concentration-dependent exchange accelerates protein dissociation from double-stranded DNA. Nucleic Acids Research. 2011;39:2249–2259. doi: 10.1093/nar/gkq1140. [DOI] [PMC free article] [PubMed] [Google Scholar]
- 11.Skoko D, Yoo D, Bai H, Schnurr B, Yan J, McLeod SM, Marko JF, Johnson RC. Mechanism of chromosome compaction and looping by the Escherichia coli nuceloid protein Fis. Journal of Molecular Biology. 2006;364:777–798. doi: 10.1016/j.jmb.2006.09.043. [DOI] [PMC free article] [PubMed] [Google Scholar]
- 12.Xiao B, Zhang H, Johnson RC, Marko JF. Force-driven unbinding of proteins HU and Fis from DNA quantified using a thermodynamic Maxwell relation. Nucleic Acids Research. 2011;39:5568–5577. doi: 10.1093/nar/gkr141. [DOI] [PMC free article] [PubMed] [Google Scholar]