Abstract
Cholesteryl esters (CE) are important lipid storage molecules. The present study demonstrates that sodiated adducts of CE molecular species form positive ions that can be detected in both survey scan mode as well as by exploiting class-specific fragmentation in MS/MS scan modes. A common neutral loss for CEs is the loss of cholestane (NL 368.5), which can be used to specifically quantify tissue CE molecular species. Using this MS/MS technique CE molecular species were quantified in mouse monocyte-derived macrophages (J774 cells) incubated with either linoleic (18:2) or arachidonic acid (20:4). These studies revealed that arachidonic acid was not only incorporated into the CE pool, but also was elongated resulting in the accumulation of 22:4 and 24:4 CE molecular species in macrophages. Additionally, this technique was used to quantify CE molecular species present in crude lipid extracts from plasma of female mice fed a Western diet, which led to an enrichment in CE molecular species containing monounsaturated fatty acids compared to female mice fed a normal chow diet. Last, NL 368.5 spectra revealed the oxidation of the aliphatic fatty acid residues of CE molecular species containing polyunsaturated fatty acids. Taken together, these studies demonstrate the utility of using sodiated adducts of CE in conjunction with direct infusion electrospray ionization tandem mass spectrometry to rapidly quantify CE molecular species in biological samples.
Keywords: Cholesteryl esters, Sodiated adducts, Lipid oxidation, Macrophages, Arachidonic Acid, Tandem mass spectrometry
Introduction
Cholesteryl esters (CE) are of great importance in lipid storage and the regulation of their levels is extremely critical as they are linked to several human diseases [1,2]. The regulation of cellular and plasma free cholesterol and esterified cholesterol (e.g., CE) is also extremely critical in cardiovascular health [1,3]. Cholesterol and CE biosynthesis is regulated by intracellular cholesterol levels at the transcriptional level [4]. Acyl CoA acyl transferase and lecithin cholesterol acyl transferase mediate the synthesis of CE within cells and in high-density lipoprotein, respectively [5,6]. Based on the importance of plasma levels of free and esterified cholesterol, it is likely that plasma levels of specific molecular species of CE may have utility as predictors of atherosclerosis, diabetes mellitus, coronary heart disease and cancer [7–9]. It should also be noted that within cells the appearance of CE-enriched lipid droplets is a consequence of impaired metabolism or over-nutrition [9,10]. Furthermore, elevated tissue CE levels are observed in tumors [11].
Mass spectrometry potentially affords rapid high-throughput chemical analysis to interrogate the role of lipids in cellular, tissue and systemic physiological and pathophysiological processes [12,13]. However, mass spectrometry (MS) of CE is complicated by the presence of other lipids having common isobaric molecular ions (e.g., diacylglycerols), which hinders both the identity and quantification of individual CE by single stage mass spectrometry. Soft ionization techniques have been used in the past for CE analyses, specifically the use of matrix-assisted laser desorption/ionization [14] and electrospray ionization (ESI) [15–17]. It is recognized that ESI can provide efficient quantification of lipid species in complex matrices without the need for derivatization. Although, ammoniated adducts of CE have been used for detection of molecular species using ESI-MS, this adduct produces only moderate levels of MS/MS fragmentation [18,19]. In this study, ESI-MS/MS strategies were developed and optimized for the species-selective analysis of multiple CE molecular species using sodiated adducts. In comparison to ammoniated adducts of CE, sodiated adducts of CE fragment resulting in the loss of cholestane as a neutral fragment. Based on this fragmentation, neutral loss scanning was developed to quantify sodiated adducts of CE molecular species. This technique was subsequently applied to examine CE molecular species in mouse macrophages supplemented with either linoleic acid or arachidonic acid, as well as in the plasma of mice fed specific diets.
Materials and methods
Standards and solvents
Fatty acids and CE molecular species standards, including myristate (14:0), palmitate (16:0), palmitoleate (16:1), heptadecanoate (17:0), stearate (18:0), oleate (18:1), linoleate (18:2), arachidonate (20:4), and docosahexaenoate (22:6) were purchased from NuChek Prep (Elysian, MN). Distearin (18:0-18:0 or 36:0) and diarachidin (20:0-20:0 or 40:0) were also purchased from NuChek Prep (Elysian, MN). Chloroform and methanol were of HPLC grade and were purchased from Burdick and Jackson (Muskegon, MI).
Electrospray ionization-mass spectrometric analysis
Direct-infusion electrospray ionization mass spectrometry of CE was performed in positive ion mode using a Thermo Fisher TSQ Quantum Ultra with Xcalibur data acquisition software. Samples were analyzed at a flow rate of 3 µL/min. Tune parameters were optimized for CE analyses, and were set at spray voltage = 3800 V, sheath gas = 8 (arbitrary units), ion sweep gas pressure = 0.5 (arbitrary units), auxiliary gas pressure = 5 (arbitrary units), and capillary temperature = 270 °C. Spectra for survey scans were acquired for five min with a scan rate of 0.5 scans/sec. In each MS/MS mode, the collisional energy for the analyses of CE molecular species was set at 25 eV. Spectra for MS/MS scan modes were acquired over 3 min with a scan rate of 0.5 scans/sec.
Fatty acid supplementation of J774 cells
Mouse J774 monocyte-derived macrophages were maintained at 37°C with 5% CO2 in RPMI-1640 (Sigma) supplemented with 10% v/v fetal bovine serum (Atlanta Biologicals) and 1X antibiotic/antimycotic (Sigma). For the fatty acid supplementation, either 50 µM linoleic or arachidonic acid were suspended in media as an ethanol injectate (ethanol < 0.1% v/v), and cells were treated with these fatty acids for 24 h followed by a second supplementation with the same concentration of either fatty acid for an additional 24 h. Negative control conditions for the fatty acid-supplementation condition included incubating cells with vehicle-treated media only. Cells were then extracted in the presence of 17:0 CE internal standard by a modified Bligh-Dyer technique [20] with saline in the aqueous phase. The collected chloroform phases were sequentially dried under nitrogen, resuspended in 250 µL of chloroform, and stored under N2 at −20 °C until analysis. For direct-infusion ESI analysis, 50 µL of the resuspended lipid solution (in chloroform) was added to 200 µL of methanol. NaOH was added to each sample at a concentration of ~10 µM. The ion intensity of each CE molecular species was divided by the ion intensity of the internal standard (CE 17:0), and the mass of each molecular species was determined using parameters from response calibration lines determined for each molecular species in comparison to 17:0 CE. Values for CE molecular species are normalized to cell protein (Bio-Rad Laboratories, Inc., Hercules, CA).
Mouse feeding studies
Six week old female C57BL6 mice were started on Western diets (Harlan Teklad 88137) and remained on this diet for 14 weeks. Control, age-matched female mice were fed regular chow diet (Teklad 2018S) for the same interval. Blood was collected at the end of this interval by cardiac puncture, and plasma was prepared by centrifugation. Ten microliters of mouse plasma was extracted in the presence of 17:0 CE internal standard by a modified Bligh-Dyer technique [20] with saline in the aqueous phase. Plasma lipid extracts were then subjected to direct infusion ESI-MS for the analyses of CE molecular species.
Preparation of oxidized unsaturated CE
Selected CE molecular species (1 nmol) were dried under nitrogen in a 12 × 100 mm borosilicate test-tube and were either immediately resuspended in 250 µL methanol/chloroform (4/1) or were exposed to ambient air for 6 or 15 h prior to being resuspended in 250 µL methanol/chloroform (4/1). For each sample, 1 nmol of 17:0 CE was added as an internal calibrant. Precursor CE molecular species and their oxidized products were subsequently examined by neutral loss scan of 368.5 employing the parameters described above. The CE and CE oxidation species were monitored as sodiated adducts following the addition of NaOH.
Results
Direct infusion ESI-MS of sodiated adducts of individual CE molecular species
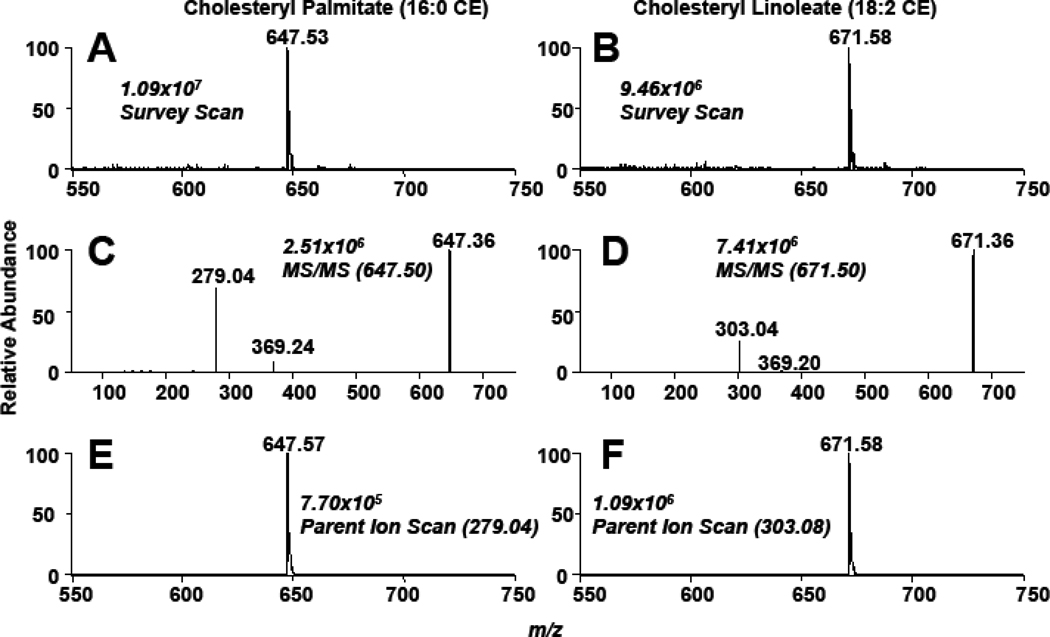
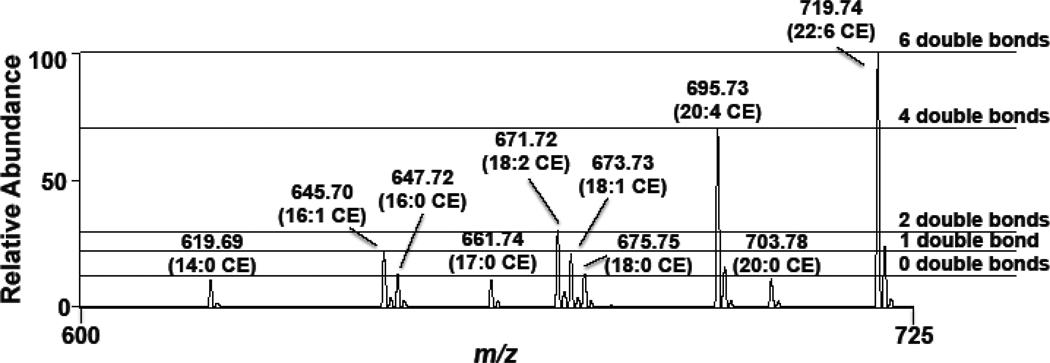
As a first step to examine the feasibility of using sodiated adducts of CE for their quantification by mass spectrometry, survey scan spectra and collisionally-activated dissociation (CAD) spectra were collected for 16:0 and 18:2 CE. Data shown in Figure 1 show the survey scans of sodiated adducts of both 16:0 and 18:2 CE (Panels A & B), and the collisionally-activated dissociation (CAD) spectra of each molecular species with both the cholestane (m/z 369.2) and sodiated fatty acid ions (m/z 279.04 and 303.08) observed (Panels C & D, Figure 1). While others have shown CAD of molecular ions of ammonium adducts of CE yields a robust cholestane positive ion [16,21,22], these results show that the sodiated adduct only forms a weak cholestane positive ion and preferentially loses this residue as a neutral in concert with the appearance of an abundant sodiated fatty acyl positive fragment ion. Panels E & F of Figure 1 show the parent ion scans using the product ion of the sodiated ion fatty acid (e.g., PI 279.04 and 303.08 for 16:0 CE and 18:2 CE of the sodiated adducts, respectively). It is important to appreciate that the fragmentation of the sodiated CE molecular species to their respective metal ion fatty acyl fragment represents the loss of the neutral fragment cholestane, and this neutral loss can, thus, be potentially useful in uniformly detecting CE. Indeed, Figure 2 shows the neutral loss (NL) scan of 368.5 of an equimolar mixture of CE molecular species. Importantly, it should be noted that CE with varying degrees of unsaturation have different ionization efficiencies. Positive ions of sodiated adducts of CE molecular species have a greater intensity as the degree of unsaturation increases for sodiated adducts of CE. Accordingly, ionization of the sodiated adduct of each CE molecular species was compared to that of 17:0 CE to determine their relative responses. In addition, 17:0 CE was used in subsequent studies as an internal standard to quantify CE molecular species in biological samples. Table 1 shows the individual calibration constants for the sodiated CE molecular species. Examination of these calibration constants reflect the increased ionization intensities of polyunsaturated CE molecular species with these molecular species having increased slopes compared to the monounsaturated and saturated molecular species. Corrections for disparate ion intensities of these CE molecular species are predominantly dependent on the response factor (slope of calibration lines), and the impact of the y-intercepts is generally negligible.
Figure 1.
Survey, CAD, and parent ion scans of sodiated cholesteryl palmitate (16:0 CE) and linoleate (18:2 CE) using direct-infusion ESI-MS analysis. Survey scans (A & B) were acquired for five min over the m/z range of 550 – 750. The CAD analysis (C & D) was performed at a collisional energy of 25 eV. Parent ion scans (E & F) were acquired from the sodiated fatty acyl fragment (25 eV). The neutral loss of cholestane (NL 368.5) was also performed at 25 eV (D). The concentrations of 16:0 and 18:2 CE were 10 µM. The NaOH added prior to ESI analysis was 10 µM.
Figure 2.
Neutral loss of 368.5 MS/MS analyses of an equimolar mixture of the cholesteryl esters (each at 2 µM) as sodiated adducts. Spectra were obtained using the neutral loss 368.5 at a collisional energy of 25 eV as described in “Materials and methods”. Horizontal dashed lines highlight the disparate ionization efficiencies associated with CE molecular species containing different levels of unsaturation.
Table 1.
Calibration line parameters for sodiated adducts of CE molecular species
| CE | NL 368.5 [M + Na]+ | Line Parameters |
|---|---|---|
| 14:0 | 619.54 | y = 0.8503x − 0.0073 |
| 16:0 | 647.57 | y = 1.0642x − 0.0057 |
| 16:1 | 645.56 | y = 2.3832x + 0.0088 |
| 18:0 | 675.61 | y = 1.1076x − 0.0258 |
| 18:1 | 673.59 | y = 1.9934x + 0.0094 |
| 18:2 | 671.57 | y = 2.7519x − 0.0151 |
| 18:3 | 669.56 | y = 3.4011x + 0.0379 |
| 20:4 | 695.57 | y = 4.6394x − 0.1213 |
| 22:6 | 719.57 | y = 4.8166x − 0.1237 |
Linear regression of ion intensity responses for each CE molecular species over a concentration range of 0.1 – 10 µM was determined. In all cases, the coefficient of determination (R2) was greater than 0.99. The internal standard, 17:0 CE was constant at 2 µM.
Resolving CE molecular species from isobaric ions using the NL 368.5 scan mode
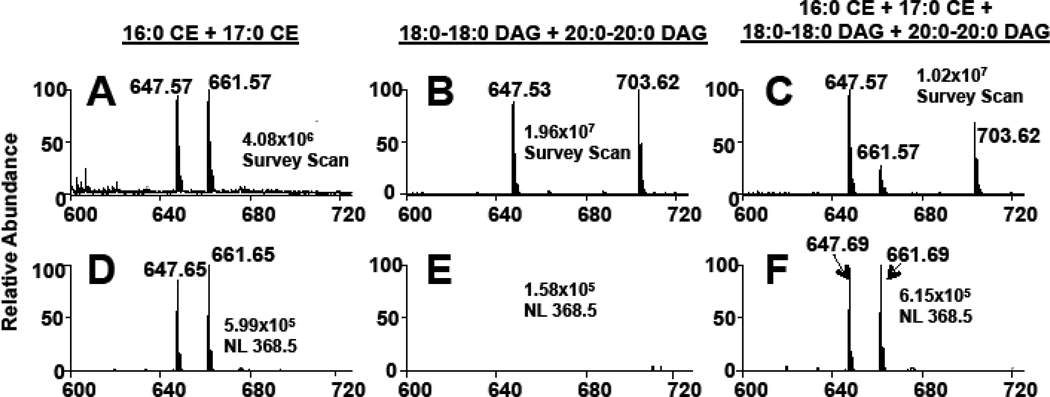
NL scanning for 368.5 was used to examine CE in the presence of isobaric diacylglycerol (DAG) molecular species to assess the utility of this NL 368.5 approach for the specific detection of CE molecular species. For this analysis, 16:0 CE and distearin (18:0-18:0 DAG) were examined as sodiated adducts, which both have molecular ions at m/z 647 (Figure 3). Panels A and D of Figure 3 show the survey scan and NL 368.5 scan, respectively, for a mixture of 16:0 and 17:0 CE, which have molecular ions at m/z 647.6 and 661.6, respectively. Panels B and E show the same scans for the analyses of a mixture of 18:0-18:0 DAG and diarachidin (20:0-20:0 DAG), which have molecular ions at m/z 647.5 and 703.6, respectively. These sodiated adducts of the DAGs are not detected with the CE-specific NL 368.5 scan mode (Panel E). Panels C and F show the survey scan and NL 368.5 scan, respectively, for the analyses of all four CE and DAG species in one mixture. In this isobaric mixture, a large m/z 647 ion was observed in the survey scan (Panel C) due to the presence of the two isobaric lipids. Note that the ion at m/z 647 in the survey scan (Panel C) is greater in intensity than the two internal calibrants (17:0 CE and 20:0-20:0 DAG). However, only the CE molecular species were detected in the NL 368.5 scan (Panel F), and yielded equal ion intensities for this analysis since the saturated CE were present at equimolar concentrations. Thus, these data demonstrate that NL 368.5 scanning can be used to distinguish isobaric CE from DAG molecular species using sodiated adducts.
Figure 3.
MS and MS/MS analyses of CE and DAG sodiated adducts. 16:0 CE (m/z 647) and 17:0 CE (m/z 661) (A and D), 18:0-18:0 DAG (m/z 647) and 20:0-20:0 DAG (m/z 703) (B and E), and a mixture of both CE and DAGs (C and F) (all lipids present at a concentration of 5 µM) were subjected to direct-infusion ESI-MS analysis. Panels A–C are survey scans of each lipid mixture over an m/z range of 600 – 725 for five min. Panels D–F are scans for the neutral loss of 368.5, which were acquired for three min. The collisional energy for the MS/MS analysis of the CE molecular species was 25 eV. The NaOH added prior to ESI analysis was 10 µM.
CE molecular species in J774 cells supplemented with specific fatty acids in cell culture media
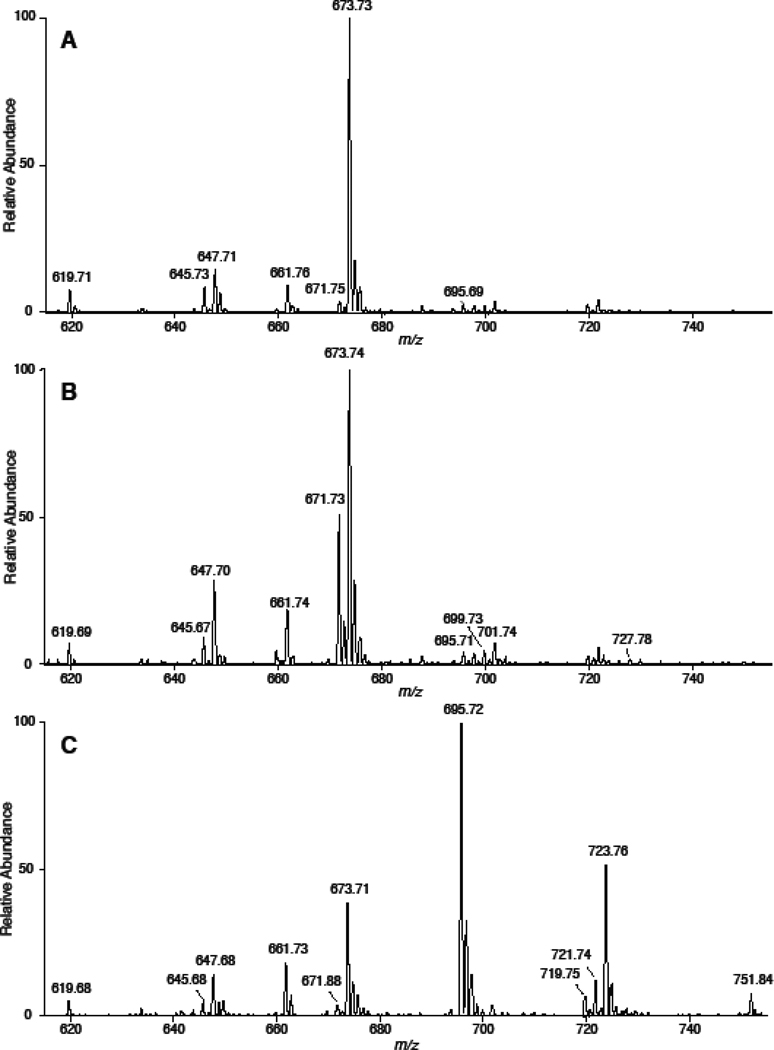
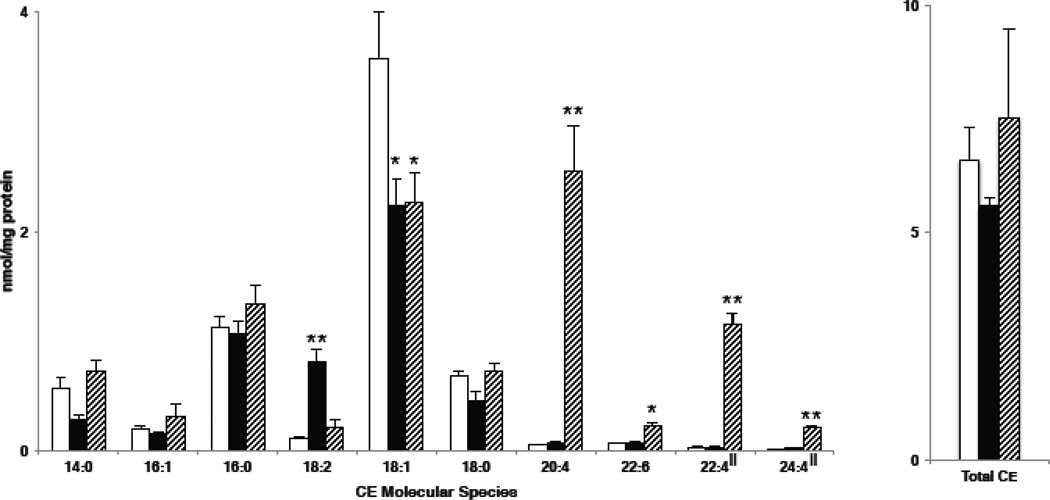
To test the NL 368.5 scan as a technique to quantify CE molecular species of sodiated adducts in biological samples, we treated mouse monocyte-derived macrophages (J774 cells) with media that was supplemented with specific fatty acids to delineate the fatty acid incorporation into CE molecular species. The mass spectra using NL 368.5 for cells without fatty acid treatment revealed that 18:1 CE (m/z 673.73) was predominantly present in J774 cells grown in the cell culture media with minimal levels of 18:2 and 20:4 CE present in these cells (Figure 4, Panel A). In the spectra shown in Figure 4, m/z 661.7 is the sodiated adduct of the internal standard, 17:0 CE. Figure 4, Panel B demonstrates that J774 cells supplemented with linoleic acid in the media have increased levels of intracellular 18:2 CE (m/z 671.73). Interestingly, as shown in Figure 4 (Panel C), J774 cells incorporate arachidonic acid into CE pools (m/z 695.72), and also apparently elongate 20:4 to 22:4 and 24:4 under these cell culture conditions leading to the appearance of 22:4 and 24:4 CE (e.g., m/z 723.76 and 751.84, respectively). Additional analyses showing the accumulation of 22:4 and 24:4 CE molecular species were performed with the addition of both 17:0 CE and 18:3 CE added as internal calibrants (Supplemental Figure). The inclusion of 18:3 CE did not impact the relative spectral intensities of the endogenous CE as well as the 17:0 CE standard. (Supplemental Figure). The amounts of specific CE for J774 cells treated with either linoleic or arachidonic acid compared to cells with no fatty acid treatment are summarized in Figure 5. With both fatty acid supplementations to the cell culture media the respective CE molecular species increased with an accompanied decrease in the amount of 18:1 CE. The total CE levels only marginally changed in cells treated with fatty acids due to the accumulation of new molecular species being offset by the decrease in 18:1 CE levels.
Figure 4.
NL 368.5 scans of sodiated CE present in J774 cells. J774 cells were cultured in the presence of either no fatty acid supplementation (A), linoleic acid supplementation (B) or arachidonic acid supplementation (C). At the end of the cell culture treatment interval, lipids were extracted from J774 cells with 17:0 CE added as an internal standard as described in detail in “Materials and methods”. Neutral loss scans were acquired for five min at a collisional energy of 25 eV. NaOH added prior to ESI analysis was 10 µM.
Figure 5.
CE molecular species present in J774 cells. J774 cells were cultured in the presence of either no fatty acid supplementation (open bars), linoleic acid supplementation (black bars) or arachidonic acid supplementation (hatched bars). At the end of the cell culture treatment interval, lipids were extracted from J774 cells with 17:0 CE added as an internal standard, and were subsequently subjected to ESI-MS using NL 368.5 scanning as described in detail in “Materials and methods”. Values are the means + S.E.M. for n = 3. All values were corrected by calibration constants in Table 1 with the exception of those indicated (‖), which were corrected with the response factor (slope) of the corresponding shorter chain fatty acid with the same degree of unsaturation. For example, 22:4 and 24:4 CE were corrected using the 20:4 response factor. These elongated CE molecular species were not available to derive response curves.
Mouse plasma CE molecular species
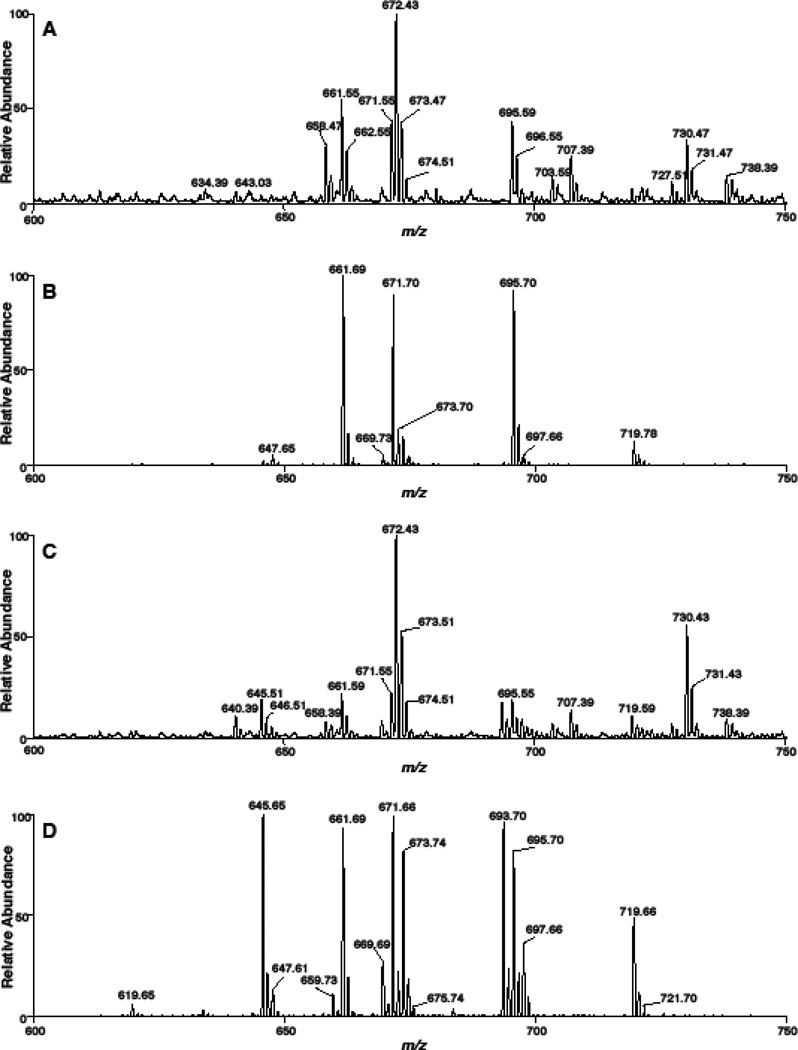
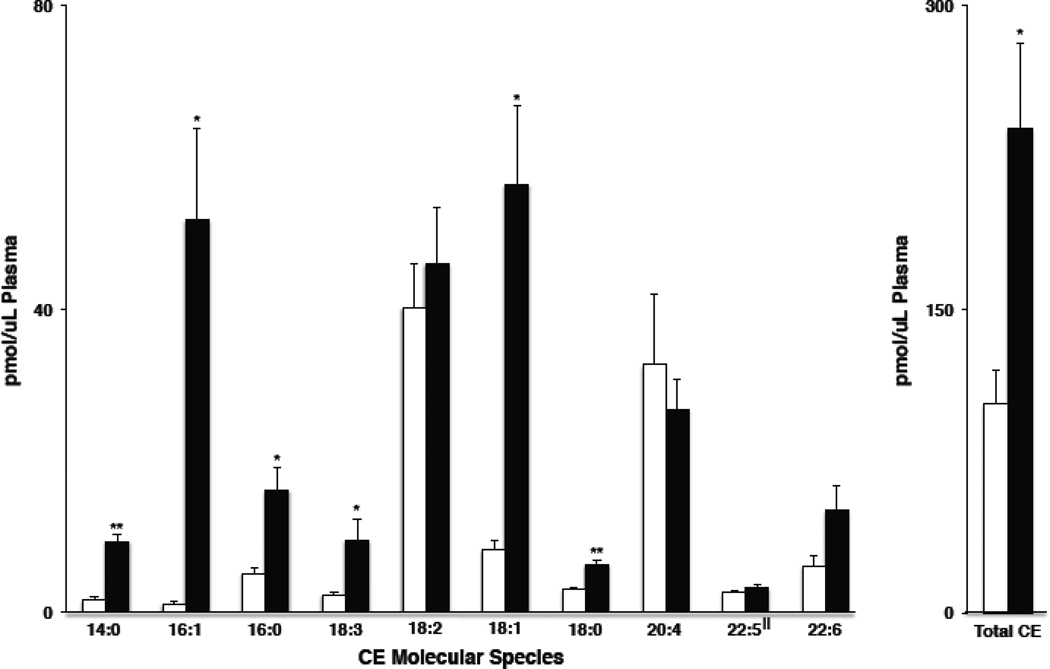
To further illustrate the utility of NL 368.5 scanning for CE using sodiated adducts, we examined the CE molecular species in the lipid extracts prepared from plasma isolated from female mice fed either normal chow (Panels A & B of Figure 6) or a Western diet (Panels C & D of Figure 6). Survey scans in the positive ion mode (Panels A & C) showed CE molecular species amongst other isobaric positive ions, which potentially may preclude an accurate quantification of the CE molecular species. Panels B & D are the same lipid extracts but were subjected to NL 368.5 scanning for CE identification. From these scans, it was readily be appreciated that the overall plasma CE levels were elevated and that the CE molecular species profile was much more diverse in mice fed the Western diet (comparing Panels B & D of Figure 6). Figure 7 summarizes the quantitative data for the plasma CE in mice fed these two diets. In particular, the Western diet led to large increases in both 16:1 and 18:1 CE molecular species. These changes may reflect either increased production of monounsaturated fatty acids that are subsequently incorporated into the CE pool or, alternatively, enrichment of oleic acid in the Western diet (Teklad diet data). Interestingly, the Western diet is not enriched with palmitoleic acid. Also, it should be noted that the Western diet was enriched with cholesterol in comparison to the normal chow diet, which likely was responsible for the almost two-fold increase in total CE levels present in the plasma of these mice.
Figure 6.
Survey and NL 368.5 scans of sodiated cholesteryl esters present in mouse plasma. Female mice were fed a diet of either normal chow (A & B) or Western diet chow (C & D) for 14 weeks, and plasma was subsequently collected for the analyses of CE molecular species as described in detail in “Materials and methods”. Survey scans (A & C) and NL 368.5 scans (B & D) at a collisional energy of 25 eV were each acquired for five min. The NaOH added prior to ESI analysis was 10 µM.
Figure 7.
Plasma CE molecular species in female mice fed either normal chow diet or Western diet. Female mice were fed a diet of either normal chow (open bars) or Western diet chow (black bars) for 14 weeks, and plasma was subsequently collected for the analysis of CE molecular species using NL 368.5 scans as described in detail in “Materials and methods”. All values were corrected by calibration constants in Table 1 with the exception of 22:5 CE (‖), which was corrected with the response factor (slope) of 20:4 CE. Values are the means + S.E.M. for n = 3. * and ** indicate p < 0.05 and p < 0.005 for comparisons between normal chow diet and the Western diet.
Oxidative modification of unsaturated CE molecular species
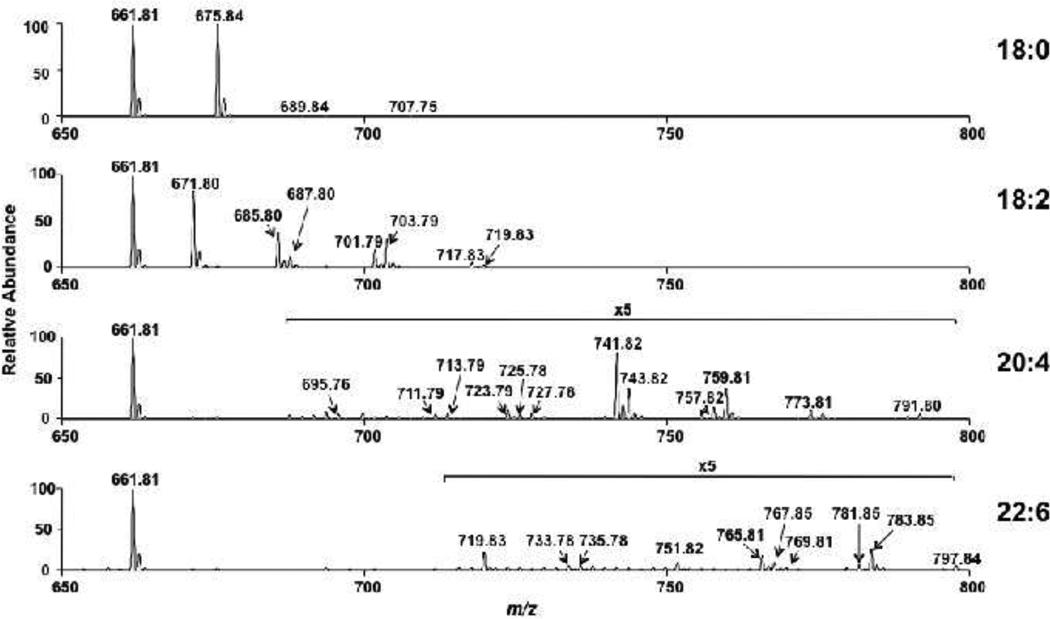
Studies with arachidonic acid supplementation of J774 cells unexpectedly revealed that arachidonic acid addition led to an increase in elongated CE molecular species, which were observed in the CE pool (Figure 4). This finding was rapidly determined using the NL 368.5, which is CE class-specific. Similarly this technique was used to examine air oxidation of CE with varying degrees of unsaturation (Figure 8). NL 368.5 scans of 18:0 CE exposed to ambient air for 15 h indicated that this saturated molecular species was not degraded in an oxidizing environment (Fig. 8, Panel A). In contrast, 18:2, 20:4 and 22:6 CE molecular species were significantly oxidized after exposure to ambient air for 15 h (Panels B–D). Note that in these same analyses, 17:0 CE was added prior to ESI-MS analyses to allow relative comparisons of the parent CE loss due to air oxidation. Close examination of the NL 368.5 scans of 18:2 CE exposed to ambient air revealed oxidation of the parent sodiated adduct of 18:2 CE (m/z 671.80) and the appearance of species enriched with one oxygen (m/z 685.80 and 687.80) and two oxygens (m/z 701.79 and 703.79) (Figure 8, Panel B). These oxidized molecular species likely reflect the incorporation of oxygen into the parent molecule with 14 and 16 amu increases that likely represent the formation of oxoODE and epoxide species, respectively [8,23]. It is also clear from these studies that as the degree of unsaturation increases in CE (e.g., 20:4 CE and 22:6 CE), the relative rate of CE oxidation increases (Figure 8). It is envisioned that this rapid analytical method has utility in assessing the oxidation of unsaturated molecular species of CE that are added exogenously in experimental models. Furthermore, the fragmentation of specific species produced in vivo under oxidizing conditions could potentially be detected with this NL technique particularly in conjunction with chromatography.
Figure 8.
Comparative oxidation of saturated and unsaturated CE. Indicated CE molecular species (18:0, 18:2, 20:4, and 22:6 molecular species) were dried individually and exposed to ambient air for 15 h. Treatments were terminated by resuspending CE in methanol/chloroform (4/1) containing equimolar 17:0 CE added as an internal calibrant. Each treated CE was subsequently subjected to direct-infusion ESI-MS analyses using neutral loss 368.5 scanning of sodiated adducts as described in “Materials and methods”. In the absence of oxidizing conditions, NL 368.5 analyses showed precursor CE were not decomposed and no oxidized products were observed.
Discussion
CE is predominantly found in the core of lipoproteins and lipid droplets [7,8,10]. Total plasma cholesterol and its association with specific lipoproteins is an important indicator of cardiovascular risk. Total plasma cholesterol is comprised of both free and esterified cholesterol. Both free cholesterol and CE is carried in plasma by lipoproteins. Despite the importance of CE as an indicator of cardiovascular disease, determining the specific aliphatic fatty acid associated with the CE is often overlooked in both clinical and experimental analyses, which is typically determined by removing the fatty acid by cholesteryl esterase, and then coupling cholesterol oxidase with a colormetric readout. Using MS, CE molecular species form relatively poor protonated ions compared to other lipids containing class-specific functional groups that ionize [12,24]. Previous studies have used ammonium acetate to create [M + NH4]+ ions of lipids using ESI-MS [15–17, 25]. Several groups [16,21,22] have examined ammoniated adducts of CE, which under CAD conditions results in predominant cholestane cation fragment. In comparison to the fragmentation of ammoniated adducts of CE, the sodiated adduct had an intense sodiated fatty acid fragment from the neutral loss of the cholestane residue. In addition, lithiated adducts of CE have also been shown to preferentially form lithiated fatty acid fragments in comparison to the cholestane cation observed with ammoniated adducts [26]. It should be appreciated though that the use of sodium to form adducts of CE enables faster workup of samples and is less problematic compared to the use of lithium, which requires extensive back extractions to remove sodium from biological samples.
Overall the goal of this study was to develop an electrospray ionization MS/MS method that could be used to readily quantify CE in biological samples and overcome potential interference and inaccuracies associated with other positive ions that are present in the mass range of biologically relevant CE (~ m/z 600–750 for sodiated adducts). Data shown in Figure 3 clearly shows that NL 368.5 scanning specifically detects CE and does not detect isobaric DAG molecular species. Furthermore comparisons of positive ion survey scans and NL 368.5 scans shown in Figure 6 from lipid extracts of mouse plasma demonstrates the utility of NL 368.5 scanning for detection of CE in complex biological matrices. Similar to other CE adducts that have been assessed in the past [16,26], CE molecular species with varying degrees of unsaturation were shown to have different ionization efficiencies. CE have a weak dipole that is enhanced in the presence of sodium, and, similar to the dipole of triglycerides and CE with other adducts, the dipole in sodiated CE is dependent on the aliphatic chain length and more specifically the degree of unsaturation of the aliphatic group [12,15,16,27]. Due to the varying degree of chain length and unsaturation for CE present in complex biological samples, it was necessary to generate individual calibration lines for each CE molecular species to correct for disparate responses compared to that of the internal standard (17:0 CE).
It should be appreciated that the use of neutral loss 368.5 scanning for the detection of CE molecular species can also be applied to rapidly determine alterations in the CE molecular species within biological samples, as well as assess fatty acyl decomposition of CE. We performed three experiments that demonstrate the utility of this technique. In the first study, J774 cells were treated with physiological concentrations (50 µM) of either linoleic acid or arachidonic acid, and then assessed their effect on cellular CE composition. The predominant CE in J774 cells under normal cell culture conditions (control) was 18:1 CE. With addition of either linoleic or arachidonic acid to the cell culture media there was as drop in 18:1 CE levels accompanied by an increase in 18:2 or 20:4 CE respectively. Analyses using NL 368.5 scanning also revealed the somewhat unexpected finding that fatty acid chain elongation products were present in the CE pool of J774 cells treated with arachidonic acid (i.e., 22:4 and 24:4 CE were present). It should be noted that arachidonic acid has previously been shown to undergo elongation, and interestingly 22:4 CE is the predominant CE in the adrenal gland (28,29). In the second study, female mice were fed either a normal chow or Western diet for 14 weeks, and plasma CE levels were examined. In the normal chow fed female mouse, the predominant plasma CE were 18:2 and 20:4 CE. In comparison to the chow fed female mice, female mice on a Western diet had nearly the same levels of 18:2 and 20:4 CE, but had a large increase in both 18:1 and 16:1 CE leading to a doubling of the total CE level. In the third study, we examined the air oxidation of several CE standards using the NL 368.5 scan mode to monitor the specific oxidation of CE molecular species. Oxidation of polyunsaturated species of CE is a concern both in the food industry since oxidized CE contribute to the rancid nature of spoiled oils 30] and from a health perspective since oxidized CE molecular species present in lipoproteins are a key contributor to the development of early atherosclerotic fatty streaks [8,23]. Data herein demonstrates that the neutral loss technique can be used to quantitatively assess the loss of the CE molecular species to oxidation as well as the concomitant qualitative visualization of the oxidized products. It should be appreciated that CE that contain increasing levels of unsaturation are much more susceptible to air oxidation, and saturated CE are relatively stable when exposed to air under the conditions employed. These oxidation studies focused on the oxidation of the aliphatic chain of polyunsaturated molecular species of CE, and not the oxidation of the sterol nucleus. Sterol nucleus oxidation likely would not be detectable by the neutral loss of the cholestane fragment since the cholestane residue would be modified. Additionally, quantifying the oxidized species of CE will require comparing authentic oxidized CE molecular species to an internal standard to obtain species-specific response factors. Taken together, these three experimental approaches illustrate the utility of NL 368.5 scans of the positive ion sodiated adducts of CE in biological samples as well as the verification that the polyunsaturated fatty acid constituents of CE are intact and not oxidized.
In summary, these studies demonstrate the feasibility of forming sodiated adducts of CE molecular species, which can then be specifically detected by NL scanning of 368.5. Sodiated adducts can readily be formed in biological matrices extracted in the presence of saline in the aqueous phase and with the addition of micromolar concentrations of NaOH to samples subjected to direct infusion ESI-MS. Furthermore, since this is a lipid class-specific techinique, direct infusion ESI-MS/MS can be used to accurately quantify CE molecular species in the presence of isobaric species in complex or crude biological lipid extracts.
Supplementary Material
Acknowledgements
This research was supported by NIH grants HL074214, HL088073, HL098907 and RR019232 (DAF).
Abbreviations
- CE
Cholesteryl Ester
- CAD
Collisionally-Activated Dissociation
- DAG
Diacylglycerol
- ESI
Electrospray Ionization
- GC
Gas Chromatography
- MS
Mass Spectrometry
- NL
Neutral Loss
- MS/MS
Tandem Mass Spectrometry
References
- 1.Brown MS, Ho YK, Goldstein JL. The cholesteryl ester cycle in macrophage foam cells. Continual hydrolysis and re-esterification of cytoplasmic cholesteryl esters. J Biol Chem. 1980;255:9344–9352. [PubMed] [Google Scholar]
- 2.Meng X, Zou D, Shi Z, Duan Z, Mao Z. Dietary diacylglycerol prevents high-fat Diet-induced lipid accumulation in rat liver and abdominal adipose tissue. Lipids. 2004;39:37–41. doi: 10.1007/s11745-004-1199-1. [DOI] [PubMed] [Google Scholar]
- 3.Schwartz CC, VandenBroek JM, Cooper PS. Lipoprotein cholesteryl ester production, transfer, and output in vivo in humans. J. Lipid Res. 2004;45:1594–1607. doi: 10.1194/jlr.M300511-JLR200. [DOI] [PubMed] [Google Scholar]
- 4.Brown MS, Goldstein JL. The SREBP Pathway: Regulation of cholesterol metabolism by proteolysis of a membrane-bound transcription factor. Cell. 1997;89:331–340. doi: 10.1016/s0092-8674(00)80213-5. [DOI] [PubMed] [Google Scholar]
- 5.Francone OL, Gurakar A, Fielding C. Distribution and functions of lecithin:cholesterol acyltransferase and cholesteryl ester transfer protein in plasma lipoproteins. Evidence for a functional unit containing these activities together with apolipoproteins A–I and D that catalyzes the esterification and transfer of cell-derived cholesterol. J Biol Chem. 1989;264:7066–7072. [PubMed] [Google Scholar]
- 6.Suckling KE, Stange EF. Role of acyl-CoA: cholesterol acyltransferase in cellular cholesterol metabolism. J Lipid Res. 1985;26:647–671. [PubMed] [Google Scholar]
- 7.Brecher PI, Chobanian AV. Cholesteryl ester synthesis in normal and atherosclerotic aortas of rabbits and Rhesus monkeys. Circ Res. 1974;35:692–701. doi: 10.1161/01.res.35.5.692. [DOI] [PubMed] [Google Scholar]
- 8.Harkewicz R, Hartvigsen K, Almazan F, Dennis EA, Witztum JL, Miller YI. Cholesteryl ester hydroperoxides are biologically active components of minimally oxidized low density lipoprotein. J Biol Chem. 2008;283:10241–10251. doi: 10.1074/jbc.M709006200. [DOI] [PMC free article] [PubMed] [Google Scholar]
- 9.Zock PL, Mensink RP, Harryvan J, de Vries JHM, Katan MB. Fatty acids in serum cholesteryl esters as quantitative biomarkers of dietary intake in humans. Am. J. Epidemiol. 1997;145:1114–1122. doi: 10.1093/oxfordjournals.aje.a009074. [DOI] [PubMed] [Google Scholar]
- 10.Mahlberg FH, Glick JM, Jerome WG, Rothblat GH. Metabolism of cholesteryl ester lipid droplets in a J774 macrophage foam cell model. Biochim Biophys Acta. 1990;1045:291–298. doi: 10.1016/0005-2760(90)90133-i. [DOI] [PubMed] [Google Scholar]
- 11.Tosi MR, Bottura G, Lucchi P, Reggiani A, Trinchero A, Tugnoli V. Cholesteryl esters in human malignant neoplasms. Int. J. Mol. Med. 2003;11:95–98. doi: 10.3892/ijmm.11.1.95. [DOI] [PubMed] [Google Scholar]
- 12.Han X, Gross RW. Shotgun lipidomics: electrospray ionization mass spectrometric analysis and quantitation of cellular lipidomes directly from crude extracts of biological samples. Mass Spectrometr Rev. 2005;24:367–412. doi: 10.1002/mas.20023. [DOI] [PubMed] [Google Scholar]
- 13.Wenk MR. The emerging field of lipidomics. Nat Rev Drug Discov. 2005;4:594–610. doi: 10.1038/nrd1776. [DOI] [PubMed] [Google Scholar]
- 14.Schiller J, Süß R, Arnhold J, Fuchs B, Leßig J, Müller M, Petkovic M, Spalteholz H, Zschörnig O, Arnold K. Matrix-assisted laser desorption and ionization time-of-flight (MALDI-TOF) mass spectrometry in lipid and phospholipid research. Prog Lipid Res. 2004;43:449–488. doi: 10.1016/j.plipres.2004.08.001. [DOI] [PubMed] [Google Scholar]
- 15.Hutchins PM, Barkley RM, Murphy RC. Separation of cellular nonpolar neutral lipids by normal-phase chromatography and analysis by electrospray ionization mass spectrometry. J. Lipid Res. 2008;49:804–813. doi: 10.1194/jlr.M700521-JLR200. [DOI] [PMC free article] [PubMed] [Google Scholar]
- 16.Liebisch G, Binder M, Schifferer R, Langmann T, Schulz B, Schmitz G. High throughput quantification of cholesterol and cholesteryl ester by electrospray ionization tandem mass spectrometry (ESI-MS/MS) Biochim Biophys Acta. 2006;1761:121–128. doi: 10.1016/j.bbalip.2005.12.007. [DOI] [PubMed] [Google Scholar]
- 17.Murphy RC, James PF, McAnoy AM, Krank J, Duchoslav E, Barkley RM. Detection of the abundance of diacylglycerol and triacylglycerol molecular species in cells using neutral loss mass spectrometry. Anal Biochem. 2007;366:59–70. doi: 10.1016/j.ab.2007.03.012. [DOI] [PMC free article] [PubMed] [Google Scholar]
- 18.Duffin KL, Henion JD, Shieh JJ. Electrospray and tandem mass spectrometric characterization of acylglycerol mixtures that are dissolved in nonpolar solvents. Anal Chem. 1991;63:1781–1788. doi: 10.1021/ac00017a023. [DOI] [PubMed] [Google Scholar]
- 19.Murphy RC, Fiedler J, Hevko J. Analysis of nonvolatile lipids by mass spectrometry. Chem Rev. 2001;101:479–526. doi: 10.1021/cr9900883. [DOI] [PubMed] [Google Scholar]
- 20.Bligh EG, Dyer WJ. A rapid method of total lipid extraction and purification. Can J Biochem Physiol. 1959;37:911–917. doi: 10.1139/o59-099. [DOI] [PubMed] [Google Scholar]
- 21.Duffin K, Obukowicz M, Raz A, Shieh JJ. Electrospray/tandem mass spectrometry for quantitative analysis of lipid remodeling in essential fatty acid deficient mice. Anal Biochem. 2000;279:179–188. doi: 10.1006/abio.1999.4452. [DOI] [PubMed] [Google Scholar]
- 22.Kalo P, Kuuranne T. Analysis of free and esterified sterols in fats and oils by flash chromatography, gas chromatography and electrospray tandem mass spectrometry. J Chromatogr A. 2001;935:237–248. doi: 10.1016/s0021-9673(01)01315-2. [DOI] [PubMed] [Google Scholar]
- 23.Fang L, Harkewicz R, Hartvigsen K, Wiesner P, Choi S-H, Almazan F, Pattison J, Deer E, Sayaphupha T, Dennis EA, Witztum JL, Tsimikas S, Miller YI. Oxidized cholesteryl esters and phospholipids in Zebrafish larvae fed a high cholesterol diet. J Biol Chem. 2010;285:32343–32351. doi: 10.1074/jbc.M110.137257. [DOI] [PMC free article] [PubMed] [Google Scholar]
- 24.Li YL, Su X, Stahl PD, Gross ML. Quantification of diacylglycerol molecular species in biological samples by electrospray ionization mass spectrometry after one-step derivatization. Anal Chem. 2007;79:1569–1574. doi: 10.1021/ac0615910. [DOI] [PMC free article] [PubMed] [Google Scholar]
- 25.Wewer V, Dombrink I, vom Dorp K, Doermann P. Quantification of sterol lipids in plants by quadrupole time of flight mass spectrometry. J Lipid Res. 2011 doi: 10.1194/jlr.D013987. (In Press) [DOI] [PMC free article] [PubMed] [Google Scholar]
- 26.Bowden JA, Albert CJ, Barnaby OS, Ford DA. Analysis of cholesteryl esters and diacylglycerols using lithiated adducts and electrospray ionization-tandem mass spectrometry. Anal Biochem. 2011;417:202–210. doi: 10.1016/j.ab.2011.06.015. [DOI] [PMC free article] [PubMed] [Google Scholar]
- 27.Han X, Gross RW. Quantitative analysis and molecular species fingerprinting of triacylglyceride molecular species directly from lipid extracts of biological samples by electrospray ionization tandem mass spectrometry. Anal Biochem. 2001;295:88–100. doi: 10.1006/abio.2001.5178. [DOI] [PubMed] [Google Scholar]
- 28.Wijendran V, Lawrence P, Diau G-Y, Boehm G, Nathanielsz PW, Brenna JT. Significant utilization of dietary arachidonic acid is for brain adrenic acid in baboon neonates. J Lipid Res. 2002;43:762–767. [PubMed] [Google Scholar]
- 29.Cheng B, Kowal J. Analysis of adrenal cholesteryl esters by reversed phase high performance liquid chromatography. J Lipid Res. 1994;35:1115–1121. [PubMed] [Google Scholar]
- 30.German JB. Food processing and lipid oxidation. Adv Exp Med Biol. 1999;459:23–50. doi: 10.1007/978-1-4615-4853-9_3. [DOI] [PubMed] [Google Scholar]
Associated Data
This section collects any data citations, data availability statements, or supplementary materials included in this article.


