

Abstract
Chronic pain is a common and costly experience. Cognitive-behavioral therapies (CBT) are efficacious for an array of chronic pain conditions. However, the literature is based primarily on urban (white) samples. It is unknown whether CBT works in low-socioeconomic (SES), minority and non-minority groups. To address this question, we conducted a Randomized Controlled Trial within a low-SES, rural chronic pain population. Specifically, we examined the feasibility, tolerability, acceptability, and efficacy of group CBT compared to a group education intervention (EDU). We hypothesized that while both interventions would elicit short- and long-term improvement across pain-related outcomes, the cognitively-focused CBT protocol would uniquely influence pain catastrophizing. Mixed design ANOVAs were conducted on the sample of eligible participants who did not commence treatment (N=26), the intent-to-treat sample (ITT; N=83), and on the completer sample (N=61). Factors associated with treatment completion were examined. Results indicated significantly more drop-outs occurred in CBT. ITT analyses showed that participants in both conditions reported significant improvement across pain-related outcomes, and a nonsignificant trend was found for depressed mood to improve more in CBT than EDU. Results of the completer analyses produced a similar pattern of findings; however, CBT produced greater gains on cognitive and affect variables than EDU. Treatment gains were maintained at 6-month follow-up (N=54). Clinical significance of the findings and the number of treatment responders is reported. Overall, these findings indicate CBT and EDU are viable treatment options in low-SES, minority and non-minority groups. Further research should target disseminating and sustaining psychosocial treatment options within underserved populations.
Keywords: Minorities, chronic pain, randomized controlled trial, rural, low literacy
Introduction
Chronic pain is a major healthcare problem in the U.S. further compounded by general health and treatment disparities.3,14,77 Within rural populations, the debilitating nature of pain is amplified by structural barriers such as fewer economic resources, geographical isolation, and reduced access to quality medical care.57,61 Additionally, the demographic makeup of some rural populations (i.e., low-socioeconomic status [SES], low literacy) corresponds with elevated risk for poor pain-related outcomes.e.g.,2,14,18,29,32,47,48,53 Biomedical interventions are usually the first-line treatment for chronic pain, but they are often prohibitively expensive, have uncertain efficacy for decreasing functional disability, and carry substantial side effects. Psychosocial approaches to chronic pain management therefore represent an attractive treatment option.
Cognitive-Behavioral Therapy (CBT) is a widely accepted psychosocial treatment for chronic pain that is cost-effective and at least as efficacious as medically-based treatments.22 Positive outcomes include restoration of function and mood, and reductions in pain, pain interference, work absenteeism, medication use, and disability-related behavior.e.g.,4,12,21,38,42,50,55,74,79 Treatment gains from CBT are maintained at follow-up assessments.35,43,74 CBT for chronic pain may be an ideal candidate for disadvantaged rural groups of limited financial means.
Previous CBT trials have been conducted with primarily urban White patients with chronic pain. These patients are likely to have higher SES than rural minorities or non-minorities.32,40 It is unknown whether CBT is efficacious in low-SES, low literacy populations. To answer this question, we conducted a community-based Randomized Controlled Trial (RCT) within a rural, predominantly African-American chronic pain population with low-SES and low literacy. For a control condition, we chose an education intervention (EDU) which was psychosocial in nature. These approaches have been reported to help patients with chronic pain.e.g.,11,24,51,52,78 Moseley and colleagues suggested that providing information about the multidimensional nature of chronic pain promotes reconceptualization of the problem, which in turn alters attitudes and beliefs.51 Given rurality is associated with low-educational attainment,32,40 providing relevant factual information may be particularly salient. Thus, an EDU intervention adapted for low literacy participants provided an appropriate active control manipulation.
One aim of the project was to develop literacy-adapted and culturally sensitive group CBT and EDU interventions for low literacy rural pain sufferers that were feasible, tolerable and acceptable to participants. Feasibility was determined by calculating the ratio of eligible participants recruited to the number of participants commencing treatment. Tolerability was defined in terms of completion rates, session recall and homework accuracy. Acceptability was defined as treatment credibility ratings and patient satisfaction. A second aim was to test the comparative efficacy of CBT vs. EDU. We expected both interventions would be associated with short- and long-term improvement across primary pain-related outcome variables, pain intensity and pain interference, for this low literacy sample. However, a key target of CBT is reduction in pain catastrophizing, a negative mental set about anticipated or actual pain.67 Catastrophizing is a robust predictor of pain, disability, and adaptation to painful conditions.26,30,33,39,46,68 We anticipated that the cognitively-focused CBT protocol would uniquely influence pain catastrophizing. Changes in other secondary outcome variables (depression, perceived disability and quality of life) were also examined.
Methods
Trial Design
This trial compared two treatments for a heterogeneous group of chronic pain conditions in a randomized parallel group design: Cognitive-behavioral therapy (CBT) and Education (EDU). As shown in Figure 1, this trial included an initial screening phase; a baseline, pre-treatment assessment; a 10-week treatment delivery phase; a post-treatment assessment; and a 6-month post-treatment follow-up assessment. Initial screening was conducted over the phone, all assessments and treatment delivery took place within the participants’ primary care clinic. Data collection took place over a 2.5 year time frame (between July, 2007 and May, 2010) commensurate with the funding period of the study. This research was approved by the Institutional Review Board at the University of Alabama, and informed consent was obtained with all patients prior to participation.
Figure 1.
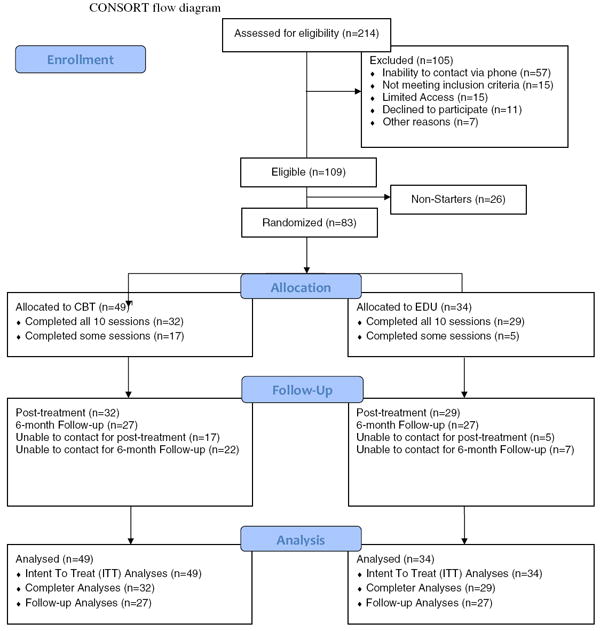
Participant flow through the RCT
1 Randomization with replacement was conducted such that 15 more individuals were randomized to CBT than EDU due to the higher dropout rates observed in CBT during the first half of the study
Setting and Participants
Participants were recruited from health clinics in three rural Alabama counties (Pickens, Wilcox, and Walker) through a variety of sources including: physician referrals at the Pine Apple Rural Health Clinic, Picken’s Medical Center, and the Capstone Rural Health Center; research staff representation at local fairs; nomination of other potentially eligible people by study participants (snowballing); and word of mouth. Study inclusion criteria were: (1) 19 years of age or older; (2) reported having experienced pain most days of the month, for the previous 3 months; (3) if currently taking analgesic or psychotropic medication, must have reported being on the same medication for at least 4-weeks prior to baseline assessment; (4) ability to read and write (in English) at the 2nd grade level or higher as determined by the Wide Range Achievement Test-4 reading/word decoding subtest (WRAT-4);80 (5) have a home telephone or comparable form of communication. Study exclusion criteria included the following: (1) HIV-related pain and cancer pain because these are associated with malignant disease;45 (2) significant cognitive impairment, evidenced by a positive screen (score of ‘0’ or ‘1 or 2 with an abnormal clock draw test’) on the Mini-cog;10 (3) other current psychosocial treatments for any pain condition; (4) schizophrenia, bipolar affective disorder, or seizure disorder not adequately controlled by medication, or current substance abuse as these conditions could result in medical emergencies during treatment.
Among the 214 patients approached to participate in the RCT, 109 of those actually screened were eligible, but 26 withdrew before sessions could be scheduled. Eighty-three people scheduled appointments to begin treatment, and this group represents the intent-to-treat (ITT) sample. Participants were randomized to either the CBT or EDU condition (see randomization procedure below) once they were deemed fully eligible for the study, subsequent to completion of the pre-treatment interview. Of the 83 people that began treatment, 22 did not complete all 10 sessions. Thus, 61 people completed all treatment sessions. See Figure 1 for a CONSORT flow diagram.49,60 The most common reasons for potential participants to not enroll in the study included an inability of study staff to contact the patient by telephone (resulting in an inability to screen them for eligibility), limited access to transportation to get to the clinic, unavailable due to family/situational demands/responsibilities, and in a small number of cases, a lack of interest after hearing a brief study description. All groups were conducted within the health clinics from which patients were recruited. In total, eleven CBT groups, and eight EDU groups were conducted with an average of three to four participant completers emerging from each group.
Therapists
All groups were conducted by both a licensed clinical psychologist with extensive experience in the treatment of chronic pain and an advanced graduate student in clinical psychology who served as a co-therapist. All co-therapists received extensive didactic and experiential training from Thorn. Co-therapists first read Thorn (2004),69 and Ehde et al. (2005),23 which provided the conceptual/theoretical base for the CBT and education control groups, and provide 10-session guides for therapists to implement the treatments. Fifteen hrs of didactic training and 15 hrs of experiential training were then conducted, which were allocated as follows: overview of the CBT and education groups (2 hrs), cultural sensitivity in theory-based interventions applicable to low income and minority populations (2 hrs), group therapy for medically ill patients (1 hr),64 and session-by-session implementation of the manualized treatment approaches (10 hrs). During this latter phase of didactic training, therapists viewed portions of videotapes from pilot groups led by Thorn. The same therapists conducted both the CBT and EDU interventions; possible cross-treatment contamination by therapists was therefore assessed via a scale measuring both adherence to the specific treatment manual and potential contamination (see Therapist Adherence to Protocol in measures section) and statistically examined.
Sample size and power
Post-hoc power calculations were conducted using the G*power program to verify whether the sample size obtained was adequate to detect effects that were hypothesized.25 Conventional alpha and power levels (.05 and .8 respectively) for a sample size of 61 participant completers were utilized. To investigate overall pre- to post-treatment improvement across both CBT and EDU groups combined, power was computed for an ANOVA repeated measures design, within factors analysis. Adequate power (>.8) was achieved to detect a small effect size (d <.2). To examine differences in outcome between CBT and EDU participants, power calculations based on ANOVA repeated measures design, between factors analysis indicated that the current study was powered to detect approximately medium effect sizes (d >.35). Therefore, given that past research typically shows medium effect size improvements on pain catastrophizing at post treatment (which is the only variable that we anticipated finding significant differences on between groups), adequate power to investigate the aims and hypotheses of the current study was achieved.e.g.,70,74
Measures to assess pre-treatment population characteristics
Structured Pain Interview
This interview was adapted with permission from Blanchard and Andrasik to determine patient report of type(s) of pain (e.g., arthritis), site(s) of pain (e.g., knee), and primary pain type and site.8 The interview also allowed the investigator to determine any conditions that might contraindicate participation in the study, such as pain associated with malignant disease (i.e., cancer pain, HIV pain).
Demographics Questionnaire
A brief demographics questionnaire was developed for this study to determine sample characteristics. The questionnaire required the participant to self-report information pertaining to race, age, sex, disability status, income, occupation (past and present), employment status, and years of education.
Primary Literacy and Cognitive Screening
The Wide Range Achievement Test-4 (WRAT-4) reading/word decoding subtest (blue form) was used to assess reading level (primary literacy).80 The test consists of 33 words of increasing difficulty, and responses are scored for accuracy of pronunciation. Scores are then converted to percentile ranks, which represent the percentage of individuals in the normative sample obtaining scores below a particular standard score.80 Percentile ranks range from a low of 1 to a high of 99, with 50 indicating the median or “typical” performance.80 Good internal consistency reliability (α=.91), appropriate content validity, and adequate predictive validity have been reported.80
Cognitive screening was accomplished with the Mini-Cog, which was developed as a short (2-5 minutes administration time) assessment of cognitive impairment to be used in primary care settings.10 The Mini-cog utilizes a clock drawing test and a memory recall test of three words with clock drawing as a distracter. The Mini-Cog reportedly has high validity for detecting cognitive impairment in a community sample of ethnolinguistically diverse older adults and in a more homogeneous sample of adults.10
Primary Outcome measures
Pain Intensity and Pain Interference
Pain data were collected via the Wisconsin Brief Pain Inventory (BPI), which consists of 11 items that are rated from 0 to 10.16 Pain intensity (BPI-intensity) scores were obtained from the mean of four items, in which respondents rate their most severe pain, least severe pain, average pain over the past week, and current pain on an 11-point Likert scale ranging from 0 (no pain) to 10 (pain as bad as you can imagine). Pain interference (BPI-interference) scores were obtained from the seven BPI items that request participants to rate interference due to pain in activities such as mood, sleep, etc. on an 11-point Likert scale ranging from 0 (no interference) to 10 (complete interference). The BPI has adequate internal consistency (α =.85) in a variety of pain populations and concurrent validity with other pain instruments.16,81 In the current sample, the BPI-intensity and BPI-interference scales both had adequate internal consistency (α =.86 and α =.91, respectively).
Secondary Outcome Measures
Perceived Disability
The Roland-Morris Disability Scale-11 item version (RMDS) provided a self-assessment of limitations due to pain in physical activities, such as dressing, standing, bending, walking, and lifting.65 Participants endorse items that have been true over the past month, and a total score (ranging from 0 to 11) is obtained by summing the number of items endorsed. The 11-item version correlates well with scores on longer 18- and 24-item versions (r =.949 and r =.929 respectively) and has been shown to have adequate reliability that is comparable to the 24-item version (α=.88), and strong concurrent validity.65 Adequate internal consistency for the 11-item version was demonstrated in the current sample (α =.84).
Pain Catastrophizing
The Pain Catastrophizing Scale (PCS) was used to assess patient report of catastrophic thinking about pain.66 The 13-item measure asks respondents to rate, using a 5-point Likert scale ranging from 0 (not at all) to 4 (all the time), the degree to which they have certain thoughts and feelings when experiencing pain. A total score for overall catastrophizing is equal to the sum of the raw scores. Higher scores indicate greater use of catastrophic thinking. The PCS has exhibited strong internal consistency (α=.93), concurrent and discriminant validity, and high test-retest reliability over a 6 wk period (r = 0.78).54,66,76 Adequate internal consistency was found in the current sample (α =.94).
Depression
The Center for Epidemiological Studies Depression Scale (CES-D), which has been validated for use in chronic pain patients, was used to assess depression.72 The CES-D consists of 20 items; respondents rate the frequency with which each symptom or feeling occurred during the previous 7 days. Item content is rated on a 4-point scale ranging from 0 (rarely or less than one day) to 3 (most or all of the time, 5-7 days); total scores range from 0 to 60. Higher scores indicate greater depressive symptoms, and a score of greater than 19 is used to denote clinically relevant depressive symptoms.73 Reliability and validity are reported to be adequate and similar across a variety of samples from the general population.56 Internal consistency was found to be adequate in the current sample (α =.89).
Life Satisfaction
The Quality of Life Scale (QOLS) is a 7-point self-report scale that manifestly assesses life satisfaction in several areas.13 Total scores range from 7 to 49 with higher scores indicating greater satisfaction. The QOLS has been shown to correlate moderately with distress, and weakly with measures of functioning and pain intensity, indicating the QOLS is measuring a unique construct distinguished from pain and disability. A psychometric analysis of the QOLS showed it to be internally consistent, reliable across time, and representative of a single construct.13 In the present sample, adequate internal consistency of the QOLS was demonstrated (α =.86).
Measures to Assess Tolerability
Accuracy of Recall
Treatment receipt was assessed via weekly pre- and post-session process checks adapted from Thorn (2004) administered by group therapists at each weekly session.69 The pre-session process check was completed before each session (except session one) and asked the participant “What was the main point you got from last week’s group?” The post-session process check was completed by participants at the conclusion of each session, and consisted of one question asking “What was the main point you got from today’s group?” Responses were then quantified (0=Inaccurate and 1=Attempted with at least moderate accuracy) by a research assistant not involved in treatment delivery.
Homework Compliance and Accuracy
Evaluation of compliance and accuracy of participants’ homework assignments (for CBT group only) was used to determine treatment enactment ratings. A photocopy was made of all homework completed by participants at the beginning of the session subsequent to assignment of homework. Responses were numerically quantified by a research assistant not involved in treatment delivery (0=Unattempted, 1=Attempted but inaccurate, 2=At least one attempt with at least moderate accuracy, 3=At least two attempts with at least moderate accuracy, 4=At least three attempts with at least moderate accuracy, 5=At least four attempts with at least moderate accuracy).
Measures to Assess Acceptability
Treatment Credibility
Treatment credibility questions,9 adapted for use in research investigating psychological interventions for pain and other problems1,37,58 were also adapted for the current study as a treatment expectancy measure (TEM). At the beginning and end of Session 1, CBT and EDU participants rated on 0-10 scales (0=not at all, 10=extremely) (a) how logical the treatment seemed to them; (b) how confident they were that the treatment would decrease their pain; (c) how confident they were that the treatment would eliminate their pain; (d) how confident they would be in recommending the treatment to a friend/family member with similar problems; and (e) how important it is for them to receive pain relief. These ratings were averaged to create a single pre- and post-Session 1 treatment credibility score. Adequate internal consistency of the treatment credibility measure was demonstrated (α =.89).
Satisfaction with Treatment
Client satisfaction with treatment was measured with the Client Satisfaction Questionnaire-8 (CSQ-8).6 The CSQ-8 is an 8 item assessment of global satisfaction with a specific treatment. Participants responded on a 5-point Likert scale where 1 is representative of low satisfaction (i.e., quite dissatisfied, poor) and 4 indicates high satisfaction (i.e., very satisfied, excellent). The CSQ-8 has been used widely in primary medical care settings, mental health treatment settings, and human services settings.5 Client satisfaction has been positively correlated with treatment outcome. The 8-item version has been shown to perform as well or better than the 18-item parent version of the CSQ.6 Internal consistency of the CSQ-8 was found to be adequate in the current sample (α =.80).
Measures to Assess Treatment Fidelity
Therapist Adherence to Protocol
Adherence to the CBT manual was assessed in the current study via an adapted version of the Cognitive Therapy Adherence and Competence Scale (CTACS).7 A parallel version of this scale was developed to assess adherence to the EDU protocol. These scales provided a measure of both adherence to the specific treatment manual and potential contamination (e.g., an EDU therapist engaging in cognitive restructuring). Each session was digitally recorded and a random selection of 50% of all sessions conducted were rated using the adapted CTACS by a neutral coder (not associated with treatment delivery). Clinician adherence to either the CBT or EDU protocol was rated on the basis of a checklist of specified treatment components. A percentage score for each session rated (ranging from 0-100) was calculated to determine therapist adherence to the manual.
Randomization
Randomization was generated by consecutive coin toss by a graduate research assistant to assign participant numbers (starting at 101) to either CBT or EDU conditions. The assignment for each participant number was recorded on a slip of paper and concealed in an envelope. Participant numbers were assigned to participants prior to study enrollment. At completion of the pre-treatment interview, study staff opened the envelope and informed the participant of their assignment. At the midpoint of the study planned interim analyses were conducted to determine whether very large pre-post effect sizes existed for either condition (thus justifying termination of the trial). These analyses indicated a higher dropout rate in the CBT group. We thereafter implemented randomization with replacement in the CBT group such that randomization was weighted to allocate more participants to CBT.
Intervention protocol
The 10-week CBT and EDU group intervention protocols implemented in the current study were adapted respectively from Thorn (2004) and Ehde et al. (2005).23,69 The adaptations addressed the limited literacy of the sample, tailored the program to rural Alabama patients, and remained sensitive to any adjustments based on differences in income, race/ethnicity, and culture (see Kuhajda et al, 2011 for an overview of the adaptation process).41 Therapists in both conditions sought to maximize patient rapport with therapists, group cohesion, and group discussion related to the weekly topics. The duration of each weekly CBT and EDU session was 1.5 hours. Participants who missed a group meeting were given the opportunity for a 1-hour individual make up session; however, only 3 make-up sessions were permissible. Participants in both conditions were given a client manual with materials and handouts they could follow/discuss during sessions, and read between sessions.
CBT Intervention Description
All CBT sessions followed the same format: (1) pre-session process check; (2) review of previous week’s session; (3) homework review; (4) session treatment objectives; (5) worksheet; (6) assign homework; and (7) post-session process check. Homework assignments included instructions to think about and enact the assignments, and to write thoughts and reactions to them. A general outline of the objectives of each CBT session is as follows: Session 1) establish rapport, explain therapy rationale, goals, format and rules, introduce stress-appraisal-pain connection; Session 2) identification of negative automatic thoughts; Session 3) evaluate automatic thoughts for accuracy; Session 4) challenge distorted automatic thoughts, construct realistic alternative responses; Session 5) identify intermediate belief systems, challenge negative distorted beliefs, construct new beliefs; Session 6) identify core beliefs, challenge negative, distorted core beliefs, construct new, more adaptive beliefs; Session 7) relaxation exercise, positive coping self-statements; Session 8) expressive writing or verbal narration of expressive writing exercise; Session 9) assertive communication; and Session 10) review concepts and skills learned, provide feedback about helpful and challenging aspects of the treatment. All learning objectives were presented by the group leaders and interactive skills-building exercises and group discussion followed. For further details regarding session structure, see Thorn (2004).69
EDU Intervention Description
All EDU sessions followed the same format as the CBT sessions (described above); however, homework was not assigned and the education sessions did not include skills-building exercises related to any of the content. All learning objectives were presented by the group leaders and interactive group discussion followed. A general outline of the objectives of each EDU session includes: Session 1) establish rapport, explain therapy rationale, goals, format and rules, introduce concepts in chronic pain treatment; Session 2) Gate Control Theory of Pain, which emphasizes the importance of cognitions and affect in the experience of pain; Session 3) costs of chronic pain; Session 4) acute versus chronic pain; Session 5) sleep (i.e., normal sleep, sleep disorders, sleep hygiene); Session 6) depression and other mood changes associated with chronic pain; Session 7) pain behaviors; Session 8) pain and communication (i.e., assertive, aggressive, and passive communication styles); Session 9) working with health care providers; Session 10) stages of change, review concepts learned, provide feedback about helpful and challenging aspects of the treatment. See Ehde et al. (2005) for further details pertaining to the structure of the EDU protocol.23
Procedure
Participants who satisfied initial entry criteria (as determined via an initial telephone screen) and were interested in potentially participating were scheduled for a 90-minute, face-to-face pre-treatment assessment during which written informed consent was obtained and the structured pain interview, demographics questionnaire, and all outcome measures were administered. During the informed consent procedure, participants were told that they would be randomly assigned to one of two treatments, which were thusly described: One treatment (CBT) focuses on thoughts and feelings in response to pain and stress, and helping participants learn how to manage their thoughts and feelings might improve pain coping. The other treatment (EDU) focuses on learning facts about the body and pain, and helping participants learn these facts might improve pain coping. At completion of this interview, interested and eligible participants were informed of their group assignment. Treatment was then implemented while participants continued with their customary medical care. After completing treatment, participants were scheduled for 60-minute, post-treatment and 6-month follow-up assessments. All assessments were completed in person, face-to-face by a research assistant not involved in treatment delivery. The interviewer was not blind to subject treatment group assignment. Participants were reimbursed $25 for each assessment completed. For all assessments, the study investigator read all items to each participant and recorded participant responses, with the exception of the reading assessment. Whenever terminology was not understood by the participant, the interviewer offered synonyms to clarify meaning. This interview procedure was implemented because the current population has predominantly low literacy levels, and the previously validated self-report measures used in the current research are written at a reading grade level ranging between 3.3-12.7 (as assessed by Flesh-Kinkaid Grade Level estimates). The WRAT-4 reading/word decoding subtest was administered using standard procedures.
Statistical Analyses
Missing data were imputed using the multiple imputation algorithm from PRELIS 2.54.36 The scores that were missing on a few items (< 0.2%) from otherwise completed scales were replaced by imputed values before summing to obtain total scores, and these item values were used in computation of internal consistency reliabilities (α coefficients). Total pre-treatment RMDS scores were imputed for four cases with completely missing RMDS data, and the RMDS α coefficient was computed from the 105 cases with complete data.
Determining the feasibility, tolerability, and acceptability of psychosocial chronic pain treatment for low literacy rural participants was one aim of this study. Feasibility was determined by calculation of the ratio of eligible participants recruited to the number of participants commencing treatment. The characteristics associated with the people who met eligibility requirements (but did not attend a single session) were compared to the ITT sample (people who attended at least 1 session) on pre-treatment measures. Tolerability was addressed by assessing completion rates; participants failing to complete all 10-sessions were considered treatment dropouts. Premature termination of treatment may reflect obstacles encountered by participants, and analyses were therefore aimed at characterizing factors associated with dropout. Patient acceptability was assessed by treatment credibility ratings and patient satisfaction with treatment. To assess these relationships, χ2 analyses were used for frequency data, and ANOVAs – with Completer vs Dropout as between-subjects factor – were used for continuous variables.
Analyses assessing whether the CBT and EDU treatments affected pre- to post-treatment changes, and to determine comparative efficacy of the two treatments were conducted for the ITT sample (N=83) and for those who completed all 10 sessions (n=61). Mixed design ANOVAs were used with Treatment Group (CBT; EDU) as the between-subject factor and Period (pre-treatment; post-treatment) as the within-subject factor. For participants attending the 6-month follow-up visit, additional mixed design ANOVAs were used to test Treatment Group (CBT; EDU) x Period (pre-treatment; post-treatment, 6-month follow-up) effects.
Results
Feasibility
Twenty-four percent (n= 26) of the people who met eligibility requirements (n = 109) did not attend a single session. Analyses were conducted to determine whether pre-treatment factors were associated with this phenomenon. The 26 people who did not attend any sessions differed from the 83 people who did (i.e., the ITT sample) on years of education (M=11.4, SD=2.6; M=12.7, SD=2.2; respectively) [F(1,107) = 6.97; p < .02; η2 = .062], WRAT percentile (M=10.7, SD=10.9; M=19.8, SD=22.3; respectively) [F(1,107) = 4.06; p < .05; η2 = .037] and on pre-treatment PCS (M=38.9, SD=10.6; M=30.3, SD=15.5; respectively) [F(1,107) = 6.95; p < .01; η2 = .061]. These groups did not differ significantly on age, on miles traveled to reach session sites, or on pre-treatment BPI-pain, BPI-interference, CESD, RMDS, or QOL. Thus, relatively fewer years of education, lower reading ability, and higher pain catastrophizing score distinguished people who did not attend sessions from those who did. See Table 1 for baseline sociodemographic characteristics of the ITT sample. See Table 2 for outcomes for participants in CBT versus EDU.
Table 1.
Baseline sociodemographic characteristics of study participants (ITT sample)
| Characteristic | CBT (n=49) | EDU (n=34) | p |
|---|---|---|---|
| Age, mean (SD), years | 50.2 (12.3) | 55.4 (14.0) | < .08 |
| Sex, % | |||
| Male | 28.6 | 11.8 | < .07 |
| Female | 71.4 | 88.2 | |
| Race, % | |||
| White-American | 26.5 | 14.7 | > .10 |
| African-American | 73.5 | 85.3 | |
| Disability Status, % | |||
| On disability | 41.7 | 44.1 | >.10 |
| Seeking disability | 27.1 | 8.8 | |
| Not on, not seeking | 31.3 | 47.1 | |
| Income, % | |||
| $0 to $12,999 | 65.3 | 76.5 | > .10 |
| $13,000 to $24,999 | 20.4 | 8.8 | |
| $25,000 to $49,000 | 12.2 | 14.7 | |
| $50,000 & above | 2.0 | 0.0 | |
| Employment Status, % | |||
| Employed | 18.4 | 9.1 | > .10 |
| Unemployed | 59.2 | 54.5 | |
| Retired | 18.4 | 33.3 | |
| Home-maker | 4.1 | 3.0 | |
| Education, mean (SD), years | 12.6 (2.4) | 12.9 (2.0) | > .10 |
| WRAT1, mean (SD), %tile | 22.1 (23.8) | 16.5(19.7) | > .10 |
| Primary Pain Duration, mean (SD), years | 20.6 (16.4) | 19.5 (17.8) | > .10 |
| Primary Pain Type, % | |||
| Low back pain | 51.1 | 35.3 | > .10 |
| Arthritis | 40.8 | 23.5 | |
| Headache | 4.0 | 5.8 | |
| Pelvic pain | 0.0 | 5.9 | |
| Other (e.g., neck pain, sickle cell, TMJ) | 4.1 | 30.5 |
Wide Range Achievement Test-4, primary literacy measure
Table 2.
Outcomes for participants in CBT versus EDU
| Measure/Time | CBT1 | EDU2 |
|---|---|---|
| PCS3, mean (SD) | ||
| Baseline | 32.3 (15.7) | 26.0 (16.8) |
| Post | 23.5 (13.1) | 24.1 (14.7) |
| 6 months Post | 23.7 (13.4) | 24.7 (15.1) |
| CES-D4, mean (SD) | ||
| Baseline | 21.6 (14.6) | 16.3 (11.5) |
| Post | 17.6 (12.1) | 17.0 (10.0) |
| 6 months Post | 17.2 (11.1) | 16.8 (9.7) |
| BPI5-Intensity, mean (SD) | ||
| Baseline | 6.2 (2.3) | 5.8 (2.2) |
| Post | 5.3 (2.4) | 4.6 (2.3) |
| 6 months Post | 5.0 (2.4) | 4.6 (2.1) |
| BPI-Interference, mean (SD) | ||
| Baseline | 5.8 (2.8) | 5.6 (2.4) |
| Post | 4.4 (2.6) | 3.9 (2.3) |
| 6 months Post | 5.1 (2.3) | 4.3 (2.3) |
| RMDS6, mean (SD) | ||
| Baseline | 8.9 (2.5) | 8.4 (3.2) |
| Post | 8.4 (2.8) | 8.6 (3.4) |
| 6 months Post | 8.2 (3.3) | 9.8 (9.8) |
| QOLS7, mean (SD) | ||
| Baseline | 30.3 (9.9) | 31.5 (11.5) |
| Post | 33.4 (10.3) | 32.3 (8.9) |
| 6 months Post | 32.0 (9.9) | 33.7 (9.0) |
| TEM8, mean (SD) | 7.8 (1.6) | 7.4 (1.5) |
| CTACS9, mean (SD) | 98.0 (2.0) | 98.8 (1.7) |
| CSQ10, mean (SD) | 30.4 (1.9) | 29.8 (2.4) |
For CBT baseline and post data, n=32; for 6 months post data, n=28
For EDU baseline and post data, n=29; for 6 months post data, n=26
The Pain Catastrophizing Scale
The Center for Epidemiological Studies Depression Scale
The Brief Pain Inventory
The Roland-Morris Disability Scale-11
Quality of Life Scale
Treatment Expectancy Measure
Adapted version of the Cognitive Therapy Adherence and Competence Scale
Client Satisfaction Questionnaire
Tolerability
The overall dropout rate (i.e., percentage of participants failing to complete all 10-sessions) was 26.5% (n = 22). Analyses were conducted to determine whether pre-treatment factors were associated with dropout. The 22 people who dropped out differed significantly from the 61 people who completed 10 sessions on income (dropout participants’ mean income was below $13,000 annually, whereas completers’ mean income was above $13,000 annually) [F(1,83) = 9.48; p < .01; η2 = .105] and years of education (M=11.8, SD=2.4; M=13.1, SD=2.1; respectively) [F(1,83) = 5.90; p < .02; η2 = .069]. These groups did not differ significantly on age, WRAT percentile, on miles traveled to reach session sites, or on pre-treatment BPI-pain, BPI-interference, CESD, RMDS, QOL or PCS scores. Thus, relatively low income and fewer years of education distinguished people who dropped out from those who completed treatment.
Further analyses focused on the possible differences dropouts may have shown in retaining CBT and EDU session material for the sessions they did attend. The Dropout effect was significant for pre-session accuracy of recall of the previous session’s material [F(1,75) = 18.19; p < .01; η2 = .195], indicating that participants who eventually dropped out recalled prior session material less accurately than those who completed treatment. A significant Dropout effect emerged for post-session accuracy of recall of the session material as well [F(1,80) = 44.66; p < .01; η2 = .358], indicating that participants who eventually dropped out had significantly lower post-session recall scores than those who completed treatment. Inter-session homework was assigned for participants in the CBT condition. Those who dropped out had significantly poorer performance than those who completed treatment [F(1,44) = 4.38; p < .05; η2 = .090]. Thus, participants who may have found treatment less tolerable than others (i.e., those who eventually dropped out) recalled session material less accurately than those who completed treatment, and, for those assigned homework in CBT, dropouts performed more poorly on this than those who completed treatment.
A Treatment Group x Dropout contingency test was significant [X2 (1, n =83) = 4.12; p < .04]. The dropout rate was 34.7% (17/49) in CBT, whereas this rate was 14.7% (5/34) in the EDU group. Thus, CBT may have appeared less tolerable for participants than EDU. Further analyses to examine Treatment Group x Dropout interactions on other factors (e.g., age) were not performed due to low cell sizes among the dropout group.
Acceptability
Additional analyses indicated that CBT vs EDU group differences on treatment credibility ratings (TEM), and satisfaction with treatment (CSQ-8) ratings were nonsignificant [F’s (1,59) < 1.76; p’s>.10 ; η2 ‘s < .020]. Thus, participants found the two treatments equally credible and satisfactory (see Table 2).
Treatment Delivery
Analysis of treatment implementation (CTACS) ratings across CBT and EDU therapists indicated that cross-contamination of treatments did not occur as therapists for both conditions scored high on adherence to the manual ratings (see Table 2). CBT and EDU therapist adherence scores were not significantly different [F’s (1,59) < 3.53; p’s > .06 ; η2’s < .056].
CBT vs EDU Differences in Pre-Treatment Outcome Measures for Intent-to-Treat Sample (N=83)
The CBT and EDU groups were compared to assess any differences in pre-treatment outcome values. ANOVAs indicated that the group differences on BPI-intensity, BPI-interference, RMDS, QOL and PCS scores were nonsignificant [F’s(1,81) < 3.41; p’s >.07; η2 ’s <.040]. However, for pre-treatment CES-D scores, the difference was significant [F(1,81) = 4.92; p < .05; η2 <.057], indicating that the CBT participants reported greater depression than the EDU participants (see Table 2).
Pre-Treatment to Post-Treatment Changes in Outcome Measures for Intent-to-Treat Sample (N=83)
A series of mixed design ANOVAs were performed for the outcome measures. These were Treatment Group (CBT; EDU) x Period (Pre-treatment; Post-treatment) analyses. See Table 2 for means and SDs.
For BPI-intensity, BPI-interference, RMDS, QOL, and PCS measures, the Treatment Group x Period interactions were nonsignificant [F’s (1,81) < 2.39; p’s > .10 ; η2 ’s < .029]. However, most Period effects were significant [F’s (1,81) > 5.80; p’s < .05; η2 ’s > .067] in directions indicating that participants improved on all indexes. The exception was RMDS values, for which the Period effect was nonsignificant [F<1].
For CES-D, the interaction did not reach conventional levels of significance [F(1,81) = 3.43; p = .07; η2 = .041], but simple effects tests were performed. For the CBT group, the Period effect was significant [F(1,48) = 5.58; p < .05; η2 = .104], whereas the effect for the EDU group was not [F<1]. Results hint that depressive symptom severity decreased significantly among people participating in CBT, but not for those in EDU.
Pre-Treatment to Post-Treatment Changes in Outcome Measures for Completer Sample (N=61)
The ANOVAs described above were repeated for the 61 participants who completed all 10 sessions. For BPI-intensity, BPI-interference, RMDS, and QOL measures, the Treatment Group x Period interactions were nonsignificant [F’s (1,59) < 2.67; p’s > .10 ; η2 ’s < .043]. However, the Period effects were significant for BPI-pain, BPI-interference and QOL [F’s (1,59) > 7.08; p’s < .05; η2 ’s > .107] in directions indicating that participants improved on these indexes. For RMDS values, the Period effect was again nonsignificant [F<1].
For CES-D and PCS values, the Treatment Group x Period interactions were significant [F’s (1,59) > 4.02; p’s < .05; η2 ’s > .064]. Simple effects tests were performed. For the CBT group, the Period effects for CES-D and PCS were both significant [F’s (1,31) > 5.88; p’s < .05; η2 ’s > .159], whereas the effects for the EDU group were not [F’s<1]. Results suggested that for participants who completed all 10 sessions of treatment, both depressed mood and pain catastrophizing decreased significantly among people participating in the CBT condition, which was not the case for people participating in EDU. Effect sizes for differences between CBT and EDU were medium for both depressed mood (d =.527) and catastrophizing (d = .517).
These significant interactions imply that the CBT and EDU groups differed on post-treatment depressive symptoms and catastrophizing. To examine this we conducted ANCOVAs on post-treatment CES-D and PCS values with pre-treatment CES-D and PCS values controlled to determine whether the CBT and EDU groups differed significantly on post-treatment values adjusted for pre-treatment values. For CES-D scores, the effect of treatment group on post-treatment scores was nonsignificant [F(1,58) = 1.92; p > .10; η2 = .032]. For PCS scores, the effect of treatment group on post-treatment scores was also nonsignificant [F(1,58) = 1.84; p > .10; η2 = .031]. Because the CBT and EDU groups did not differ significantly on post-treatment values, there was no need to further control for pre-treatment differences between groups on factors that may have accounted for significant group differences on outcomes.
Six Month Follow-up for Completer Sample (N=54)
Fifty-four of the 61 participants who completed all 10 sessions completed questionnaire measures at 6-month follow-up. ANOVAs were repeated with the addition of the 6-month time point. For BPI-intensity, BPI-interference, RMDS, and QOL, the Treatment Group x Period (pre-treatment, post-treatment, 6-month) interactions were nonsignificant [F’s (2,104) < 1.79; p’s > .10 ; η2 ’s < .033]. Period effects were again significant for BPI-intensity, and BPI-interference [F’s (2,104) > 9.64; p’s < .05; η2 ’s > .156]. Additional analyses showed that the post-treatment to 6-month Period effects were nonsignificant for BPI-intensity and BPI-interference [F’s (1,52) < 1.70; p’s > .10; η2 ’s < .033], suggesting that pre-treatment to post-treatment gains were maintained on these indexes irrespective of treatment group. For QOL, the overall Period effect did not reach conventional levels of significance [F (2,104) = 2.92; p < .06; η2 = .053], which was accompanied by a nonsignificant post-treatment to 6-month Period effect [F < 1]. For RMDS, the overall Period effect was nonsignificant [F < 1].
For CES-D and PCS values, the Treatment Group x Period interactions were again significant [F’s (2,104) > 3.20; p’s < .05; η2 ’s > .058]. Simple effects tests focused on post-treatment to 6-month Period effects for each treatment group. For the CBT group, the Period effects for CES-D and PCS were both nonsignificant [F’s < 1], as were the effects for the EDU group [F’s<1]. Results suggested that the source of the Treatment Group x Period interactions were due to the pre-treatment to post-treatment simple effects described above. Additionally, results suggest that the significant pre-treatment to post-treatment gains in depressed mood and pain catastrophizing made by the CBT participants were maintained out to 6-month follow-up. For the EDU group, significant changes in depressed mood and catastrophizing were not shown across any study epochs. The between-group effect size at follow-up was again medium for both depressed mood (d =.49) and catastrophizing (d = .54), favoring CBT.
Because the source of the interactions for CES-D and PCS scores was located in the pre-treatment to post-treatment epoch, ANCOVAs controlling for pre-treatment CES-D and PCS scores would duplicate the analyses reported above.
Clinically significant change on outcome measures for completer sample (N=61)
The number of participants deemed clinically improved between pre- and post-treatment was calculated on the basis of change scores. Those participants with a 50% or greater improvement in the outcome variables were considered treatment “responders,” those with a 25% to 49% change were considered “moderate responders” or “somewhat” improved, and those exhibiting less than 25% change were considered treatment “non-responders” or “not improved.” Among the total sample of treatment completers, CES-D score decreased by ≥50% for eight (13.1%) participants and decreased by 25-49% for fifteen (24.6%) participants; thirty-eight (62.3%) participants were considered non-responders. Given the significant Treatment Group x Period interaction in regards to depression, we examined clinical significance of CES-D treatment changes by group. For CBT, six treatment completers (18.8%) showed decreases of ≥50%, and seven (21.9%) participants showed decreases between 25-49%; nineteen (59.4%) participants were non-responsive to CBT. Whereas for EDU, two participants (6.9%) reported decreases of ≥50%, and eight (27.6%) reported decreases of 25-49%; nineteen (65.5%) participants were not improved at the conclusion of the EDU intervention. The number of participants considered at least moderate responders (>/=25-49%) was not significantly different between CBT and EDU (χ2 = .244, p = .41).
For PCS values, among the total sample of treatment completers, a decrease of ≥50% was reported for twelve (19.7%) participants, and a decrease of 25-49% was reported for ten (16.4%) participants; thirty-nine (63.9%) participants were considered non-responders. The Treatment Group x Period interaction for PCS was significant; therefore we examined clinical significance of PCS treatment changes by group. For CBT, nine (28.1%) participants showed decreases of ≥50% and six (18.8%) participants showed decreases between 25-49%; seventeen (53.1%) CBT participants were non-responsive. In EDU, three (10.3%) participants reported decreases of ≥50%, and four (13.8%) reported a 25-49% decrease; twenty-two (75.9%) participants were not improved at the conclusion of EDU. The number of participants considered at least moderate responders approached being significantly different between CBT and EDU (χ2 =3.41, p = .056).
For all other outcome measures, the Treatment Group x Period interactions were non-significant; thus, clinical significance data is reported for the total completer sample only and is not broken down by group. On BPI-intensity, decreases of ≥50% and 25-49% were shown for ten (16.4%) and eleven (18.0%) treatment completers respectively; forty (65.6%) participants were classified as non-responders. BPI-interference score decreases of ≥50% were shown for nineteen (31.1%) participants, and decreases of 25-49% were shown for eleven (18.0%) participants; thirty-one (50.8%) participants were non-responders. On the QOL, none of the treatment completers achieved a ≥50% increase; however, nine (14.8%) participants showed a 25-49% increase; fifty-two (85.2%) participants were not improved on QOL. Decreases of ≥50% on RMDS score were reported for six (9.8%) participants, and decreases of 25-49% were shown for 2 (3.3%) treatment completers; fifty-three (86.9%) participants were considered not clinically improved on RMDS score at post-treatment.
Discussion
Although research supports the efficacy of biopsychosocial treatment approaches for pain28,50,71, few trials (if any) have explored their potential in primarily African-American, low-SES, low literacy populations. This study examined the feasibility, tolerability and efficacy of CBT compared to pain education within a rural Alabama chronic pain population. Rural location captured a triple disparity in that participants were predominantly African-American, low-SES, and had low literacy levels.27,31,34
Compared to past RCT literature, the percentage of participants in the current study who were assessed for eligibility and subsequently began treatment was relatively high.e.g.,70,75 A key factor associated with this ratio may be that medical staff were strongly supportive of the study, and actively encouraged their patients to participate. Since healthcare providers are viewed as highly credible sources by patients,38 this may have increased patients’ willingness to participate. Still, a number of patients failed to attend even one session and this was significantly predicted by fewer years of education, lower literacy, and higher catastrophizing. Individuals with low education and low literacy may be more susceptible to the common misconception that biomedical cures are the only viable option, and thus less likely to recognize the potential benefits of psychosocial treatment. Catastrophic thinking may be associated with the attribution that “nothing will help.” Such individuals may particularly benefit from a discussion with their primary care physician about the advantages of a psychosocial approach.
Identification of individual risk factors for early termination within the underserved sample targeted in the current study may have especially important implications for reducing treatment disparities. In the overall sample, income uniquely predicted treatment completion. This finding may be best understood in the context of previous research that suggests individuals at the lowest end of the income gradient report a greater number of chronic, intractable daily circumstances typically judged as “stressful” and report higher levels of psychological distress.15,59
The dropout rate was significantly greater in CBT than EDU. Although the treatment approaches utilized in the current research were simplified and the reading grade level of the materials reduced, it is possible the cognitive load of the CBT protocol was still too high and further adaptations (i.e., possibly a stronger emphasis on behaviorally oriented techniques) may be necessary. In support of this contention were the data showing a tendency for CBT dropouts to have less accurate completion of homework than treatment completers. It may be that the traditional “column technique” paper and pencil cognitive therapy homework was too challenging for this predominantly low literacy population and posed a unique barrier to completing the CBT program. It is interesting to note that retention of previous session material was a predictor of dropout. Those participants who perceived themselves as not learning anything of substance may have also perceived that they were not benefitting from treatment. Hence, they dropped out. Other factors not measured (e.g., major stressors) may have also contributed.
In terms of examining treatment efficacy, participants who completed either treatment reported significant, albeit small, short- and long-term improvements in pain intensity and interference due to pain. These findings, including the small effect sizes, are consistent with previous research.4,12,21,22,38,42,50,55,74,79 The findings regarding clinical significance suggested most treatment completers did not experience large (>50%) reductions in pain intensity or perceived disability, although almost half of the treatment completers showed at least moderate reductions in pain interference. It is interesting to note that data from qualitative interviews obtained at post-treatment corroborated the quantitative findings: while treatment completers noted they still had pain, as a function of treatment, they were better able to accept their pain and not let it get in the way of living their lives as much.17 Overall, these findings suggest that in regards to this subset of pain-related outcome variables, an educational intervention was as effective as CBT. Given this population had predominantly low educational attainment, it seems that (as expected) providing factual information allowed these patients to better understand their condition, which in turn possibly led to the aforementioned treatment gains.
Both depressive symptom severity and catastrophizing decreased significantly among CBT treatment completers and these effects were maintained at long-term follow-up. No changes pertaining to these variables were shown for EDU participants across any study epochs. In terms of the clinical significance of these findings, more CBT than EDU participants were at least moderate treatment responders across cognitive and affective domains, and these differences approached significance for catastrophizing scores. Thus, the data suggest that the theoretical underpinning of the cognitively focused CBT protocol instigated unique cognitive change in terms of catastrophizing. This finding holds substantial clinical importance given the wealth of evidence across numerous chronic pain conditions that indicates catastrophizing is predictive of intensification of pain and a multitude of other poor pain-related outcomes.26,30,33,39,46,67,68 Since baseline CES-D scores were higher for CBT than EDU participants, it remains unclear whether the significant decrease in depressive symptoms shown by the CBT group but not by the EDU group represents a regression to the mean. However, Litt and colleagues found that a CBT intervention conferred the most treatment gains to those individuals who reported lower baseline levels of emotional distress.44 Thus, regression to the mean is not the only plausible explanation for the positive outcomes observed in the current study for CBT participants.
Overall, both psychosocial interventions were found to comparably elicit statistically and clinically significant improvement on most of the pain-related outcome variables. Important exceptions were that only CBT resulted in significant improvements in depressive symptoms and catastrophizing. Nevertheless, post-treatment scores did not significantly differ between CBT and EDU with pre-treatment differences controlled. That both interventions instigated meaningful clinical changes is further supported by participants’ reported satisfaction with the treatment programs. The relatively few differences in outcome shown between CBT and EDU are consistent with findings of previous research that has found few specific treatment effects when two active treatments are compared.22 The CBT and EDU protocols used in the current research both targeted the role of cognitions and affect in the experience of pain; the central difference between the two approaches was that CBT participants also engaged in specific skills building exercises. It is possible the addition of these skills building exercises resulted in the significantly greater treatment gains that CBT conferred in the cognitive and affective realm.
Limitations
The current sample size was underpowered to identify the small effect size group differences typically found in trials comparing CBT to active treatments.22 Recruitment was limited due to the reduced availability of participants. It is likely this reduced availability is associated with the wide geographic spread of individuals living within the rural localities in which this study was conducted.
The relatively high dropout rate compared to previous RCTs of CBT conducted within urban settings featuring primarily White-American, middle- to high-SES populations is an additional limitation.e.g.,19,20,70,75 Further compounding this issue was that a higher dropout rate differentially occurred in CBT, which necessitated more participants to be randomized to CBT. This method reduces the integrity of the randomization process. Accessibility barriers specific to the rural setting (e.g., travel distance, lack of public transportation) may have reduced participants’ ability to commit to the full 10-weeks of treatment. However, most psychotherapy clients drop out of therapy having attended fewer than six sessions.62 Given the present RCT was community-based, it may be the results found were more similar to those obtained in such non-research settings. Clearly, the current findings are more representative of low-SES, minority individuals and may not generalize to higher-SES, non-minority populations.
A further limitation is that insight into the specificity of the various CBT and EDU treatment elements and observed treatment effects cannot be fully elucidated from the current research design. While qualitative analyses were conducted and provided critical information in this regard,17 future research investigating the specific and nonspecific factors of therapy is needed to determine the necessary and sufficient components of treatment. A more sophisticated RCT with weekly assessments and a third condition (such as an attention or wait list control) is needed to fully elucidate the effects found in the current research.
Conclusion
This community-based RCT found that adapted, culturally sensitive psychosocial interventions for chronic pain represent viable treatment options within underserved, low-SES, minority chronic pain populations. Pervasive disparities speak to the need to strike a balance between efficacy and practicality of treatment approaches within special populations. While both the CBT and EDU approach were associated with short-and long-term improvements on pain-related outcomes, the cognitively-focused CBT protocol resulted in unique cognitive and affective changes. Still, a higher dropout rate occurred in CBT, suggesting further adaptations may be necessary to reduce the cognitive load of the treatment protocol. Given this initial support, and that group psychosocial treatments for chronic pain have been found to be cost-effective relative to surgery and medication,22 further adaptations to enhance tolerability of psychosocial treatments within underserved populations should be explored. Such further investigation is imperative as not only do psychosocial interventions reduce pain and interference due to pain, but also because they have the potential to target the emotional and cognitive concomitants of pain that lead to unnecessary suffering.
Acknowledgments
This research was supported by the National Institute of Nursing Research and the National Institute of Mental Health, NR010112. The authors thank all of the patients and medical staff that made this research possible. The authors would also like to acknowledge Shweta Kapoor and Dana McDonald for their earlier contributions to this research project.
Footnotes
The authors have no conflicts of interest to report.
Publisher's Disclaimer: This is a PDF file of an unedited manuscript that has been accepted for publication. As a service to our customers we are providing this early version of the manuscript. The manuscript will undergo copyediting, typesetting, and review of the resulting proof before it is published in its final citable form. Please note that during the production process errors may be discovered which could affect the content, and all legal disclaimers that apply to the journal pertain.
References
- 1.Addis ME, Hatgis C, Bourne L, Krasnow AD, Jacob K, Mansfield A. Effectiveness of cognitive-behavioral treatment for panic disorder versus treatment as usual in a managed care setting. Journal of Consulting and Clinical Psychology. 2004;72:625–635. doi: 10.1037/0022-006X.72.4.625. [DOI] [PubMed] [Google Scholar]
- 2.All AC, Fried JH, Wallace DC. Quality of life, chronic pain, and issues for health care professionals in rural communities. Online Journal of Rural Nursing and Health Care. 2000;1:19–34. [Google Scholar]
- 3.American Chronic Pain Association (ACPA) Partners for understanding pain. 2005 http://www.theacpa.org/pu_main_03.asp. retrieved December 7, 2005.
- 4.Astin JA, Beckner W, Soeken K, Hochberg MC, Berman B. Psychological interventions for rheumatoid arthritis: a metaanalysis of randomized controlled trials. Arthritis & Rheumatism. 2002;47:291–302. doi: 10.1002/art.10416. [DOI] [PubMed] [Google Scholar]
- 5.Attkisson C, Greenfield T. Instruments for Adults. Lawrence Erlbaum Associates Publishers; 2004. The UCSF Client Satisfaction Scales: The Client Satisfaction Scale-8. [Google Scholar]
- 6.Attkisson CC, Zwick R. The Client Satisfaction Questionnaire: Psychometric properties and correlations with service utilization and psychotherapy outcome. Eval Program Plann. 1982;5:233–237. doi: 10.1016/0149-7189(82)90074-x. [DOI] [PubMed] [Google Scholar]
- 7.Barber JP, Liese BS, Abrams MJ. Development of the cognitive therapy adherence and competence scale. Psychotherapy Research. 2003;13:205–221. [Google Scholar]
- 8.Blanchard EB, Andrasik F. Management of chronic headaches: A psychological approach. Elmsford, NY US: Pergamon Press; 1985. [Google Scholar]
- 9.Borkovec TD, Nau SD. Credibility of analogue therapy rationales. J Behav Ther Exp Psychiatry. 1972;3:257–260. [Google Scholar]
- 10.Borson S, Brush M. The Mini-Cog: A cognitive ‘vital signs’ measure for dementia screening in multi-lingual elderly. International Journal of Geriatric Psychiatry. 2000;15:1021–1027. doi: 10.1002/1099-1166(200011)15:11<1021::aid-gps234>3.0.co;2-6. [DOI] [PubMed] [Google Scholar]
- 11.Burton AK, Waddell G, Tillotson KM, Summerton N. Information and Advice to Patients With Back Pain Can Have a Positive Effect: A Randomized Controlled Trial of a Novel Educational Booklet in Primary Care. Spine. 1999;24:2484. doi: 10.1097/00007632-199912010-00010. [DOI] [PubMed] [Google Scholar]
- 12.Chen E, Cole SW, Kato PM. A review of empirically supported psychosocial interventions for pain and adherence outcomes in sickle cell disease. Journal of Pediatric Psychology. 2004;29:197–209. doi: 10.1093/jpepsy/jsh021. [DOI] [PubMed] [Google Scholar]
- 13.Chibnall JT, Tait RC. The Quality of Life Scale: A preliminary study with chronic pain patients. Psychology & Health. 1990;4:283–292. [Google Scholar]
- 14.Chibnall JT, Tait RC, Andresen EM, Hadler NM. Race and socioeconomic differences in post-settlement outcomes for African American and Caucasian Workers’ Compensation claimants with low back injuries. Pain. 2005;114:462–472. doi: 10.1016/j.pain.2005.01.011. [DOI] [PubMed] [Google Scholar]
- 15.Cockerham WC. A test of the relationship between race, socioeconomic status, and psychological distress. Soc Sci Med. 1990;31:1321–1326. doi: 10.1016/0277-9536(90)90071-y. [DOI] [PubMed] [Google Scholar]
- 16.Daut RL, Cleeland CS, Flanrey RC. Development of the Wisconsin Brief Pain Questionnaire to assess pain in cancer and other disease. Pain. 1983;17:197–210. doi: 10.1016/0304-3959(83)90143-4. [DOI] [PubMed] [Google Scholar]
- 17.Day M, Thorn BE, Kapoor S. A qualitative analysis of a randomized controlled trial comparing a cognitive-behavioral treatment with education. J Pain. doi: 10.1016/j.jpain.2011.02.354. In press. [DOI] [PMC free article] [PubMed] [Google Scholar]
- 18.Day MA, Thorn BE. The relationship of demographic and psychosocial variables to pain-related outcomes in a rural chronic pain population. Pain. 2010;151:467–474. doi: 10.1016/j.pain.2010.08.015. [DOI] [PMC free article] [PubMed] [Google Scholar]
- 19.Dworkin SF, Turner JA, Mancl L, Wilson L, Massoth D, Huggins KH, Leresche L, Truelove E. A randomized clinical trial of a tailored comprehensive care treatment program for temporomandibular disorders. J Orofac Pain. 2002;16:259–76. [PubMed] [Google Scholar]
- 20.Dworkin SF, Turner JA, Wilson L, Massoth D, Whitney C, Huggins KH, Burgess J, Sommers E, Truelove E. Brief group cognitive-behavioral intervention for temporomandibular disorders. Pain. 1994;59:175–87. doi: 10.1016/0304-3959(94)90070-1. [DOI] [PubMed] [Google Scholar]
- 21.Eccleston C, Morley S, Williams AC, Yorke L, Mastroyannopoulou K. Systematic review of randomized controlled trials of psychological therapy for chronic pain in children and adolescents, with a subset meta-analysis of pain relief. Pain. 2002;99:157–165. doi: 10.1016/s0304-3959(02)00072-6. [DOI] [PubMed] [Google Scholar]
- 22.Eccleston C, Palermo TM, Williams ACD, Lewandowski A, Morley S. Psychological therapies for the management of chronic and recurrent pain in children and adolescents. Cochrane Database of Systematic Reviews. 2009 doi: 10.1002/14651858.CD003968.pub2. [DOI] [PubMed] [Google Scholar]
- 23.Ehde D, Jensen M, Engel J, Hanley M, Raichle K, Osborne T. Education Intervention Therapist Manual: Project II: Role of Catastrophizing in Chronic Pain 2005 [Google Scholar]
- 24.Ehde DM, Jensen MP. Feasibility of a cognitive restructuring intervention for treatment of chronic pain in persons with disabilities. Rehabilitation Psychology. 2004;49:254–258. [Google Scholar]
- 25.Faul F, Erdfelder E, Lang AG, Buchner A. G*Power: A flexible statistical power analysis program for the social, behavioral, and biomedical sciences. Behavior Research Methods. 2007;39:175–191. doi: 10.3758/bf03193146. [DOI] [PubMed] [Google Scholar]
- 26.Flor H, Behle DJ, Birbaumer N. Assessment of pain-related cognitions in chronic pain patients. Behav Res Ther. 1993;31:63–73. doi: 10.1016/0005-7967(93)90044-u. [DOI] [PubMed] [Google Scholar]
- 27.Flynt W. Rural poverty in America. Natl Forum. 1996;76(3):32–35. [Google Scholar]
- 28.Fordyce WE, Fowler RS, Lehmann JF, Delateur BJ, Sand PL, Trieschmann RB. Operant conditioning in the treatment of chronic pain. Arch Phys Med Rehabil. 1973;54:399–408. [PubMed] [Google Scholar]
- 29.Gallo L, Matthews K. Understanding the association between socioeconomic status and physical health: Do negative emotions play a role? Psychological Bulletin. 2003;129:10–51. doi: 10.1037/0033-2909.129.1.10. [DOI] [PubMed] [Google Scholar]
- 30.Geisser ME, Robinson ME, Keefe FJ, Weiner ML. Catastrophizing, depression and the sensory, affective and evaluative aspects of chronic pain. Pain. 1994;59:79–83. doi: 10.1016/0304-3959(94)90050-7. [DOI] [PubMed] [Google Scholar]
- 31.Hoffman P, Meier B, Council JR. A comparison of chronic pain between an urban and rural population. J Community Health Nurs. 2002;19:213–224. doi: 10.1207/S15327655JCHN1904_02. [DOI] [PubMed] [Google Scholar]
- 32.Jackson RH, Davis TC, Bairnsfather LE, George RB, Crouch MA, Gault H. Patient reading ability: An overlooked problem in health care. South Med J. 1991;84:1172–1175. doi: 10.1097/00007611-199110000-00004. [DOI] [PubMed] [Google Scholar]
- 33.Jacobsen PB, Butler RW. Relation of cognitive coping and catastrophizing to acute pain and analgesic use following breast cancer surgery. J Behav Med. 1996;19:17–29. doi: 10.1007/BF01858172. [DOI] [PubMed] [Google Scholar]
- 34.Jensen L, Findeis J, Hsu W, Schachter J. Slipping into and out of underemployment: Another disadvantage for non-metropolitan workers? Rural Soc. 1999;64:417–438. [Google Scholar]
- 35.Johansson C, Dahl J, Jannert M, Melin L, Andersson G. Effects of a cognitive-behavioral pain-management program. Behav Res Ther. 1998;36:915–930. doi: 10.1016/s0005-7967(98)00079-5. [DOI] [PubMed] [Google Scholar]
- 36.Jöreskog KG, Sörbom D. LISREL 8: Structural equation modeling with the SIMPLIS command language. Chicago, IL: Scientific Software International; 1996. [Google Scholar]
- 37.Keefe FJ, Caldwell DS, Williams DA, Gil KM, Mitchell D, Robertson C, Martinez S, Nunley J, Beckham JC, Crisson JE, Helms M. Pain coping skills training in the management of osteoarthritic knee pain: a comparative study. Behavioral Therapy. 1990;21:62. [Google Scholar]
- 38.Keefe FJ, Abernethy AP, Campbell LC. Psychological approaches to understanding and treating disease-related pain. Annu Rev Psychol. 2005;56:601–630. doi: 10.1146/annurev.psych.56.091103.070302. [DOI] [PubMed] [Google Scholar]
- 39.Keefe FJ, Brown GK, Wallston KA, Caldwell DS. Coping with rheumatoid-arthritis pain - catastrophizing as a maladaptive strategy. Pain. 1989;37:51–56. doi: 10.1016/0304-3959(89)90152-8. [DOI] [PubMed] [Google Scholar]
- 40.Kirsch IS, Jungeblut A, Jenkins L, Kolstad A. Adult literacy in America: a first look at the results of the National Adult Literacy Survey. Washington, DC: U.S. Department of Education; 1993. [Google Scholar]
- 41.Kuhajda MC, Thorn BE, Gaskins SW, Day MA, Cabbil CM. Literacy adaptations for cognitive behavioral therapy in a rural pain population. Translational Behavioral Medicine: Practice, Policy and Research. doi: 10.1007/s13142-011-0026-2. In Press. [DOI] [PMC free article] [PubMed] [Google Scholar]
- 42.Lackner JA, Morley S, Dowzer C, Mesmer C, Hamilton S. Psychological treatments for irritable bowel syndrome: A systematic review and meta-analysis. J Consult Clin Psychol. 2004;72:1100–1113. doi: 10.1037/0022-006X.72.6.1100. [DOI] [PubMed] [Google Scholar]
- 43.Linton SJ, Ryberg M. A cognitive-behavioral group intervention as prevention for persistent neck and back pain in a non-patient population: a randomized controlled trial. Pain. 2001;90:83–90. doi: 10.1016/s0304-3959(00)00390-0. [DOI] [PubMed] [Google Scholar]
- 44.Litt MD, Shafer DM, Kreutzer DL. Brief cognitive-behavioral treatment for TMD pain: Long-term outcomes and moderators of treatment. Pain. 151:110–116. doi: 10.1016/j.pain.2010.06.030. [DOI] [PMC free article] [PubMed] [Google Scholar]
- 45.Loeser JD. Pain in malignant disease. In: Loeser JD, editor. Bonica’s Management of Pain. 3. New York: Lippincott, Williams & Wilkins; 2001. [Google Scholar]
- 46.Martin MY, Bradley LA, Alexander RW, Alarcon GS, TrianaAlexander M, Aaron LA, Alberts KR. Coping strategies predict disability in patients with primary fibromyalgia. Pain. 1996;68:45–53. doi: 10.1016/S0304-3959(96)03179-X. [DOI] [PubMed] [Google Scholar]
- 47.Mayberry RM, Mili F, Ofili E. Racial and ethnic differences in access to medical care. Med Care Res Review. 2000;57:108–145. doi: 10.1177/1077558700057001S06. [DOI] [PubMed] [Google Scholar]
- 48.McIlvane JM. Disentangling the effects of race and SES on arthritis-related symptoms, coping, and well-being in African American and White women. Aging & Mental Health. 2007;11(5):556–569. doi: 10.1080/13607860601086520. [DOI] [PubMed] [Google Scholar]
- 49.Moher D, Hopewell S, Schulz KF, Montori V, Gøtzsche PC, Devereaux PJ, Elbourne D, Egger M, Altman DG CONSORT Group. CONSORT 2010 Explanation and Elaboration: updated guidelines for reporting parallel group randomised trial. BMJ. 2010;340:c869. doi: 10.1136/bmj.c869. [DOI] [PMC free article] [PubMed] [Google Scholar]
- 50.Morley S, Eccleston C, Williams A. Systematic review and meta-analysis of randomized controlled trials of cognitive behaviour therapy and behaviour therapy for chronic pain in adults, excluding headache. Pain. 1990;80:1–13. doi: 10.1016/s0304-3959(98)00255-3. [DOI] [PubMed] [Google Scholar]
- 51.Moseley GL. Physiotherapy is effective for chronic low back pain. A randomised controlled trial. Aus J Physioth. 2002;48:297–302. doi: 10.1016/s0004-9514(14)60169-0. [DOI] [PubMed] [Google Scholar]
- 52.Moseley GL. Evidence for a direct relationship between cognitive and physical change during an education intervention in people with chronic low back pain. European Journal of Pain. 2004;8:39–45. doi: 10.1016/S1090-3801(03)00063-6. [DOI] [PubMed] [Google Scholar]
- 53.Nguyen M, Ugarte C, Fuller I, Haas G, Portnenoy R. Access to care for chronic pain: racial and ethnic differences. J Pain. 2005;6:301–314. doi: 10.1016/j.jpain.2004.12.008. [DOI] [PubMed] [Google Scholar]
- 54.Osman A, Barrios F, Kopper, Hauptmann, Jones, O’Neil Factor structure, reliability, and validity of the Pain Catastrophizing Scale. J Behav Med. 1997;20:589–605. doi: 10.1023/a:1025570508954. [DOI] [PubMed] [Google Scholar]
- 55.Ostelo RW. Behavioural treatment for chronic low-back pain. The Cochrane Library. 2006;2:1–24. [Google Scholar]
- 56.Radloff LS. The Center for Epidemiologic Studies Depression Scale A self report depression scale for research in the general population. Applied Psychological Measurement. 1977;1:385–401. [Google Scholar]
- 57.Rosenblatt R, Hart L. Culture and medicine. Physicians and rural America. The Western Journal of Medicine. 2000;173:348–351. doi: 10.1136/ewjm.173.5.348. [DOI] [PMC free article] [PubMed] [Google Scholar]
- 58.Safren SA, Heimberg RG, Juster HR. Clients’ expectancies and their relationship to pretreatment symptomatology and outcome of cognitive-behavioral group treatment for social phobia. Journal of Consulting and Clinical Psychology. 1997;65:694–698. doi: 10.1037//0022-006x.65.4.694. [DOI] [PubMed] [Google Scholar]
- 59.Scarinci IC, Ames SC, Brantley PJ. Chronic minor stressors and major life events experienced by low income patients attending primary care clinics: a longitudinal examination. J Behav Med. 1999;22:143–156. doi: 10.1023/a:1018783432010. [DOI] [PubMed] [Google Scholar]
- 60.Schulz KF, Altman DG, Moher D CONSORT Group. CONSORT 2010 Statement: updated guidelines for reporting parallel group randomised trials. Ann In Med. 2010;152 doi: 10.3736/jcim20100702. Epub 24 March. [DOI] [PubMed] [Google Scholar]
- 61.Schur C, Franco S. Access to care. Rural health in the United States. New York, Oxford University Press: T.I. Ricketts; 1999. [Google Scholar]
- 62.Shapiro DA, Barkham M, Stiles WB, Hardy GE, Rees A, Reynolds S, Startup M. Time is of the essence: a selective review of the fall and rise of brief therapy research. Psychology and Psychotherapy: Theory, Research, and Practice. 2003:211–35. doi: 10.1348/147608303322362460. [DOI] [PubMed] [Google Scholar]
- 63.Shmuely Y, Baumgarten M, Rovner B, Berlin J. Predictors of improvement in health-related quality of life among elderly patients with depression. Int Pyschogeriatr. 2001;13:63–73. doi: 10.1017/s1041610201007463. [DOI] [PubMed] [Google Scholar]
- 64.Spira JL. Group therapy for medically ill patients. New York: Guilford Publications; 1997. [Google Scholar]
- 65.Stroud MW, McKnight PE, Jensen MP. Assessment of self-reported physical activity in patients with chronic pain: Development of an abbreviated Roland-Morris Disability Scale. J Pain. 2004;5(5):257–263. doi: 10.1016/j.jpain.2004.04.002. [DOI] [PubMed] [Google Scholar]
- 66.Sullivan M, Bishop S, Pivik J. The Pain Catastrophizing Scale: Development and validation. Psychol Assessment. 1995;7:524–532. [Google Scholar]
- 67.Sullivan MJ, Thorn BE, Haythornthwaite JA, Keefe F, Martin M, Bradley LA, Lefebvre JC. Theoretical perspectives on the relation between catastrophizing and pain. Clinical J Pain. 2001;17:52–64. doi: 10.1097/00002508-200103000-00008. [DOI] [PubMed] [Google Scholar]
- 68.Sullivan MJL, Rouse D, Bishop S, Johnston S. Thought suppression, catastrophizing, and pain. Cognitive Therapy and Research. 1997;21:555–568. [Google Scholar]
- 69.Thorn BE. Cognitive Therapy for Chronic Pain: A Step-by-Step Approach. New York: Guilford Publications; 2004. [Google Scholar]
- 70.Thorn BE, Pence LB, Ward LC, Kilgo G, Clements KL, Cross TH, Davis AM, Tsui PW. A randomized clinical trial of targeted cognitive behavioral treatment to reduce catastrophizing in chronic headache sufferers. J Pain. 2007;8:938–949. doi: 10.1016/j.jpain.2007.06.010. [DOI] [PubMed] [Google Scholar]
- 71.Turk DC, Meichenbaum D, Genest M. Pain and behavioral medicine: a cognitive-behavioral perspective. New York: Guilford; 1983. [Google Scholar]
- 72.Turk DC, Okifuji A. Detecting depression in chronic pain patients: Adequacy of self-reports. Behav Res Ther. 1994;32:9–16. doi: 10.1016/0005-7967(94)90078-7. [DOI] [PubMed] [Google Scholar]
- 73.Turk DC, Okifuji A, Scharff L. Chronic pain and depression: role of perceived impact and perceived control in different age cohorts. Pain. 1995;61:93–101. doi: 10.1016/0304-3959(94)00167-D. [DOI] [PubMed] [Google Scholar]
- 74.Turner JA, Mancl L, Aaron LA. Brief cognitive-behavioral therapy for temporomandibular disorder pain: Effects on daily electronic outcome and process measures. Pain. 2005;117:377–387. doi: 10.1016/j.pain.2005.06.025. [DOI] [PubMed] [Google Scholar]
- 75.Turner JA, Mancl L, Aaron LA. Short- and long-term efficacy of brief cognitive-behavioral therapy for patients with chronic temporomandibular disorder pain: A randomized, controlled trial. Pain. 2006;121:181–194. doi: 10.1016/j.pain.2005.11.017. [DOI] [PubMed] [Google Scholar]
- 76.Van Damme S, Bijttebier P. A confirmatory factor analysis of the Pain Catastrophizing Scale: Invariant factor structure across clinical and non-clinical populations. Pain. 2002;96:319–324. doi: 10.1016/S0304-3959(01)00463-8. [DOI] [PubMed] [Google Scholar]
- 77.Verhaak PF, Kerssens JJ, Dekker J, Sorbi MJ, Bensing JM. Prevalence of chronic benign pain disorder among adults: a review of the literature. Pain. 1998;77:231–239. doi: 10.1016/S0304-3959(98)00117-1. [DOI] [PubMed] [Google Scholar]
- 78.Vlaeyen JW, Teeken-Gruben NJ, Goossens ME, Rutten-van Molken Cognitive-educational treatment of fibromyalgia: a randomized controlled clinical trial. I. Clinical effects. The Journal of Rheumatology. 1996;23:1237–1245. [PubMed] [Google Scholar]
- 79.Weydert JA, Ball TM, Davis MF. Systematic review of treatments for recurrent abdominal pain. Pediatrics. 2003;111:e1–e11. doi: 10.1542/peds.111.1.e1. [DOI] [PubMed] [Google Scholar]
- 80.Wilkinson GS, Robertson GJ. Wide Range Achievement Test 4 (WRAT4) Lutz, FL: Psychological Assessment and Resources, Inc; 2006. [Google Scholar]
- 81.Zalon M. Comparison of pain measures in surgical patients. J Nurs Management. 1999;7:135–152. [PubMed] [Google Scholar]