

Abstract
Objectives
The objectives were to develop a methodology to understand the prevalence of medically complex patients, and to apply the methodology to examine patients with one or more of hypertension, hyperlipidemia, diabetes, and heart disease.
Methods
Prevalence was measured using insurance data by calculating the proportion of days patients in a health state of interest contributed to the total days of enrollment. Graphs summarized the prevalence patterns within age and morbidity categories. Results by age and gender were supplemented with cubic spline curves that closely fit the prevalence data.
Results
The study provides basic epidemiologic information on changes with aging in the prevalence of patients with one or more comorbid conditions. Patients such as those with hyperlipidemia alone rose in prevalence at younger ages and fell at older ages, whereas the prevalence of other patients, such as patients having hypertension, diabetes, and heart disease, progressively increased with age. With straightforward extensions of the methodology other issues such as the incidence of emergency department visits and hospitalizations might be investigated.
Keywords: Medically complex patients, diabetes, hypertension, hyperlipidemia, heart disease
Introduction
The 2009 American Recovery and Reinvestment Act identified patients with multiple chronic conditions as a priority population for patient-centered health research (Department of Health and Human Services Agency for Healthcare Research and Quality, 2009).1 Approximately 75 million people in the United States have two or more conditions that last a year or more and require ongoing medical attention or limit activities of daily living, or both.2,3 Among Medicare beneficiaries 83% have at least one chronic condition.4 The 23% who have five or more such conditions account for 68% of Medicare expenditures. A survey of members of a health maintenance organization ages 65 and over found the average person had 8.7 chronic diseases.5 Patients with multiple chronic conditions have on average a higher level of morbidity, poorer physical functioning and quality of life, a greater likelihood of persistent depression, and lower levels of social well being.5–8 Such patients incur increased risks of adverse drug events and mortality.9
Despite the recent emphasis to conduct research on patients with multiple morbidities, even basic epidemiologic information such as prevalence is not well known. Wolff and colleagues did explore the clustering of major diagnostic categories among Medicare patients and reported the frequency of clustering at this level.10 Typically, however, categories grouped by organ system include a number of chronic conditions. The change in prevalence with aging among patients with even the most common combinations of chronic conditions is largely unknown.11 At the population level projecting expenditures and planning to address future medical needs would benefit from estimates of the number of people with existing combinations of morbidities, and how long they remain in their current states.12–14 For disease management understanding the prevalence of complex patients and their risks could help align health care services with patient needs.
This article reports analyses of administrative data from patients with four chronic conditions of high prevalence among older adults: hypertension, dyslipidemia, diabetes, and heart disease. These conditions were selected because they are commonly managed together. Age and gender specific prevalence curves are presented for everyone with each of the four conditions as well as for patients with specific combinations of the conditions.
Methods
Study Population
The eligible population was members between the ages of 18 and 84 who were enrolled with the largest insurer in Hawai‘i during the decade from 2000 to 2009. Members with chronic diseases were identified from claims data that were available for the years 1999 to 2009, thus giving an additional year prior to the start of the study period to identify patients with the study conditions. Patients with diabetes or heart disease, or both, were identified by algorithms employed by disease management programs. The diseases were confirmed whenever possible through contact of members and their physicians. A physician's confirmation was required to exclude false positives. Either two claims with a diagnosis or one claim with a diagnosis and one claim for a treatment medication in a 12 month interval were required to classify patients as having hypertension or hyperlipidemia. Women with a claim for gestational hypertension, however, were excluded from the identification algorithm during the interval containing the claim. Identification algorithms were run quarterly examining claims in the past 12 months. Patients were considered to have hypertension or hyperlipidemia from the first date of diagnosis or medication use in the defining interval, and assumed to have the condition from that date forward.
Institutional Review Board
The study only included a limited dataset without personal identifying information. For this reason, the study was granted an exemption from institutional review by the University of Hawai‘i institutional review board.
Prevalence Calculations
Prevalence was calculated for all members with a condition such as hypertension or diabetes as well as for patients with specific combinations of comorbidities, such as patients with hypertension, hyperlipidemia, and diabetes. Prevalence was calculated by one year age intervals. The terms state and health state are used in this article to refer to the prevalence conditions examined. The days enrolled among the total eligible population by year of age provided the prevalence denominators. Numerators were calculated as the number of days enrolled by year of age while in a health state. Prevalence, as a consequence, is a ratio of the days of enrollment among patients in a health state divided by the days of enrollment for the entire study population. For some analyses prevalence by age and gender was calculated using an analogous procedure.
Data Analysis
Prevalence by age for the various health states is presented graphically. Prevalence by age and gender was estimated using cubic splines that fit smooth curves both before and after a designated break point called the knot.15 Age 50 was chosen as the knot for the regression models. Prevalence was the dependent variable in the models and age or age and gender with interactions between them were the independent variables. Interaction terms between age and gender were removed from regression models if not statistically significant (P < 0.05). Main effects for significant interaction terms were retained even if not themselves significant, although main effects without statistically significant interaction terms were removed from the models.
Results
The study population included 883 982 people of whom at some time during follow-up 308 484 had hyperlipidemia, 285 872 had hypertension, 87 525 had diabetes, and 62 146 had heart disease. Of patients with hypertension 73.9% were identified by having both a diagnosis code and a prescription. The corresponding percentage for hyperlipidemia was 54.1%. The 10 most common states for patients at some point during follow-up were hypertension and hyperlipidemia (173 650); hyperlipidemia only (143 942); hypertension only (111 291); hypertension, hyperlipidemia, and diabetes (57 255); hypertension, hyperlipidemia, and heart disease (29 990); hypertension, hyperlipidemia, diabetes, and heart disease (21 922); hyperlipidemia and diabetes (13 656); hypertension and diabetes (13 281); diabetes only (9 675); and hyperlipidemia and heart disease (4 416).
Prevalence with age for all patients with hyperlipidemia and for all patients with hypertension exhibited s-shaped curves (Figure 1). For both conditions, prevalence increased rapidly from age 20 up to about age 70. Hypertension maintained gradual increases at older ages whereas hyperlipidemia decreased slightly in prevalence at the oldest ages. Both hypertension and hyperlipidemia peaked with prevalence greater than 80%. The prevalence of diabetes with age also exhibited an s-shaped curve, but one that plateaued at a prevalence of about 25% around age 70. The prevalence for all patients with heart disease, by contrast, rose at an accelerating rate with age reaching a prevalence of close to 30% at the oldest study age of eighty four.
Figure 1.
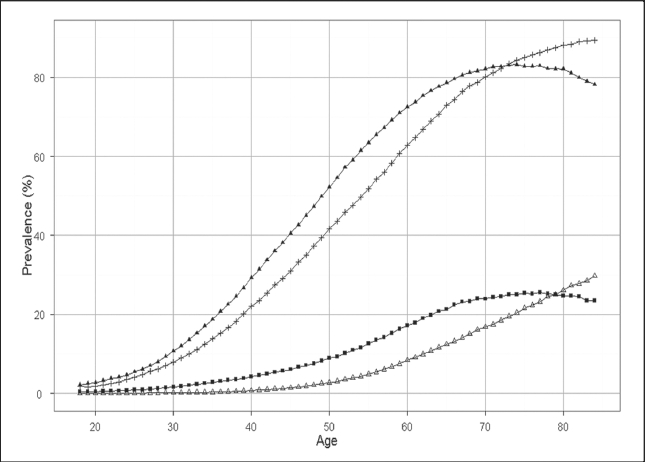
Patients with hyperlipidemia (▴ - ▴), hypertension (+ - +), diabetes (▪ - ▪), and heart disease (▵ - ▵)
Prevalence with age by health state revealed very different patterns among subgroups of patients with the same condition such as patients having hypertension. Prevalence curves for patients with hypertension, hyperlipidemia, or both, but who do not have diabetes or heart disease, are presented in Figure 2. Before age forty five, hyperlipidemia was the most prevalent state; however, from the middle forties onward, patients with hyperlipidemia and hypertension became the most prevalent. Patients having both conditions sustained a prevalence of over 35% from age 65 onward. The prevalence of patients with hyperlipidemia alone declined substantially from the middle fifties. The prevalence of patients with hypertension alone increased until about age fifty and thereafter fluctuated within a few percentages of 10%.
Figure 2.
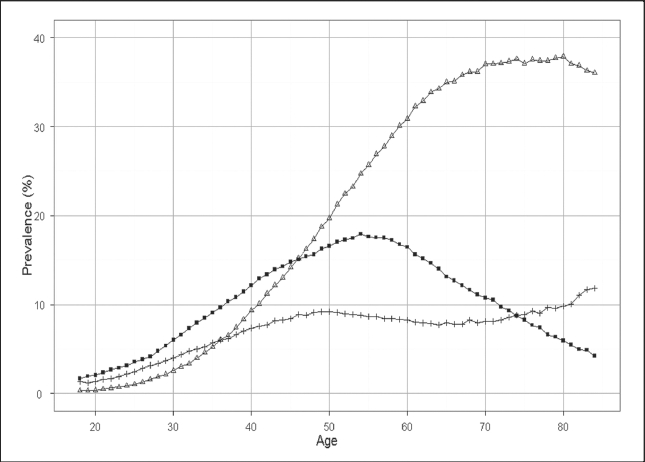
Prevalence by age among patients with hyperlipidemia alone (▪ - ▪), hypertension alone (+ - +), and both hyperlipidemia and hypertension (▵ - ▵)
Most patients with diabetes and without heart disease also had hypertension and hyperlipidemia (Figure 3). Prevalence of patients having all three conditions increased rapidly with age until near age 65, was relatively level for about a decade, then subsequently declined a few percent. The prevalence of patients with diabetes alone or in combination with either hypertension or hyperlipidemia did not reach 2% at any age.
Figure 3.
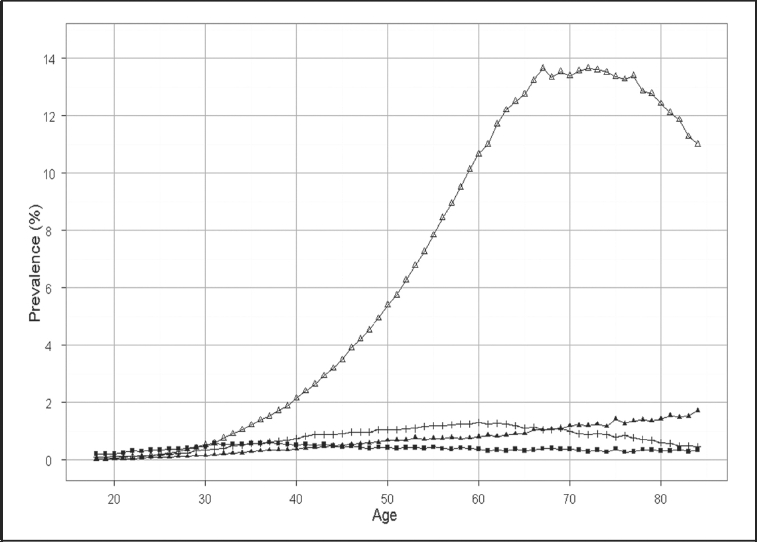
Prevalence with age among patients with hyperlipidemia, hypertension, and diabetes (▵ - ▵); hyperlipidemia and diabetes (+ - +); hypertension and diabetes (▴ - ▴); and diabetes (▪ - ▪) alone
Among patients with heart disease three disease states predominated in prevalence: the state with hypertension and hyperlipidemia as comorbidities, the state with diabetes in conjunction with hypertension and hyperlipidemia, and the state with hypertension and heart disease (Figure 4). Prevalence of health states including heart disease remained under 2% before age 50. The three most common states subsequently climbed markedly in prevalence. By age 85, 3% of the study population had heart disease and hypertension, 8% had heart disease, diabetes, and hyperlipidemia, and over 13% lived with heart disease, hypertension, and hyperlipidemia.
Figure 4.
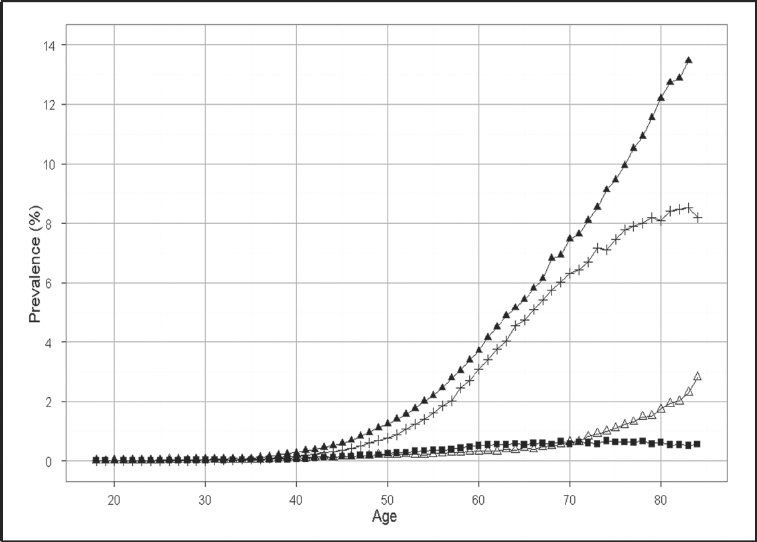
Prevalence with age among patients with hyperlipidemia, hypertension, and heart disease (▴ - ▴); hyperlipidemia, hypertension, diabetes and heart disease (+ - +); hypertension and heart disease (▵ - ▵); and hyperlipidemia and heart disease (▪ - ▪)
Prevalence by age and gender for the six most common health states is illustrated in Figure 5. Cubic spline curves fit to the data closely follow the prevalence points calculated by one year age intervals. For the four states without heart disease, male prevalence exceeded female prevalence at younger ages and female exceeded male prevalence at older ages. By contrast, with the two states that included heart disease male prevalence was invariably greater than female prevalence across the range of ages.
Figure 5.

Prevalence by age and comorbid conditions for females (□ - □) and males (▪ - ▪). The curves fit to the data had high R2 values ranging from 96.43 for patients with hypertension, hyperlipidemia, and heart disease to 99.91 for patients with hypertension and hyperlipidemia.
Discussion
The results illustrate how changes in prevalence by age derive from diverse prevalence patterns among patients who differ in their comorbidities. For instance, by age 50, patients are more likely to have both hypertension and hyperlipidemia than either condition alone. The results make apparent that approaches to improve the health of older Americans should be comprehensive, targeting multiple conditions. The dramatic increase in prevalence of both hypertension and hyperlipidemia among patients with diabetes further emphasizes this point. The results, by quantifying the prevalence of comorbid conditions at specific ages, offer a starting point toward characterizing medically complex patients beyond enumerating the number of morbidities they might have. The characterization could easily be extended to include other information for the same patients such as rates of hospitalizations and emergency department visits. The numerators from the prevalence calculations reported in this article would become the denominators for such rate calculations. The characterization could also be extended to examine other conditions the patients may have. Patients with diabetes and cardiovascular disease often have other health problems that complicate their management.
Although not explored in this article, creating more homogenous subgroups of patients may help to identify poorly managed patients. By examining factors such as recommended screening tests, medication adherence, emergency department use, preventable hospitalizations, and office visit patterns among patients with similar conditions, a subgroup of especially poorly managed individuals might be recognized.
The study results illustrate the increased prevalence of patients with multiple chronic conditions that is projected to occur with the aging of the Baby Boomers. Aging populations challenge existing health care systems and will increasingly do so in the future. In Western countries the proportions of the population 65 years and older were 11 to 18% in 1990 and are expected to increase to 19–26% by 2025.16 The most rapid rate of increase will occur between 2000 and 2035 when the Baby Boomers enter retirement.12 In the United States, one study projected health care costs due to aging will increase 20% from 2000 to 2030.17 With aging, more patients present with multiple chronic conditions that require appropriate management.
The broader healthcare implications of an aging population are harder to anticipate. New technologies and treatments may partially reduce the consequences of morbidity.18,19 Recent evidence suggests illness burden in many developed countries has been decreasing as evidenced by self-reported ratings of health status, as well as reports of activities of daily living and instrumental activities of daily living among the elderly.13,20,21 With longer average live spans an increasing proportion of the population will live for greater years with morbidities. Complications from morbidities preceding death often requires acute care that comes with exceptional costs. A recent review concluded that in recent years this critical phase may be shrinking (Payne, Laportte, Deber, & Coyte, 2007).13 The pattern in the future may be longer years of life spent with chronic diseases but with lower rates of acute events, and a shorter acute period near death. The extent this pattern unfolds has substantial health care consequences as the most rapid shifts toward older populations are still ahead.12
Recent articles have questioned if the current evidence is adequate to guide the management of the most complex patients.22–24 Guidelines are often developed by specialty-dominated committees, and based upon clinical trials from which complex patients are often excluded. Combining recommendations from multiple guidelines may not lead to optimal care, and in some situations, adverse reactions from interactions among drugs and diseases may result.13,22 By extending the approach of this article, investigators might examine variations in current management practices among medically complex patients.
This article's results should be interpreted with respect to a number of limitations. Prevalence will vary by the population studied and the results can not be generalized to other populations. The methodological approach, however, could be applied in other settings. The identification of chronic conditions was based on diagnoses and prescriptions from administrative data, at best indirect measures of clinical diagnoses. With administrative data the number of people identified with a condition can depend on the algorithm used. Using algorithms employed in disease management programs, however, can help link results to practical applications. For this article, patient starting states - their initial combinations of conditions - were determined from their first year of claims activity. Previous clinical histories were unknown. Disease diagnosed before enrolling with the insurer would not be known, and asymptomatic disease may not have been coded. The results, however, do offer a health plan's view of the health of its members.
Conclusions
Health plans use their administrative data for planning prevention and disease management programs, programs that often range in intensity from reminder letters for health screening to case management. Understanding the prevalence of members with differing conditions, their management, and risks of adverse outcomes could help in planning appropriate strategies. For populations identified, as in this article, medical needs might be assessed and variations in health practices could be explored such as adherence with medications and health screening rates. Other aspects of patient complexity beyond the presence of chronic conditions might also be examined.25–27 Economic factors, ethnic variations, and geographical differences, as examples, may differentially affect patients who vary in the combinations of chronic conditions they have to manage. Future studies, in addition, might examine acute outcomes and rates of progression comparing well managed versus poorly managed patients.
Acknowledgement
The research was supported by the Hawai‘i Medical Service Association. Other than this financial support, none of the authors identify any conflict of interest.
References
- 1.Department of Health and Human Services Agency for Healthcare Research and Quality, author. Optimizing prevention and healthcare management for the complex patient. [April 28, 2011]. http://grants.nih.gov/grants/guide/rfafiles/RFA-HS-08-003.html.
- 2.Parekh AK, Barton MB. The challenge of multiple comorbidity for the US health care system. Am Med Assoc. 2010;303:1303–1304. doi: 10.1001/jama.2010.381. [DOI] [PubMed] [Google Scholar]
- 3.Warshaw G. Introduction: advances and challenges in care of older people with chronic illness. Generations. 2006;30:5–10. [Google Scholar]
- 4.Anderson G. Medicare and chronic conditions. N Engl J Med. 2005;353:305–309. doi: 10.1056/NEJMsb044133. [DOI] [PubMed] [Google Scholar]
- 5.Bayliss EA, Ellis JL, Steiner JF. Barriers to self-management and quality-of-life outcomes in seniors with ultimorbidities. Ann Fam Med. 2007;5(5):395–402. doi: 10.1370/afm.722. [DOI] [PMC free article] [PubMed] [Google Scholar]
- 6.Fortin M, Lapoointe L, Hudon C, Vanasse A, Ntetu AL, Maltais D. Multimorbidity and quality of life in primary care: a systematic review. Health Qual Life Outcomes. 2004;2:51. doi: 10.1186/1477-7525-2-51. [DOI] [PMC free article] [PubMed] [Google Scholar]
- 7.Fortin M, Bravo G, Hudon C, Lapointe L, Almirall J, Dubois MF, Vanasse A. Relationship between multimorbidity and health-related quality of life of patients in primary care. Qual Life Res. 2006;15(1):83–91. doi: 10.1007/s11136-005-8661-z. [DOI] [PubMed] [Google Scholar]
- 8.Fortin M, Dubois MF, Hudon C, Soubhi H, Almirall J. Multimorbidity and quality of life: a closer look. Health Qual Life Outcomes. 2007;5:52. doi: 10.1186/1477-7525-5-52. [DOI] [PMC free article] [PubMed] [Google Scholar]
- 9.Gijsen R, Hoeymans N, Schellevis FG, Ruwaard D, Satariano WA, van den Bos GA. Causes and consequences of comorbidity: a review. J Clin Epidemiol. 2001;54(7):661–674. doi: 10.1016/s0895-4356(00)00363-2. [DOI] [PubMed] [Google Scholar]
- 10.Wolff JL, Starfiled B, Anderson GF. Prevalence, expenditures, and complications of multiplechronic conditions in the elderly. Arch Intern Med. 2002;162:2269–2276. doi: 10.1001/archinte.162.20.2269. [DOI] [PubMed] [Google Scholar]
- 11.Vogeli C, Shields AE, Lee TA, Gibson TB, Marder WD, Weiss KB, Blumenthal D. Multiple chronic conditions: prevalence, health consequences, and implications for quality, care management, and costs. J Gen Intern Med. 22(Suppl 3):391–395. doi: 10.1007/s11606-007-0322-1. [DOI] [PMC free article] [PubMed] [Google Scholar]
- 12.Martini EM, Garrett N, Lindquist T, Isham GJ. The Boomers are coming: A total cost of care model of the impact of population aging on health care costs in the United States by major practice category. Health Serv Res. 2007;42(1 Pt 1):201–218. doi: 10.1111/j.1475-6773.2006.00607.x. [DOI] [PMC free article] [PubMed] [Google Scholar]
- 13.Payne G, Laporte A, Deber R, Coyte P. Counting backward to health care's future: Using time-todeath modeling to identify changes in end-of-life morbidity and the impact of aging on health care expenditures. Milbank Q. 2007;85(2):213–257. doi: 10.1111/j.1468-0009.2007.00485.x. [DOI] [PMC free article] [PubMed] [Google Scholar]
- 14.Valderas JM, Starfield B, Sibbald B, Salisbury C, Roland M. Defining comorbidity: implicaitons for understanding health and health services. Annals Family Med. 2009;7:357–363. doi: 10.1370/afm.983. [DOI] [PMC free article] [PubMed] [Google Scholar]
- 15.Snijders Tom AB, Bosker Roel J. Multilevel Analysis: An Introduction to Basic and Advanced Multilevel Modeling. London etc.: Sage Publishers; 1999. [Google Scholar]
- 16.US Bureau of the Census, author. International Population Reports, An Aging World II. Washington DC: US Government Printing Office; 1992. p. 25. 92–93. [Google Scholar]
- 17.Alemayehu B, Warner KE. The lifetime distribution of health care costs. Health Serv Res. 2004;39(3):627–642. doi: 10.1111/j.1475-6773.2004.00248.x. [DOI] [PMC free article] [PubMed] [Google Scholar]
- 18.Cutler DM, McClellan M. Is technological change in medicine worth it? Health Aff. 2001;20(5):11–29. doi: 10.1377/hlthaff.20.5.11. [DOI] [PubMed] [Google Scholar]
- 19.Meara E, White C, Cutler DM. Trends in medial spending by age, 1963–2000. Health Aff. 2004;23:176–183. doi: 10.1377/hlthaff.23.4.176. [DOI] [PubMed] [Google Scholar]
- 20.Crimmins EM. Trends in the health of the elderly. Ann Rev Public Health. 2004;25:79–98. doi: 10.1146/annurev.publhealth.25.102802.124401. [DOI] [PubMed] [Google Scholar]
- 21.Jagger C, Barberger-Gateau Robie JM. Disability in older people - indicators, process and outcomes. Disabil Rehabil. 2005;27(5):209–212. doi: 10.1080/09638280400006416. [DOI] [PubMed] [Google Scholar]
- 22.Boyd CM, Darer J, Boult C, Fried LP, Boult L, Wu AW. Clinical practice guidelines and quality of care for older patients with multiple comorbid diseases.: Implications for pay for performance. JAMA. 2005;294(6):716–724. doi: 10.1001/jama.294.6.716. [DOI] [PubMed] [Google Scholar]
- 23.Werner RM, Greenfield S, Fung C, Turner BJ. Measuring quality of care in patients with multiple clinical conditions: summary of a conference conducted by the Society of General Internal Medicine. J Gen Intern Med. 2007;22(8):1206–1211. doi: 10.1007/s11606-007-0230-4. [DOI] [PMC free article] [PubMed] [Google Scholar]
- 24.Vitry A, Zhang Y. Quality of Australian clinical guidelines and relevance to the care of older people with multiple comorbid conditions. Med J Aust. 2008;189(7):360–365. doi: 10.5694/j.1326-5377.2008.tb02079.x. [DOI] [PubMed] [Google Scholar]
- 25.Safford MM, Allison JJ, Kiefe C. Patient complexity: More than comorbidity. The vector model of complexity. J Gen Intern Med. 2007;22(S3):382–390. doi: 10.1007/s11606-007-0307-0. [DOI] [PMC free article] [PubMed] [Google Scholar]
- 26.Leischow SJ, Best A, Trochim WM, Clark PI, Gallagher RS, Marcus SE, Matthews E. Systems thinking to improve the public's health. Am J Prev Med. 2008;35(2S):S196–S203. doi: 10.1016/j.amepre.2008.05.014. [DOI] [PMC free article] [PubMed] [Google Scholar]
- 27.Mabry PL, Olster DH, Morgan GD, Abrams DB. Interdisciplinarity and systems science to improve population health: A view from the NIH Office of Behavioral and Social Sciences Research. Am J Prev Med. 2008;35(S2):S211–S224. doi: 10.1016/j.amepre.2008.05.018. [DOI] [PMC free article] [PubMed] [Google Scholar]