

Abstract
Objective
This study examines the role of neighborhood context in the accumulation of biological risk factors and racial/ethnic and socioeconomic disparities.
Method
Data come from face-to-face interviews and blood collection on a probability sample of adults (n=549) in the 2002 Chicago Community Adult Health Study. Following the approach of prior studies, we constructed an index of cumulative biological risk (CBR) by counting how many of eight biomarkers exceeded clinically defined criteria for “high risk”: systolic and diastolic blood pressure, resting heart rate, hemoglobin A1c, C-reactive protein, waist size, and total and HDL cholesterol. Data are presented as incidence rate ratios (IRR) based on generalized linear models with a Poisson link function and population-average estimates with robust standard errors.
Results
Non-Hispanic blacks (n=200), Hispanics (n=149), and people with low (n=134) and moderate (n=275) education had significantly higher numbers of biological risks than their respective reference groups (IRR=1.48, 1.59, 1.62, and 1.48, respectively, with p-values <0.01). Black-white (p<0.001) and Hispanic-white (p<0.003) disparities in CBR remained significant after adjusting for individual-level socioeconomic position and behavioral factors, while individual-level controls substantially diminished the low/high (p<0.069) and moderate/high (p<0.042) educational differences. Estimating “within-neighborhood” disparities to adjust for neighborhood context fully explained the black-white gap in CBR (p<0.542) and reduced the Hispanic-white gap to borderline significance (p<0.053). Neighborhood affluence predicted lower levels of CBR (IRR=0.82, p<0.027), but neighborhood disadvantage was not significantly associated with CBR (IRR=1.00, p<0.948).
Conclusions
Neighborhood environments appear to play a pivotal role in the accumulation of biological risk and disparities therein.
Keywords: social environment, health disparities, cumulative biological risk, allostatic load, risk factor
A growing body of research demonstrates that having multiple adverse biological risk factors – such as hypertension, obesity, high blood sugar, and elevated cholesterol – increases the risk of morbidity, functional and cognitive decline, and mortality (1-16). Such research also suggests that racial/ethnic minority groups and people with lower levels of education and income tend to accumulate more biological risk factors (4, 6, 9, 10, 17-20), making the cumulative toll of such “wear and tear” to the body a potentially critical, though not yet widely recognized, facet of health disparities in the United States.
In an influential essay on the pathways from stress to disease, McEwen and Stellar (21) coined the term allostatic load to describe the harmful effects of physiological response patterns that can ensue from prolonged exposure to stressful environments or being highly reactive to stressors. They described a process in which the body responds to physical, psychosocial, and environmental stressors by producing hormones and neurotransmitters that help the body respond to stress by coordinating physiological responses across multiple biological systems, thus achieving stability through change (22). In the face of severe or prolonged stress, dysfunctions can result from physiological systems being activated too frequently, not having a chance to return to their setpoints, or ceasing to activate adequately. Moreover, dysfunctions of one physiological system can spillover into related systems. For example, exposure to stress can trigger surges in blood pressure, which in turn can accelerate atherosclerosis or interact with metabolic processes to produce Type II diabetes (22). Thus, the theory of allostatic load offers a framework for understanding not only the pathways between stress and disease but also how physiological pathologies can spread across systems and cumulatively affect health.
There is a growing literature on how to measure allostatic load in population-based research. Most studies of this kind create indices of allostatic load from biomarkers of metabolic, inflammatory, cardiovascular, and neuroendocrine processes. There is substantial variation across studies in how many biomarkers are included in such indices, which physiological systems are represented, and how the indices are formulated [for a comprehensive review, see Juster, McEwen, and Lupien (23)]. In this study we follow an approach similar to prior studies but use the term “cumulative biological risk” (CBR) rather than allostatic load to describe indices of this kind to acknowledge that they are indirect indicators (at best) of the underlying processes that generate allostatic load. That is, like other studies, we do not have measures of primary stress mediators and instead have secondary outcomes that reflect adaptive physiological responses to stress and other adverse stimuli but which also can arise from other etiologies. Although some scholars use the term “allostatic load” in reference to similar measures, we did not want to give readers the impression that we were directly operationalizing the concept of allostatic load and thus preferred the term CBR. It is worth noting that metabolic syndrome describes a cluster of risk factors that overlaps considerably with those in our measure of CBR, although conceptually allostatic load addresses a broader array of systems in dysregulation. Both of these concepts describe a potentially interrelated set of physiological conditions that may have cumulative and interactive effects on health.
Several studies show that racial/ethnic minorities and/or people of lower social status experience a greater accumulation of biological risk factors (11, 24). For example, in an analysis of the Normative Aging Study (24), Kubzansky and colleagues found that respondents with lower levels of education experienced higher levels of cumulative biological risk. In Weinstein and colleagues’ study using both the MacArthur Study of Successful Aging and Taiwan Social Environment and Biomarkers of Aging Study (SEBAS) cohorts (25), income and education were inversely related to CBR. Likewise, higher levels of education and income were associated with lower CBR in Seeman and colleagues’ (26) analysis of the National Health and Nutrition Examination Study (NHANES III). Respondents with a poverty-income ratio less than 1.85 were more likely than the non-poor to have high CBR in Geronimus and colleagues’ analysis of NHANES III, and they also found racial differences in CBR, with higher risks for respondents in the non-poor black category compared to poor whites (6). Several other studies have also shown that blacks (6, 9, 19, 26) and Hispanics (9, 19) have significantly more risks than whites, independent of education and income.
Neighborhood environments are often invoked as a possible explanation for social disparities in health. In their study of NHANES III, Bird and colleagues (27) found that neighborhood socioeconomic status was associated with a higher count of biological risks after adjustment for age, gender, race/ethnicity, marital status, nativity, education, and an income to poverty ratio. Merkin and colleagues (28) expanded on the analysis by Bird and colleagues, using models stratified by race/ethnicity to show that the relationship between neighborhood disadvantage and CBR is strongest among blacks and, to a lesser extent, Mexican Americans. Neither study assessed the degree to which neighborhood factors explain racial/ethnic differences in CBR; Merkin and colleagues cite insufficient overlap in the distribution of neighborhood disadvantage between blacks and whites as an obstacle to such an analysis using the NHANES data (28). Thus, to date, no study has provided a systematic account of how much individual-level disparities are a function of or conditioned by neighborhood context (29).
This paper (1) assesses the contribution of neighborhood environments to racial/ethnic and socioeconomic disparities in CBR, using data from a population-based study of adults in Chicago, and (2) shows that the relationship between neighborhood socioeconomic position and CBR may be driven less by the factors that indicate neighborhood disadvantage (e.g., aggregate income levels and rates of poverty, unemployment, public assistance) and more by factors that may be more indicative of relative neighborhood affluence (e.g., aggregate education levels, occupational composition, and home values).
MATERIALS AND METHODS
Data
Data come from the Chicago Community Adult Health Study (CCAHS), a multi-level study designed to understand the role of residential context, as well as individual and household factors, in affecting both self-reported and biomedical indicators of adult health. A probability sample of 3105 adults age 18 and older living in the city of Chicago was interviewed and their physical health measured between May, 2001 and March, 2003. The sample was stratified into 343 neighborhood clusters (NCs), previously defined by the Project on Human Development in Chicago Neighborhoods (PHDCN) (30), such that each NC usually included two census tracts (roughly 8,000 people) with meaningful physical and social boundaries. One individual was interviewed per household, with a response rate of 71.8 percent. Persons in 80 focal areas previously defined by the PHDCN were sampled at twice the rate of those in the rest of the city and invited to contribute saliva and blood samples. The focal NCs are a stratified random sample of the 343 NCs, where the strata were defined to reflect racial/ethnic composition (seven categories representing admixtures of whites, blacks, and Hispanics) and socioeconomic status (three categories representing low, medium, and high), resulting in a socioeconomically and racially-ethnically heterogeneous subset of Chicago’s neighborhoods (31). Of the 1,145 respondents who lived in the 80 focal NCs, a blood sample was obtained for 629 (55 percent), and 549 of the resulting blood samples yielded valid data for all measures. In this analytical sample, there were between 2 and 12 people per NC, with a mean of 6.9. All data and analyses are weighted to account for different rates of subsampling for final intensive interview completion efforts, non-response, and the unique sociodemographic composition of the 80 focal NCs, such that the weighted sample matches the 2000 Census population estimates for the city of Chicago in terms of age, race/ethnicity, and sex. Comparisons of the sociodemographic composition of the analytic sample with the full samples of 1145 in the focal NCs and 3105 in the city of Chicago found little difference among them. The original data collection for the CCAHS study was approved under the University of Michigan Behavioral Sciences and Health Sciences Institutional Review Boards.
Outcome Measure
Following an approach used in similar studies, we constructed an index of CBR by counting, for each subject, the number of biomarkers that exceeded clinically-defined criteria for “high risk,” as follows: systolic blood pressure (SBP) ≥ 140 mm Hg (32); diastolic blood pressure (DBP) ≥ 90 mm Hg (32); resting heart rate (RHR) ≥ 90 beats/minute (33); glycosylated/glycated hemoglobin (HbA1c) ≥ 6.4% (34, 35); C-reactive protein (CRP) ≥ 3 mg/dL (36); total cholesterol (TC) ≥ 240 mg/dL (37); high-density lipoprotein cholesterol (HDL) ≤ 36 mg/dL for men and ≤ 46 mg/dL for women (38); and waist size (WS) > 102 cm for men and > 88 cm for women (39). We imputed waist size for 10 respondents whose measures were outside the range of 25-50 inches (interviewers wrote notes about each of these cases indicating that the measurement was inaccurate) using predicted values from a regression model that included sex, age, immigrant status, race, and birth parity for women. The results reported below are based on the sample of 549 subjects with non-missing data on all eight biomarkers. However, in supplemental analysis we imputed values on all biomarkers for respondents with missing data, constructed a revised index of CBR based on the imputed data, and replicated all of the models. We chose not to report the results based on the revised CBR scale because (a) they produced no notable differences and (b) the missing values we imputed for this analysis were very likely to be missing at random due to laboratory error in processing blood samples. Although measures of CBR used in prior studies vary considerably (23), the eight biomarkers that comprise our index include indicators of three major physiological systems – cardiovascular (SBP, DBP, and RHR), metabolic (HbA1c, TC, HDL, WS), and immune (CRP) – and overlap substantially with the biomarkers used to construct indices of CBR in recent comparable studies (27, 28). We also examined the robustness of our results to alternate specifications of the index by serially excluding each item and reconstructing the index.
A recent review of the research on allostatic load by Juster, McEwen, and Lupien (2009) examined 58 studies analyzing outcomes that we would call measures of CBR. The number of biomarkers included in these CBR indices ranged from 4 to 16, and 51 different biomarkers were used in at least one of these 58 studies. Like the CCAHS, about 25% of the studies reviewed did not include a measure of neuroendocrine function in their index. Our CBR measure is very similar to those used in recent studies of neighborhood context and allostatic load/CBR by Merken et al. (2009) and Bird et al. (2009), both of which used almost the same set of biomarkers as ours, with the only differences being (a) their inclusion of albumin (an immune measure) and (b) their use of the waist-hip ratio rather than waist size (we use the latter).
Independent Variables
In all of our regression models we control for a core set of individual-level sociodemographic variables that include measures of race/ethnicity (non-Hispanic white, non-Hispanic black, Hispanic, and non-Hispanic other), gender, age (18-29, 30-39, 40-49, 50-59, 60-69, and 70 and older), immigrant generation (first, second, and third or more), educational attainment (less than 12 years, 12-15 years, and 16 or more years), and income ($0-9,999, $10,000-29,999, $30,000-49,999, $50,000 or more). In some models we also introduce controls for health behaviors including measures of physical activity (whether the respondent reports either engaging in light-moderate activity four or more times per week for 20 minutes or more or vigorous activity at least two times per week regardless of duration), fruit and vegetable intake (whether the respondent reports usually eating at least two servings of fruit and/or vegetables per day), smoking (current smoker, former smoker, or never smoked regularly), and drinking (never a regular drinker; no longer a regular drinker; “moderate” drinker, defined as .5 to 60 drinks/month for women and .5 to 90 drinks/month for men; and “heavy” drinker, defined as more than 60 drinks/month for women and more than 90 drinks/month for men). We also included a dichotomous variable to indicate respondents whose income was missing (n=146). Small numbers of missing values were imputed for physical activity (n = 1), fruit and vegetable consumption (n = 1), and smoking (n = 3).
We use two measures of neighborhood socioeconomic position in our analysis, both constructed by calculating the average value of a set of standardized variables for each NC. Our decisions of which census variables to include in each scale were informed by an exploratory factor analysis with an orthogonal varimax rotation. The first scale (Cronbach’s alpha=0.96) is referred to as “neighborhood socioeconomic disadvantage” because it combines measures of the proportion of households with incomes of less than $15,000, the proportion with incomes of at least $50,000 (reverse coded), the proportion of families in poverty, the proportion of households on public assistance, the unemployment rate, and the proportion of vacant housing units. The second scale (Cronbach’s alpha=0.94) is called “neighborhood affluence” because it combines measures of the proportion employed civilians ages 16 and over in professional/ managerial occupations, the proportion of individuals ages 25 and over who have completed 16 or more years of education, and median home values. Because these two neighborhood scales are somewhat highly correlated (r = −0.49), we show results from regression models when they are entered one-at-a-time and simultaneously.
Analytic Plan
Our central analytic aim is to assess the extent to which taking group differences in neighborhood context into account in multilevel models changes estimates of racial/ethnic and socioeconomic disparities in CBR. In all of our multivariate models we use Poisson regressions because the outcome is a count of health risk factors. Tests for overdispersion and zero-inflation were not significant, and results from Poisson models were consistent with those from negative binomial models. Models without neighborhood random effects (models 1-4) were run in Stata, version 11, with standard errors adjusted for the clustering of individuals within neighborhoods; while models that include neighborhood random effects (models 5-8) were run in HLM, version 6 (using a generalized linear model with a Poisson link function and population-average estimates with robust standard errors). To ease interpretation of our results, we present the incidence rate ratios (IRRs) (40), which for a unit change in a given covariate, Δxi, is calculated as and interpreted as the change in the expected number of risk factors per person associated with a one unit change in the covariate.
We first estimated individual-level disparities in CBR, focusing on differences across groups defined by race/ethnicity, immigrant status, education, and income (models 1-4). These models all controlled for sex and age and introduce the following blocks of variables, separately and in combination: (a) race, ethnicity, and immigrant status; (b) education and income; and (c) behavioral factors that could potentially mediate either racial/ethnic or socioeconomic disparities, including physical activity, fruit and vegetable intake, smoking, and drinking. We then adjusted for neighborhood context by running multilevel models with neighborhood random effects (models 5-8), taking two different approaches to model specification. First, we present a multilevel model that has no neighborhood-level covariates but in which each covariate is centered around its neighborhood mean so that the coefficients represent “within-neighborhood” estimates of individual-level disparities in CBR. This approach is similar to adding neighborhood fixed effects but avoids the problem that non-linear fixed effect models can become severely biased with many strata (29, 41, 42). Next, we examine the relationship between measures of neighborhood socioeconomic position – disadvantage and affluence – and CBR, adding each measure separately and then combining them in the same model to estimate the degree to which they may explain racial/ethnic and socioeconomic disparities.
RESULTS
Table 1 shows the percentage of sample members who were coded as “high-risk” on each of the biomarkers included in the CBR scale. The most common risk factor was high waist size (46.8%), followed by high CRP (41.0%), and low HDL cholesterol (25.0%). The mean number of risk factors is 1.83, with a standard deviation of 1.50, while the median is two risk factors. Table 2 shows the frequencies of the resulting index of CBR; almost half of the respondents have either no risk factors (n=127) or one risk factor (n=126). Descriptive statistics on the predictor variables are presented in Table 3. Being representative of Chicago, our sample contains a substantial share of first generation immigrants and persons with low education and income, slightly more women than men, and an average age of 43.0 years.
Table 1.
Frequency of Individual Biological Risks (n=549)
| Biological Measure | Number at Risk | Weighted Percent at Risk |
|---|---|---|
| Systolic Blood Pressure | 108 | 19.1% |
| Diastolic Blood Pressure | 94 | 14.6% |
| Resting Heart Rate | 42 | 7.0% |
| C-Reactive Protein | 25 | 37.7% |
| HbA1c | 65 | 12.9% |
| HDL Cholesterol | 137 | 24.3% |
| Total Cholesterol | 76 | 13.1% |
| Waist Size | 258 | 44.9% |
HDL = High-density lipoprotein; HbA1c = Hemoglobin A1c
Table 2.
Frequency of Cumulative Biological Risk/ Allostatic Load Scores (CCAHS, n=549)
| Risk Factors | Frequency | Weighted Frequency |
|---|---|---|
| 0 | 127 | 23.8% |
| 1 | 126 | 26.2% |
| 2 | 120 | 21.6% |
| 3 | 107 | 17.1% |
| 4 | 38 | 6.1% |
| 5 | 21 | 3.0% |
| 6 | 9 | 1.8% |
| 7 | 1 | 0.3% |
| 8 | 0 | 0.0% |
|
| ||
| Total | 549 | |
CCAHS = Chicago Community Adult Health Survey
Table 3.
Summary Statistics for Analytical Sample (CCAHS, n=549)
| Unweighted n | Weighted % | |
|---|---|---|
| Race/Ethnicity | ||
| Non-Hispanic Whites | 187 | 35.7 |
| Non-Hispanic Blacks | 200 | 39.7 |
| Hispanics | 149 | 20 |
| Non-Hispanic Others | 13 | 4.7 |
| Sex | ||
| Male | 231 | 46.1 |
| Female | 318 | 53.9 |
| Age | ||
| Age 18-29 | 133 | 23.5 |
| Age 30-39 | 123 | 20 |
| Age 40-49 | 118 | 21.2 |
| Age 50-59 | 82 | 16.4 |
| Age 60-69 | 52 | 7.7 |
| Age 70+ | 41 | 11.1 |
| Immigrant Status | ||
| 1st Generation | 123 | 20.2 |
| 2nd Generation | 79 | 14.7 |
| 3rd + Generation | 347 | 65.1 |
| Education | ||
| <12 Years | 134 | 21.3 |
| 12-15 Years | 275 | 49.4 |
| 16+ Years | 140 | 29.3 |
| Income | ||
| $0-9,999 | 75 | 13.7 |
| $10,000-29,999 | 69 | 12.6 |
| $30,000-49,999 | 147 | 26.8 |
| $50,000+ | 112 | 20.4 |
| Physical Activity | ||
| Less Than Highly Active | 296 | 51.9 |
| Highly Active | 253 | 48.1 |
| Fruits/Vegetables | ||
| Consumed >= 2 | 359 | 66.7 |
| Consumed < 2 | 190 | 33.3 |
| Smoking | ||
| Never Smoker | 299 | 55.3 |
| Current Smoker | 100 | 26.2 |
| Former Smoker | 150 | 18.5 |
| Drinking | ||
| Always Abstained | 100 | 16 |
| Currently Not/Rare | 132 | 23.1 |
| Moderate | 294 | 57.8 |
| Heavy | 23 | 3.1 |
CCAHS = Chicago Community Adult Health Survey
We present the results of our multivariate analysis of CBR in Table 4. The first model estimates disparities in CBR by race/ethnicity and immigrant generation, adjusting for age, and sex. The results show that blacks had 1.48 times as many risk factors per person as whites and that Hispanics had 1.59 times as many as whites, but there were no significant differences between non-Hispanics of other races and whites. CBR increased with age but did not significantly vary by sex or immigrant generation. The second model estimates disparities by education and income. Having higher levels of education was associated with lower CBR, as people with 0-11 years of education had 1.62 times as many risk factors compared to people 16 or more years of education, while people with 12-15 years of education had 1.48 times as many risk factors as those in the highest education group. There were no significant differences by income in model 2 or any of the other models. Differences by age were smaller in model 2 than in model 1, suggesting some confounding of the age differences by age-graded socioeconomic variables. When measures of race/ethnicity/immigration and individual socioeconomic position were controlled simultaneously, in model 3, the education gaps were reduced substantially (the gap between the lowest and highest educational categories was reduced by 44 percent), and the gap between Hispanics and whites was reduced by 13 percent, but the black-white gap did not change. (Percentage changes are based on changes in raw coefficients between models 2 and 3; table 4 reports the exponentiated coefficients.) In model 4 we introduced controls for health behaviors, which reduced the black-white gap by 23 percent (based on changes in the raw coefficients between models 3 and 4), while the Hispanic-white gap remained unchanged, and educational disparities were further reduced. Engaging in high levels of physical activity and drinking moderate amounts of alcohol were each associated with lower CBR in model 4, but neither smoking nor fruit-and vegetable consumption was significantly associated with CBR.
Table 4.
Incidence Rate Ratios from Weighted Poisson Regressions of Cumulative Biologic Risk on Individual- and Neighborhood-Level Predictors (CCAHS, 2001-3, n = 549)
| No Random Effects | With Neighborhood Random Effects | |||||||
|---|---|---|---|---|---|---|---|---|
| All Covariates Centered around Neighborhood Cluster Means |
No Centering | |||||||
| 1 | 2 | 3 | 4 | 5 | 6 | 7 | 8 | |
| IRR (SE) | IRR (SE) | IRR (SE) | IRR (SE) | IRR (SE) | IRR (SE) | IRR (SE) | IRR (SE) | |
| Female | 1.13 (0.13) | 1.12 (0.12) | 1.14 (0.12) | 1.09 (0.12) | 1.13 (0.10) | 1.10 (0.11) | 1.08 (0.11) | 1.08 (0.11) |
| Age (ref=18-29) | ||||||||
| 30-39 | 1.18 (0.17) | 1.13 (0.18) | 1.13 (0.17) | 1.12 (0.15) | 1.00 (0.12) | 1.12 (0.13) | 1.12 (0.13) | 1.11 (0.13) |
| 40-49 | 1.77 (0.30) *** | 1.69 (0.31) ** | 1.69 (0.29) ** | 1.61 (0.24) ** | 1.42 (0.13) ** | 1.60 (0.15) ** | 1.52 (0.15) ** | 1.52 (0.15) ** |
| 50-59 | 1.95 (0.30) *** | 1.85 (0.31) *** | 1.84 (0.30) *** | 1.73 (0.27) *** | 1.58 (0.15) ** | 1.73 (0.16) *** | 1.72 (0.16) *** | 1.72 (0.16) *** |
| 60-69 | 2.55 (0.41) *** | 2.30 (0.46) *** | 2.38 (0.43) *** | 2.16 (0.36) *** | 2.10 (0.14) *** | 2.19 (0.16) *** | 2.22 (0.16) *** | 2.22 (0.15) *** |
| 70+ | 2.83 (0.47) *** | 2.30 (0.45) *** | 2.63 (0.50) *** | 2.20 (0.38) *** | 1.96 (0.18) *** | 2.22 (0.16) *** | 2.18 (0.17) *** | 2.18 (0.17) *** |
| Race (ref=Non- Hisp. White) |
||||||||
| Non-Hisp. Black | 1.48 (0.21) ** | 1.47 (0.20) ** | 1.36 (0.19) * | 0.90 (0.17) | 1.27 (0.15) | 1.17 (0.14) | 1.16 (0.15) | |
| Hispanic | 1.59 (0.26) ** | 1.50 (0.24) * | 1.51 (0.25) * | 1.32 (0.14) + | 1.52 (0.16) ** | 1.31 (0.15) + | 1.31 (0.15) + | |
| Non-Hisp. Other | 1.11 (0.20) | 1.14 (0.19) | 1.02 (0.19) | 1.04 (0.12) | 1.08 (0.16) | 0.99 (0.16) | 0.99 (0.16) | |
| Immigrant Status (ref=3rd Gen.) |
||||||||
| 1st Gen | 0.95 (0.11) | 1.01 (0.12) | 0.92 (0.12) | 0.96 (0.12) | 0.91 (0.13) | 0.94 (0.12) | 0.94 (0.12) | |
| 2nd Gen | 0.90 (0.12) | 0.91 (0.12) | 0.86 (0.12) | 0.70 (0.17) * | 0.82 (0.14) | 0.81 (0.13) | 0.81 (0.13) | |
| Education (ref=16 + Years) |
||||||||
| 0-11 Years | 1.62 (0.26) ** | 1.31 (0.20) + | 1.24 (0.19) | 1.25 (0.16) | 1.21 (0.14) | 1.09 (0.15) | 1.09 (0.15) | |
| 12-15 Years | 1.48 (0.16) *** | 1.32 (0.15) * | 1.28 (0.16) * | 1.33 (0.12) * | 1.29 (0.12) * | 1.17 (0.13) | 1.17 (0.13) | |
| Income (ref=$0- 9,999) |
||||||||
| $10,000-29,999 | 1.11 (0.15) | 1.05 (0.14) | 1.10 (0.15) | 1.13 (0.15) | 1.08 (0.13) | 1.11 (0.13) | 1.11 (0.13) | |
| $30,000-49,999 | 1.01 (0.12) | 0.95 (0.12) | 0.97 (0.10) | 1.08 (0.13) | 0.99 (0.10) | 1.02 (0.10) | 1.02 (0.10) | |
| $50,000+ | 0.92 (0.13) | 0.89 (0.11) | 0.98 (0.13) | 0.98 (0.14) | 0.96 (0.13) | 1.01 (0.13) | 1.01 (0.13) | |
| Physical Activity (ref=Not Highly Active) |
||||||||
| Highly Active | 0.69 (0.05) *** | 0.70 (0.08) *** | 0.69 (0.08) *** | 0.72 (0.08) *** | 0.72 (0.08) *** | |||
| Fruit/Veg. >= 2 Servings |
1.07 (0.08) | 1.03 (0.07) | 1.06 (0.07) | 1.07 (0.07) | 1.07 (0.07) | |||
| Smoking (ref=Non- Smoker) |
||||||||
| Former Smoker | 1.01 (0.13) | 0.99 (0.12) | 0.99 (0.12) | 1.00 (0.12) | 1.00 (0.12) | |||
| Current Smoker | 0.95 (0.08) | 0.88 (0.09) | 0.93 (0.08) | 0.92 (0.08) | 0.92 (0.08) | |||
| Drinking (ref=Always Abstained) |
||||||||
| Currently Not Currently/Rarely |
0.96 (0.10) | 0.97 (0.11) | 0.95 (0.10) | 0.95 (0.10) | 0.95 (0.09) | |||
| Moderate | 0.79 (0.10) * | 0.77 (0.12) * | 0.78 (0.12) * | 0.79 (0.12) * | 0.79 (0.12) * | |||
| Heavy | 1.04 (0.29) | 0.90 (0.32) | 1.03 (0.29) | 1.08 (0.30) | 1.08 (0.30) | |||
| Neighborhood Characteristics |
||||||||
| Disadvantage | 1.05 (0.09) | 1.00 (0.07) | ||||||
| Affluence | 0.82 (0.09) * | 0.82 (0.09) * | ||||||
| Constant | 0.77 (0.13) | 0.72 (0.13) + | 0.63 (0.11) * | 0.90 (0.21) | 1.57 (0.07) *** | 0.95 (0.23) | 1.07 (0.23) | 1.07 (0.23) |
p < 0.10
p < 0.05
p < 0.01
p < 0.001
IRR = incidence rate ratio
Model 5 presents the within-neighborhood estimates of individual-level differences in CBR from a random-effects model in which all covariates are centered around their neighborhood cluster means. The results from model 5 suggest that when blacks and whites shared the same neighborhoods, they did not have significantly different incident rates of CBR. The CBR gap between Hispanics and whites was also reduced in model 5, with the raw coefficient dropping by 37 percent between models 4 and 5, but the effect remained marginally significant (p<.10). The incidence rate was also significantly lower among second generation immigrants compared to third or higher generations in model 5, but this relationship did not remain significant in subsequent models.
Next we introduced measures of neighborhood disadvantage and affluence, first separately (in models 6 and 7) and then together (in model 8). Interestingly, there were no significant relationships between neighborhood disadvantage and CBR, but neighborhood affluence was associated with significantly lower CBR even after controlling for neighborhood disadvantage in model 8. Moreover, the estimated black-white, Hispanic-white, and educational disparities in CBR were much smaller after controlling for affluence in model 7 than they were after controlling for neighborhood disadvantage in model 6, with only the Hispanic-white difference remaining even marginally statistically significant in models 7 and 8.
DISCUSSION
This study explored the role of neighborhood characteristics in accounting for the cumulative incidence of biological risk factors and social disparities therein. We found that there were significant black/white and Hispanic/white disparities in CBR that were not fully explained by individual-level socioeconomic position and behavioral factors. There were also significant educational differences in the incidence of CBR but these were largely explained by adjustments for individual-level race/ethnicity/immigrant status and behavioral factors. We found no significant associations between individual-level income and CBR in any of our models. We are reluctant to make strong claims about the effects of income on CBR based on this study or findings from previous studies because of the measurement error inherent in survey reports of income and differences in the way studies construct income measures. Still, we note that there is a growing body of research showing that education is more predictive of the onset of chronic conditions, while income is more predictive of the course a condition takes (43).
Perhaps the most striking finding was that the black-white gap in CBR was essentially eliminated after adjusting for neighborhood context, whether by estimating within-neighborhood differences (in Table 4, model 5) or controlling for neighborhood socioeconomic conditions (Table 4, model 8). The Hispanic-white gap in CBR also became substantially smaller and was no longer significant at the .05 level after adjusting for neighborhood affluence or after centering individual-level covariates around their neighborhood means. Thus, one of the central conclusions from our study is that racial/ethnic group differences in neighborhood environments appear to play a pivotal role in generating racial/ethnic disparities in CBR.
In their study of CBR using data from NHANES, Merkin and colleagues (28) noted that there is insufficient overlap between blacks and whites in the distribution of neighborhood socioeconomic status to form adequate black-white comparisons within levels of neighborhood socioeconomic status. This reflects a more general issue, often referred to as “structural confounding,” which is that high levels of race and class segregation in many American cities make it difficult to disentangle individual from contextual effects of socioeconomic factors on health (44-46). Although our study is not immune to this problem, a close inspection of our analytic sample revealed a substantial number of neighborhoods in which both blacks and whites were included in the sample, and considerable overlap between whites and blacks in their distributions of neighborhood socioeconomic conditions. For example, our sample of 549 adults includes 24 blacks and 105 whites in the highest (most affluent) quartile of neighborhood affluence; and 55 blacks and 12 whites in the lowest (least affluent) quartile. We also found comparable representations of blacks and whites at quartiles of the disadvantage scale. For example, our sample of 549 adults includes 24 blacks and 105 whites in the highest (most affluent) quartile of neighborhood affluence; and 55 blacks and 12 whites in the lowest (least affluent) quartile. Even in the extreme quartiles of neighborhood disadvantage and affluence, each major race-ethnic group (whites, blacks, Latinos) never constitutes less than 10% of the sample (or 12+ actual cases). Thus, race-ethnicity is, of course, related to these two neighborhood socioeconomic scales, but not to a degree that precludes validly estimating the effects of all variables. Moreover, our exploratory analysis revealed that there is no significant CBR gap between blacks and whites who live in neighborhoods that occupy quintiles 1 through 3 of the affluence distribution (the lowest levels of neighborhood affluence).
We also assessed the relationship between CBR and two key dimensions of neighborhood socioeconomic differentiation – disadvantage and affluence – and found that only affluence was significantly (and inversely) related to CBR. Most research on neighborhoods and health continues to rely primarily on measures of disadvantage (similar in construction to ours) to characterize neighborhood environments, but a growing number of studies are finding that neighborhood affluence is positively related to health, even after adjusting for neighborhood disadvantage (47-49). The notion that neighborhood affluence and disadvantage may be independently and differently related to CBR (or other health outcomes) is difficult to accept if one considers the two measures to be capturing opposite tails of an underlying continuum of neighborhood socioeconomic position. Alternatively, if one views affluence and disadvantage as capturing somewhat separate dimensions of neighborhood socioeconomic position – much like income, education, and occupational status all represent different dimensions of individual socioeconomic position – then it becomes more conceivable that neighborhood affluence and disadvantage do not always move hand-in-hand.
To further elucidate this finding, we present in Figure 1 a scatterplot of z-scores of neighborhood disadvantage and affluence for all 343 neighborhoods in Chicago, with the 80 neighborhoods used in our sample shown in asterisks. The plot shows that there is substantial variation in affluence among non-disadvantaged neighborhoods, and conversely, substantial variation on disadvantage among less affluent neighborhoods. Our affluence scale may be tapping a critical source of variation among neighborhoods that are not highly disadvantaged. For example, perhaps neighborhoods characterized by the demographic mix that we are calling “affluence” (e.g., those with highly-educated, young adults in professional occupations and high rates of residential mobility) promote better health by attracting certain institutions (e.g., food stores, places to exercise), offering physical features conducive to physical activity (e.g., well-maintained buildings, parks, and streets), and fostering a set of norms that emphasize healthy behaviors (e.g., exercise and good nutrition). This all suggests that future research into the ecological features that differentiate neighborhood affluence and disadvantage could advance our understanding of the specific mechanisms through which neighborhood effects operate on health.
Figure 1.
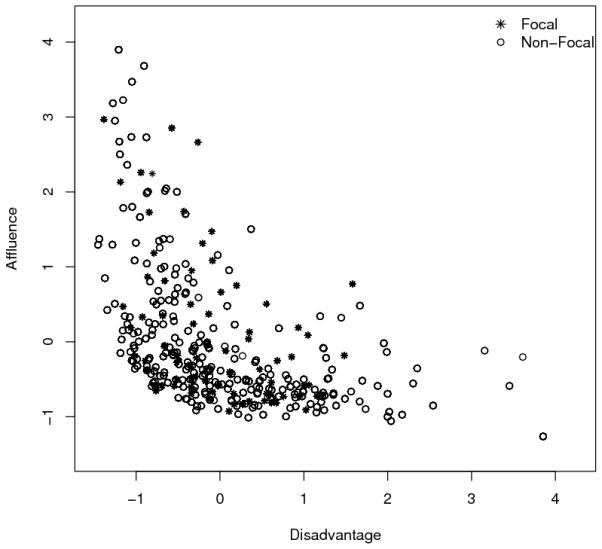
Two Dimensions of Socioeconomic Status in Chicago Neighborhoods (Focal n=80; Non-Focal n=263)
Another aspect of our study that deserves more attention in future research is the benefit and importance of pooling together indicators of high risk from multiple biomarkers into an index of cumulative biological risk. In supplemental analysis, we found that neighborhood affluence was more strongly associated with the CBR index than with any of the separate biomarkers that were used to construct it, suggesting that neighborhood conditions may have a simultaneous influence on multiple biological systems. As a further check on the robustness of our results to changes in the composition of the CBR measure, we repeated the analyses by excluding one biomarker at a time from the cumulative measure; no single measure emerged as especially influential in that findings remained generally consistent across various compositions of the CBR measure.
We also note several important limitations of our study. First, although much of the theory motivating the study of CBR – especially the concept of allostatic load – is about repeated exposure to environmental stimuli that could lead to physiological dysregulation, it is possible that the people who accumulate the most “risk” across a wide range of biomarkers are not the same ones who experience the most chronic “wear and tear” on any given physiological system over time. Fluctuation over time induces biological remediation (50, 51) in a way that our cross-sectional data cannot capture. Moreover, the biomarkers used in our study and many similar studies are secondary, sub-clinical outcomes of the kind of adaptive physiological responses that the body’s regulatory systems make to stress and other adverse stimuli, rather than measures of primary stress mediators(such as hormones secreted by the hypothalamic–pituitary–adrenal axis and sympathetic nervous system). Previous research suggests that aggregate measures of multiple risk factors such as our measure of CBR can be useful in detecting individuals at high risk of clinical diseases and disorders, although significant challenges remain in developing appropriate measures and understanding the biology of stress (23, 52). We also acknowledge that although our sample is large compared to many studies that collect biomarkers, and representative of an important and diverse population (the city of Chicago) it does not provide sufficient power to support more detailed analyses of neighborhood context, including subgroup analyses (e.g., by gender or race/ethnicity). Another important limitation that our study shares in common with all observational research on neighborhoods and health is that there may be unmeasured factors that determine both where people live and how healthy they are. Although we controlled for a fairly broad set of socioeconomic, demographic, and behavioral factors (including additional measures of medical care, wealth, and residential tenure in supplemental analysis) and are aware of no prior research or theory that would identify what omitted variables could confound our results, we nonetheless acknowledge that we cannot make strong causal inferences about neighborhoods from such a study.
We found significant racial/ethnic disparities in cumulative biological risk factors even after controlling for individual sociodemographics and health behaviors, but these disparities disappeared after controlling for neighborhood socioeconomic status. These findings are consistent with the view that neighborhood effects on health risks operate as an accumulation of risks across multiple physiological systems and confirm the importance of both residential context and health behaviors to explaining social disparities in health. They also support the view that neighborhood features associated with affluence may play a protective role not fully captured by the absence of disadvantage. Future research should continue to disentangle the mechanisms through which local socioeconomic conditions influence cumulative health risks.
ACKNOWLEDGMENTS
The authors wish to thank Michael Elliot, Ana Diez-Roux, Rich Mero, Robert Melendez, and Danya Keene for their helpful comments. A prior version of this work was presented at the 2009 Annual Meeting of the Population Association of America. Financial support was provided by the National Institute of Child Health and Human Development of the National Institutes of Health (grant number IR01HD050467 to JSH). The authors gratefully acknowledge use of the services and facilities of the Population Studies Center at the University of Michigan, funded by NICHD Center Grant R24 HD041028. The contents of this paper are solely the responsibility of the authors and do not represent the views of the sponsors.
Abbreviations
- AL
allostatic load
- CBR
cumulative biological risk
- CCAHS
Chicago Community Adult Health Study
- CRP
C-reactive protein
- DBP
diastolic blood pressure
- HbA1c
glycosylated/glycated hemoglobin
- HLM
hierarchical linear models
- HDL
high-density lipoprotein cholesterol
- NHANES
National Health and Nutrition Examination Study
- PHDCN
Project on Human Development in Chicago Neighborhoods
- RHR
resting heart rate
- SBP
systolic blood pressure
- SEBAS
Social Environment and Biomarkers of Aging Study
- TC
total cholesterol
- WS
waist size
Footnotes
This is a PDF file of an unedited manuscript that has been accepted for publication. As a service to our customers we are providing this early version of the manuscript. The manuscript will undergo copyediting, typesetting, and review of the resulting proof before it is published in its final citable form. Please note that during the production process errors may be discovered which could affect the content, and all legal disclaimers that apply to the journal pertain.
Contributor Information
Katherine E. King, Postdoctoral Scholar at Duke University, Population Studies Center University of Michigan
Jeffrey D. Morenoff, Associate Professor, Sociology Research Associate Professor, Population Studies Center and Survey Research Center University of Michigan
James S. House, Angus Campbell Distinguished University Professor of Survey Research, Public Policy, and Sociology University of Michigan
REFERENCES
- 1.Seplaki CL, Goldman N, Weinstein M, Lin YH. How are biomarkers related to physical and mental well-being? Journals of Gerontology Series a-Biological Sciences and Medical Sciences. 2004;59:201–17. doi: 10.1093/gerona/59.3.b201. [DOI] [PubMed] [Google Scholar]
- 2.Seplaki CL, Goldman N, Weinstein M, Lin YH. Measurement of cumulative physiological dysregulation in an older population. Demography. 2006;4:165–83. doi: 10.1353/dem.2006.0009. [DOI] [PubMed] [Google Scholar]
- 3.Seeman TE, Singer BH, Rowe JW, Horwitz RI, McEwen BS. Price of adaptation - Allostatic load and its health consequences - MacArthur studies of successful aging. Archives of Internal Medicine. 1997;157:2259–68. [PubMed] [Google Scholar]
- 4.Sabbah W, Watt RG, Sheiham A, Tsakos G. Effects of allostatic load on the social gradient in ischaemic heart disease and periodontal disease: evidence from the Third National Health and Nutrition Examination Survey. Journal of Epidemiology and Community Health. 2008;62:415–20. doi: 10.1136/jech.2007.064188. [DOI] [PubMed] [Google Scholar]
- 5.Hu PF, Wagle N, Goldman N, Weinstein M, Seeman TE. The associations between socioeconomic status, allostatic load and measures of health in older Taiwanese persons: Taiwan social environment and biomarkers of aging study. Journal of Biosocial Science. 2007;39:545–56. doi: 10.1017/S0021932006001556. [DOI] [PubMed] [Google Scholar]
- 6.Geronimus AT, Hicken M, Keene D, Bound J. “Weathering” and age patterns of allostatic load scores among blacks and whites in the United States. American Journal of Public Health. 2006;96:826–33. doi: 10.2105/AJPH.2004.060749. [DOI] [PMC free article] [PubMed] [Google Scholar]
- 7.Taylor SE, Lerner JS, Sage RM, Lehman BJ, Seeman TE. Early environment, emotions, responses to stress, and health. Journal of Personality. 2004;72:1365–93. doi: 10.1111/j.1467-6494.2004.00300.x. [DOI] [PubMed] [Google Scholar]
- 8.Seeman TE, Singer BH, Ryff CD, Love GD, Levy-Storms L. Social relationships, gender, and allostatic load across two age cohorts. Psychosomatic Medicine. 2002;64:395–406. doi: 10.1097/00006842-200205000-00004. [DOI] [PubMed] [Google Scholar]
- 9.Crimmins EM, Kim JK, Alley DE, Karlamangla A, Seeman T. Is there a Hispanic paradox in biological risk profiles for poor health? American Journal of Public Health. 2007;97:1305–10. doi: 10.2105/AJPH.2006.091892. [DOI] [PMC free article] [PubMed] [Google Scholar]
- 10.Carlson ED, Chamberlain RM. Allostatic load and health disparities: A theoretical orientation. Research in Nursing & Health. 2005;28:306–15. doi: 10.1002/nur.20084. [DOI] [PubMed] [Google Scholar]
- 11.Crimmins E, Kim JK, Seeman TE. Poverty and biological risk: the earlier “aging” of the poor. Journals of Gerontology A: Biological Sciences and Medical Sciences. 2009;64:286–92. doi: 10.1093/gerona/gln010. [DOI] [PMC free article] [PubMed] [Google Scholar]
- 12.Goldman N, Turra CM, Glei DA, Seplaki CL, Lin YH. Physiological dysregulation and changes in health in an older population. Experimental Gerontology. 2006;41:862. doi: 10.1016/j.exger.2006.06.050. [DOI] [PubMed] [Google Scholar]
- 13.Gruenewald TL, Seeman TE, Ryff CD, Karlamangla AS, Singer BH. Combinations of biomarkers predictive of later life mortality. Proceedings of the National Academy of Sciences of the United States of America. 2006;103:14158–63. doi: 10.1073/pnas.0606215103. [DOI] [PMC free article] [PubMed] [Google Scholar]
- 14.Goldman N, Turra C, Glei D, Seplaki C, Lin Y, Weinstein M. Predicting mortality from clinical and nonclinical biomarkers. Journal of Gerontology: Medical Sciences. 2006;61A:1070–4. doi: 10.1093/gerona/61.10.1070. [DOI] [PubMed] [Google Scholar]
- 15.Karlamangla AS, Singer BH, McEwen BS, Rowe JW, Seeman TE. Allostatic load as a predictor of functional decline MacArthur studies of successful aging. Journal of Clinical Epidemiology. 2002;55 doi: 10.1016/s0895-4356(02)00399-2. PII S0895-4356(02)00399-2. [DOI] [PubMed] [Google Scholar]
- 16.Karlamangla AS, Singer BH, Seeman TE. Reduction in allostatic load in older adults is associated with lower all-cause mortality risk: MacArthur studies of successful aging. Psychosomatic Medicine. 2006;68:500–7. doi: 10.1097/01.psy.0000221270.93985.82. [DOI] [PubMed] [Google Scholar]
- 17.Kaestner R, Pearson JA, Keene D, Geronimus AT. Allostatic Load and the Health of Mexican Immigrants. Social Science Quarterly. 2009;9:1089–111. doi: 10.1111/j.1540-6237.2009.00648.x. [DOI] [PMC free article] [PubMed] [Google Scholar]
- 18.Crews DE. Biocultural influences on variations in allostatic load across populations. American Journal of Human Biology. 2003;15:10. [Google Scholar]
- 19.Peek MK, Cutchin MP, Salinas JJ, Sheffield KM, Eschbach K, Stowe RP, Goodwin JS. Allostatic Load Among Non-Hispanic Whites, Non-Hispanic Blacks, and People of Mexican Origin: Effects of Ethnicity, Nativity, and Acculturation. American Journal of Public Health. 2009;99:1–7. doi: 10.2105/AJPH.2007.129312. [DOI] [PMC free article] [PubMed] [Google Scholar]
- 20.Geronimus AT, Bound J, Waidmann TA, Colen CG, Steffick D. Inequality in life expectancy, functional status, and active life expectancy across selected black and white populations in the United States. Demography. 2001;38:227–51. doi: 10.1353/dem.2001.0015. [DOI] [PubMed] [Google Scholar]
- 21.McEwen B, Stellar E. Stress and the individual. Mechanisms leading to disease. Arch Intern Med. 1993;153:2093–101. [PubMed] [Google Scholar]
- 22.McEwen B, Seeman T, Allostatic Load Working Group Allostatic Load and Allostasis. 2009 Available from: http://www.macses.ucsf.edu/research/allostatic/allostatic.php.
- 23.Juster RP, McEwen BS, Lupien SJ. Allostatic load biomarkers of chronic stress and impact on health and cognition. Neuroscience and Biobehavioral Reviews. 2009 doi: 10.1016/j.neubiorev.2009.10.002. doi:10.1016/j.neubiorev.2009.10.002. [DOI] [PubMed] [Google Scholar]
- 24.Kubzansky LD, Kawachi I, Sparrow D. Socioeconomic status, hostility, and risk factor clustering in the normative aging study: Any help from the concept of allostatic load? Annals of Behavioral Medicine. 1999;21:330–8. doi: 10.1007/BF02895966. [DOI] [PubMed] [Google Scholar]
- 25.Weinstein M, Goldman N, Hedley A, Lin Y-H, Seeman T. Social linkages to biological markers of health among the elderly. Journal of Biosocial Science. 2003;35:433–53. doi: 10.1017/s0021932003004334. [DOI] [PubMed] [Google Scholar]
- 26.Seeman T, Merkin SS, Crimmins E, Koretz B, Charette S, Karlamangla A. Education, income and ethnic differences in cumulative biological risk profiles in a national sample of US adults: NHANES III (1988-1994) Social Science & Medicine. 2008;66:72–87. doi: 10.1016/j.socscimed.2007.08.027. [DOI] [PMC free article] [PubMed] [Google Scholar]
- 27.Bird CE, Seeman T, Escarce JJ, Basurto-Davila R, Finch B, Dubowitz T, Heron M, Hale L, Merkin SS, Weden M, Lurie N. Neighborhood Socioeconomic Status and Biological “Wear & Tear” in a Nationally Representative Sample of U.S. Adults: Cross-Sectional Study. Journal of Epidemiology and Community Health. 2009 doi: 10.1136/jech.2008.084814. [DOI] [PMC free article] [PubMed] [Google Scholar]
- 28.Merkin SS, Basurto-Davila R, Karlamangla A, Bird CE, Lurie N, Escarce J, Seeman T. Neighborhoods and Cumulative Biological Risk Profiles by Race/Ethnicity in a National Sample of U.S. Adults: NHANES III. Annals of Epidemiology. 2009;19:194–201. doi: 10.1016/j.annepidem.2008.12.006. [DOI] [PMC free article] [PubMed] [Google Scholar]
- 29.Morenoff JD, House JS, Hansen BB, Williams D, Kaplan G, Hunte H. Understanding social disparities in hypertension prevalence, awareness, treatment, and control: The role of neighborhood context. Social Science & Medicine. 2008;65:1853–66. doi: 10.1016/j.socscimed.2007.05.038. [DOI] [PMC free article] [PubMed] [Google Scholar]
- 30.Sampson RJ, Raudenbush SW, Earls F. Neighborhoods and violent crime: A multilevel study of collective efficacy. Science. 1997;227:918–24. doi: 10.1126/science.277.5328.918. [DOI] [PubMed] [Google Scholar]
- 31.Sampson RJ, Raudenbush SW. Systematic Social Observation of Public Spaces: A New Look at Disorder in Urban Neighborhoods. American Journal of Sociology. 1999;105:603–51. [Google Scholar]
- 32.Chobanian A, Bakris G, Black H, Cushman W, Green L, Jr., JI Seventh report of the Joint National Committee on Prevention, Detection, Evaluation, and Treatment of High Blood Pressure. Hypertension. 2003;42 doi: 10.1161/01.HYP.0000107251.49515.c2. al. e. [DOI] [PubMed] [Google Scholar]
- 33.Seccareccia F, Pannozzo F, Dima F, Minoprio A, Menditto A, Noce CL. Heart rate as a predictor of mortality: the MATISS project. American Journal of Public Health. 2001;91:1258–63. doi: 10.2105/ajph.91.8.1258. al. e. [DOI] [PMC free article] [PubMed] [Google Scholar]
- 34.Golden S, Boulware L, Berkenblit G, Brancati F, Chandler G, Marinopoulos S. Use of glycated hemoglobin and microalbuminuria in the monitoring of diabetes mellitus. Evidence Report - Technology Assessment. 2003;84 al. e. [PMC free article] [PubMed] [Google Scholar]
- 35.Osei K, Rhinesmith S, Gaillard T, Schuster D. Is glycosylated hemoglobin A1c a surrogate for metabolic syndrome in nondiabetic, first-degree relatives of African-American patients with type 2 diabetes? Journal of Clinical Endocrinology and Metabolism. 2003;88:4596–601. doi: 10.1210/jc.2003-030686. [DOI] [PubMed] [Google Scholar]
- 36.Ridker PM. C-reactive protein: A simple test to help predict risk of heart attack and stroke. Circulation. 2003;108 doi: 10.1161/01.CIR.0000093381.57779.67. [DOI] [PubMed] [Google Scholar]
- 37.National Cholesterol Education Program (NCEP) Expert Panel Executive Summary of the Third Report of the National Cholesterol Education Program Expert Panel on Detection, Evaluation and Treatment of High Blood Cholesterol in Adults (Adult Treatment Panel III) The Journal of the American Medical Association. 2001;285:2486–97. doi: 10.1001/jama.285.19.2486. [DOI] [PubMed] [Google Scholar]
- 38.Abbott R, Wilson P, Kannel W, Castelli W. High density lipoprotein cholesterol, total cholesterol screening, and myocardial infarction:The Framingham Study. Arteriosclerosis. 1988;8:207–11. doi: 10.1161/01.atv.8.3.207. [DOI] [PubMed] [Google Scholar]
- 39.Guagnano MT, Ballone E, Colagrande V, Vecchia RD, Manigrasso MR, Merlitti D, Riccioni G, Sensi S. Large waist circumference and risk of hypertension. International Journal of Obesity. 2001;25:1360–4. doi: 10.1038/sj.ijo.0801722. [DOI] [PubMed] [Google Scholar]
- 40.UCLA: Academic Technology Services Statistical Consulting Group [December 29, 2010];Stata Annotated Output: Poisson Regression. Available from: http://www.ats.ucla.edu/stat/stata/output/stata_poisson_output.htm.
- 41.Cox DR, Hinkley DV. Theoretical statistics. Chapman and Hall; London: 1974. [Google Scholar]
- 42.Breslow NE, Day NE. Statistical Methods in Cancer Research. Volume 1: The Analysis of Case-Control Studies. International Agency for Research on Cancer; Lyon, France: 1980. [Google Scholar]
- 43.Herd P, Goesling B, House JS. Socioeconomic Position and Health: The Differential Effects of Education versus Income on the Onset versus Progression of Health Problems. Journal of Health and Social Behavior. 2007;48:223–38. doi: 10.1177/002214650704800302. [DOI] [PubMed] [Google Scholar]
- 44.Oakes JM. Commentary: Advancing neighbourhood-effects research--selection, inferential support, and structural confounding. International Journal of Epidemiology. 2006;35:643–7. doi: 10.1093/ije/dyl054. [DOI] [PubMed] [Google Scholar]
- 45.Messer L, Oakes J, Mason S. Effects of socioeconomic and racial residential segregation on preterm birth: a cautionary tale of structural confounding. American Journal of Epidemiology. 2010;171:664–73. doi: 10.1093/aje/kwp435. [DOI] [PubMed] [Google Scholar]
- 46.Morenoff JD, Roux AVD, Hansen BB, Osypuk TL. Residential Environments and Obesity: How Can Observational Studies Inform Policy Interventions? In: Schoeni RF, House JS, Kaplan GA, Pollock H, editors. Making Americans Healthier: Social and Economic Policy as Health Policy. Russell Sage Foundation; New York: 2008. pp. 309–43. [Google Scholar]
- 47.Wen M, Browning C, Cagney K. Poverty, Affluence, and Income Inequality: Neighborhood Economic Structure and Its Implications for Health. Social Science & Medicine. 2003;57:843–60. doi: 10.1016/s0277-9536(02)00457-4. [DOI] [PubMed] [Google Scholar]
- 48.Browning CR, Cagney KA, Wen M. Explaining variation in health status across space and time: implications for racial and ethnic disparities in self-rated health. Social Science and Medicine. 2003;57:1221–35. doi: 10.1016/s0277-9536(02)00502-6. [DOI] [PubMed] [Google Scholar]
- 49.Freedman VA, Grafova IB, Schoeni RF, Rogowski J. Neighborhoods and disability in later life. Social Science & Medicine. 2008;66:2253–67. doi: 10.1016/j.socscimed.2008.01.013. [DOI] [PMC free article] [PubMed] [Google Scholar]
- 50.McEwen BS. Stress, adaptation, and disease: allostasis and allostatic load. Annals of the New York Academy of Sciences. 1998;840:33–44. doi: 10.1111/j.1749-6632.1998.tb09546.x. [DOI] [PubMed] [Google Scholar]
- 51.McEwen BS. Central effects of stress hormones in health and disease: understanding the protective and damaging effects of stress and stress mediators. European Journal of Pharmacology. 2008;583:174–85. doi: 10.1016/j.ejphar.2007.11.071. [DOI] [PMC free article] [PubMed] [Google Scholar]
- 52.McEwen BS, Seeman T. Protective and Damaging Effects of Mediators of Stress: Elaborating and Testing the Concepts of Allostasis and Allostatic Load. Annals of the New York Academy of Sciences. 1999;896:30–47. doi: 10.1111/j.1749-6632.1999.tb08103.x. [DOI] [PubMed] [Google Scholar]