

Abstract
Diabetes is a major risk factor of stroke and is associated with increased frequency of stroke and a poorer prognosis for recovery. In earlier studies we have utilized Type 2 diabetic mouse models of stroke and demonstrated that diabetic db/db and ob/ob mice experience larger infarct volumes and impaired recovery associated with greater infiltration of macrophage following hypoxic-ischemic (H/I) insult than their heterozygous non-diabetic db/+ & ob/+ littermates. To obtain a better understanding of the pathogenesis of the impaired recovery, we have investigated the role of matrix metalloproteases and their endogenous inhibitors in the breakdown of the blood-brain barrier (BBB) following H/I. Diabetic db/db mice showed a significant and more rapid increase in MMP-9 mRNA, protein and gelatinolytic activity compared to db/+, which resulted in an increased degradation of occludin & collagen IV and subsequently an increased BBB permeability and greater infiltration of neutrophils into the infarct area. The expression of the MMPs, especially in the db/+ mice, is preceded by an elevated expression of their endogenous tissue inhibitors of metalloproteases (TIMPs) 1, 2, & 3, while in the db/db mice, a lower expression of the TIMPs is associated with greater MMP 3 & 9 expression. These results suggest that an imbalance in the MMPs/TIMPs cascade in the diabetic mouse, particularly MMP-9, results in a greater neutrophil invasion, a compromised BBB and consequently a greater insult.
Keywords: Stroke, Type 2 Diabetes, Metalloproteases, Tissue Inhibitors of Metalloproteases, Blood-Brain Barrier, Neutrophil
Introduction
Diabetes continues to expand exponentially in the American population and worldwide it is projected that it will affect 439 million by the year 2030 (Shaw et al. 2010; Wild et al. 2004). With this dramatic increase in the numbers of diabetic patients and their 4–6 fold increased risk of stroke, we can predict a corresponding increase in the frequency with which they experience stroke and the attendant complications that arise during recovery (Hossain et al. 2007; Ferland-McCollough et al. 2010). In previous studies, we and others have investigated the effects of Type 2 diabetes on stroke recovery in db/db and ob/ob mice (Tureyen et al. 2011; Vannucci et al. 2001; Kumari et al. 2010). We demonstrated that compared to their heterozygous non-diabetic littermates, both db/db and ob/ob mice experience an increased stroke-induced damage which was associated with a compromised inflammatory response and subsequent impaired recovery (Zhang et al. 2004; Kumari et al. 2007; Kumari et al. 2010).
Recovery from a cerebral injury such as a stroke often requires significant tissue remodeling which entails the activation of various matrix metalloproteases (Amantea et al, 2007). MMPs are zinc and calcium-dependent endopeptidases, and while they are essential for remodeling, MMP-9 and MMP-2 have also been specifically implicated in the disruption of the blood-brain barrier (BBB) integrity and neuronal cell death following cerebral ischemia (Bonior et al, 2009; Zhou et al, 2011). The increased plasma MMP-9 level and the presence of MMP-9 in human brain sections after both ischemic and hemorrhagic stroke further support a role for MMP-9 in the pathophysiology of stroke (Clark et al. 1997; Montaner et al. 2001). Additionally, broad spectrum MMP inhibitors such as BB-94 and BB-1101 have been shown to reduce infarct size and restore the BBB integrity in rodent stroke models (Asahi et al. 2000; Rosenberg et al. 2007). The cellular source of this protease has not been firmly established. Some reports suggest a CNS origin with endothelial cells, microglia, and/or neurons as the source, whereas others suggest a peripheral origin from neutrophils and other leukocytes (Asahi et al. 2000; Magnoni et al. 2004). The proteolytic activities of MMPs are regulated by tissue inhibitors of metalloproteases (TIMPs) which are natural inhibitors found in most tissues and body fluids, that in conjunction with the MMPs, play a significant role in normal growth, development, cellular signaling and tissue repair in the CNS (Dzwonek et al. 2004; Lambert et al. 2004). TIMP-1 and TIMP-2 inhibit the gelatinolytic activity by forming non-covalent complexes with MMP-9 and MMP-2, respectively. However, more recently TIMP-3 has been proposed to play a central role in controlling MMP-9 activity by inhibiting the enzyme MMP-3 that is responsible for activating MMP-9, and inhibiting the inflammatory response by reducing TACE (TNFα converting enzyme), thus modulating the TNFα release (Rosenberg 2009).
The present study was undertaken to determine the role MMP-9 plays in the BBB breakdown in the db/+ and db/db mice following a stroke and to investigate its involvement in the subsequent impaired recovery in diabetic mice. We observed greater MMP-9 expression and gelatinolytic activity in the ipsilateral hemisphere of the diabetic db/db mice compared to their non-diabetic db/+ littermates following a stroke. This increased activity was independent of infarct volume and was associated with a greater degradation of tight junction protein, occludin and the basement membrane protein, collagen IV, increased BBB permeability, and increased neutrophil invasion in the db/db mice. Accompanying the increased gelatinolytic activity was a corresponding reduction in expression of the protease inhibitors TIMPs 1&3 compared to their non-diabetic littermates.
Materials and methods
Mouse model of stroke
All surgical procedures were performed according to The Pennsylvania State University College of Medicine Institutional Animal Care and Use Committee. All living conditions of animals are consistent with the standard required by AAALAC International (Association for Assessment and Accreditation of Laboratory Animal Care). Male non-diabetic db/+ and diabetic db/db mice (BKS.Cg-Dock7M+/+Lepr db/J) were purchased from Jackson laboratories (Jackson Laboratories Bar Harbor, Maine) at 7 weeks of age. All mice were fed food and water ad libitum. Age matched non-diabetic controls alleviate any concern relative to strain differences in the ischemic response that can be significant in mice. Blood glucose was measured in db/+ & db/db mice (184.1±10.32 vs 560.9± 39.1 mg/dl) by pricking tail vein, two days before inducing stroke. Hypoxia – ischemia (H/I) was induced in 8-week old db/db and db/+ mice by the methods established by Vannucci et al with slight modifications (Vannucci et al. 2001). In brief, mice were exposed to isoflurane (3.5% induction and 2% maintenance) in 30% oxygen/70% nitrous oxide. A small midline neck incision was made and the right carotid artery was exposed and ligated twice using 3-O surgical silk. The incision was sutured and the animals were returned to their cages (3mice/cage) for 3 hours of recovery to minimize the neuroprotective effect of isoflurane (Chen et al. 2009). All wounds were infiltrated with lidocaine to reduce any potential discomfort to the animal due to post surgical pain. The mice were exposed to a humidified gas mixture of 8% O2 balanced with N2 for 20 minutes. The major advantages of this model are that animals are conscious during the stroke, the extent of the insult may be adjusted by altering the hypoxia exposure, and most importantly there is low mortality rate of 20%. Mice were sacrificed at 4, 8, 24 and 48 hr following H/I and the brains were divided into contralateral and ipsilateral hemispheres, quickly frozen in −36°C isopentane, and stored at −80°C until analysis. The numbers of mice used in each set of experiment is indicated in the text and respective legends.
Histological Analysis
TTC staining was performed after 48 hr of recovery in order to match the db/+ & db/db mice (n=23–24/group) brain samples according to their grade of damage for zymogram & Western blot analysis. Two mm thick brain sections were obtained at the level of the anterior hippocampus for TTC staining as described earlier (Zhang et al. 2004), another 4 mm adjacent section was collected and divided into contralateral and ipsilateral hemisphere for zymogram (n=3–6/group) and Western blot analysis (n=9/group).
Zymogram Analysis
Brain tissue samples collected at 24 & 48 hr of H/I recovery from both contralateral and ipsilateral hemispheres were homogenized in lysis buffer (50 mmol/L Tris-HCl, pH 7.4, 150 mmol/L NaCl, 1% Nonidet P-40, 0.1% deoxycholic acid) including a protease inhibitors cocktail on ice (Asahi et al. 2000). After centrifugation, the supernatant was collected and total protein concentration was measured using the BCA protein assay kit. For SDS-PAGE zymogram, 10 µl of 2× Laemmli buffer was added to 10 µl of sample (30 µg total proteins) and separated by 7.5% Tris-Glycine gel containing 0.1% gelatin as substrate. After separation, the gel was incubated for 1 hr at RT in 2.5 % TritonX-100, and the solution was changed every 20 minutes. Then gel was incubated with developing buffer (for 20 hr at 37°C) and stained with 0.5% Coomassie Blue R-250 for 30 min and destained to visualize the clear band. Images were captured by Fuji LAS-3000 system and analyzed after inversion using the Multi gauge software program 3.0 (Fujifilm Life Science System, Valhalla, NY, USA) To account for gel to gel variations, the values from each sample lane were normalized to a MMP-positive sample in the same gel (Devraj et al. 2009).
Western Blotting
From the above sample preparation, 30 µg (3mg/ml) of protein was separated on a 7.5% Tris-Glycine SDS-PAGE gel, transferred to PVDF membrane, and blotted with goat anti-mouse-MMP-9 antibody 1:500 dilution, (R&D System, Minneapolis, USA). For occludin & collagen Western blotting, brain samples (n=6/group) were collected at 24 hr of recovery and homogenized in lysis buffer and ultra centrifuged at 70,000× g for 1 hour. The pellets were sonicated in lysis buffer before performing the protein assay. Then 50 µg (5mg/ml) of protein was mixed with 2 × Laemmli buffer, boiled for 5 minutes and resolved on a 10% SDS-PAGE gel and incubated with rabbit anti- occludin, 1:1000 dilution (Invitrogen Corporation, CA, USA). Similarly for collagen IV Western blotting, 50 µg of membrane protein was incubated with 2.5× volume of solubilizing buffer (8M Urea, 5% SDS and 50 Mm Tris) for 2 hr at room temperature without boiling or reducing agent and resolved at 7% SDS-PAGE gel and blots were incubated with rabbit polyclonal anti collagen IV, 1:3000 dilution (Abcam Inc., Cambridge, MA). After secondary antibody incubation, blots were visualized by enhanced chemiluminescence (ECL kit, Perkin Elmer, MA, USA) in a Fuji LAS-3000 system. Images were captured and the band intensity was measured by the Multi gauge software program 3.0. To minimize the gel-to-gel variations, each band was normalized to the same positive control sample, loaded in each gel before presenting the data as a ratio to contralateral protein levels.
BBB Permeability Assay
In another set of db/+ & db/db mice (n=5/group), the extent of BBB breakdown was determined at 48 hr of H/I recovery. One hundred µl of Alexa Fluor 488 dye conjugated to bovine serum albumin (100 µg/kg; Molecular Probes, Invitrogen Detection Technologies, CA, USA) was injected via the tail vein. After 30 min of circulation, the mice were anesthetized, transcardially flushed with PBS, and perfused/fixed with 4% paraformaldehyde. Brains were frozen for H& E staining and confocal microscopy.
Confocal Microscopy
H & E staining was performed to determine the extent of cell death on 16 µm sections from the respective brains at a particular region and the adjacent sections were stained with Hoechst nuclear stain to allow for identification of brain areas, as well as visualization of leakage of the fluorescent dye from microvessels using confocal microscopy (Olympus Fluoview 1000 1.7) at absorption and fluorescence maxima of approximately 494 nm and 519 nm respectively. In order to make comparable observations between db/+ and db/db mice, each image was captured and adjusted systematically to a medium intensity histogram.
Imuunohistochemistry
At 24 h post H/I, db/+ and db/db mice (n=11–15/group) were perfused and fixed with 4% paraformaldehyde and brains were post-fixed with 4% paraformaldehyde and cryoprotected in 15% and 30% sucrose overnight. Endogenous peroxidase activity in 50 µm free floating sections were quenched by 0.5% H2O2 and blocked with 10% normal goat serum (NGS)/0.3% TritonX-100 for 1hr at RT and then incubated with the rat anti-mouse 7/4 antibody (AbD Serotec), diluted 1:100 in 3% NGS/0.3% TritonX-100, overnight. The following day, sections were incubated with secondary antibody (1:500) conjugated to horseradish peroxidase (HRP) (Hirsch and Gordon 1983). Positive reactivity was determined by using DAB (Vector Laboratories) and images were captured by Olympus BX-50 microscope using Spot Advance software (SPOTTM Imaging Solution, Sterling Heights, MI, USA).
Occludin immunohistochemistry was performed on 16 µm fresh frozen brain sections. Sections were first allowed to come to room temperature, post fixed with 2% paraformaldehyde for 10 min and then blocked with 0.3% Triton/10% NGS for 1 hr, after which they were incubated with the mouse anti-mouse occludin, (1:150, Invitrogen, Camarillo, CA) overnight. The next day, sections were incubated for 1 hr with goat anti-mouse IgG conjugated with Rhodamine (Jackson ImmunoResearch, West Grove, PA) and DAPI, diluted 1:25 and 1:1000 in 10% NGS/0.3% Triton. Images were captured using confocal microscopy (Olympus Fluoview 1000 1.7) at fluorescence maxima of approximately 594 nm at 40× magnification.
RT-PCR
Quantitation of MMP-9, MMP-3, MMP-2, TIMP-1, TIMP-2 and TIMP-3 mRNA expression was carried out by RT-PCR at different time point, baseline, 4, 8, 24 & 48 hr (n= 4 – 6/group) of H/I recovery sample. RNA was isolated from both hemispheres, cDNA template was made, and RT-PCR was performed for mouse specific MMP-9 primer (Applied Biosystems Branchburg, NJ), as described earlier (Kumari et al, 2010). MMP-2, MMP-3, TIMP-1, TIMP-2 and TIMP-3 and GAPDH primers were synthesized (Integrated DNA Technologies Inc., CA, USA) based on the sequence published by Singh et al (Singh et al. 2004). Quantitative RT-PCR was performed in triplicate utilizing a 384 well plate (Applied Biosystems). Each 10 µl reaction volume contained 2 µl of cDNA template, 2.0 µl of DEPC water, and 6µl of SYBR Green master mix, which contained 0.5 µl primers, 900 nM of each forward and reverse primer. RT-PCR plates were placed in the Applied Biosystems 7900 HT PCR system and the data was analyzed by Sequence Detecting System.
Statistical Methods
Data were analyzed by Graph Pad Prism 5.0 (Graph Pad Software Inc., San Diego, CA, USA) and presented as mean ± SEM. One-way analysis of variance followed by Tukey’s multiple comparisons was used to assess differences between groups and a two tailed null hypothesis was applied to compare the slope of two linear regression lines for Western blot analysis. Relative Expression Software Tool (REST, Goteborg, Sweden) was used to analyze significance in mRNA expression.
This manuscript has been prepared according to “The ARRIVE Guidelines”.
Results
Blood-brain barrier permeability in diabetic mouse brain following H/I
Disruption of the BBB is a frequently observed phenomenon following stroke, and hyperglycemia exaggerates this dysfunction (Dietrich et al. 1993). In previous studies, we observed significant tissue damage and a greater invasion of macrophage in the diabetic db/db mouse brain following H/I (Zhang et al. 2004; Kumari et al. 2007). In this study we measured BBB permeability in the diabetic mouse brain by injecting a fluorescently tagged albumin following H/I. The leakage of dye was compared in the different brain regions of db/+ and db/db mice at 48 hr following H/I. H & E stained sections of the mouse brains and the corresponding section showing albumin leakage at 48 hr of recovery are illustrated in Figure 1. Extensive leakage was observed in the ipsilateral hemisphere of the diabetic mouse brains compared to the corresponding control mice, particularly in the cortex, striatum and to a lesser extent in the thalamus. A similar pattern of BBB disruption was observed in cortical and subcortical areas of rat brain after 24 hr of reperfusion (Zhou et al. 2011). To determine the underlying cause(s) for the increased BBB permeability in diabetic mouse brain following H/I, we explored the role of matrix metalloproteases and their endogenous inhibitors.
Figure 1. Blood-brain barrier permeability in db/+ and db/db mice following H/I.
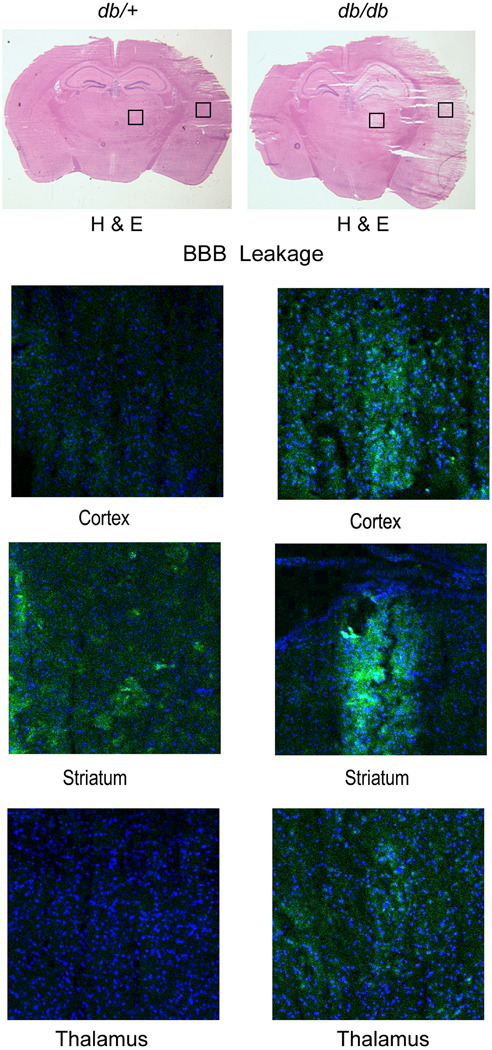
To measure the BBB permeability, fluorescent alexa fluor 488-conjugated albumin (100µg/kg) was injected into the tail vein of db/+ and db/db mice after 48 hr of recovery from H/I. The upper half of Figure 1, shows H&E staining to illustrate the extent of the infarct in the control and diabetic mice. The lower half of Figure 1 confocal microscopic images illustrate the typical extent of the BBB leakage of the fluorescent albumin (green) and Dappi nuclear staining (in blue), in the corresponding adjacent section (n=5/group).
MMPs gelatinolytic activity following hypoxia-ischemia
The most obvious cause of a breakdown of the BBB is the release of the specific proteases. To confirm this hypothesis, we performed zymogram analysis. Figures 2A & 2B illustrate typical levels of tissue loss at 48 hr of recovery after TTC staining in db/db and db/+ mice and stroke size measurement (31.12 ± 5.33% vs 12.68 ± 3.72, p<0.05) following H/I. Figure 2C illustrates a typical zymogram of tissue derived from the corresponding contralateral and ipsilateral hemispheres of db/+ and db/db mice at 48 hr of recovery. The major geltinolytic activity in both db/+ and db/db mice corresponds to MMP-9. As indicated in Figure 2D, MMP-9 activity in db/+ ipsilateral hemispheres increased 4-fold relative to corresponding contralateral, whereas a 7-fold increase was observed in the db/db mice. The onset of gelatinolytic activity of MMP-9 was observed at 6 & 12 hr of recovery in the db/db mice as reported earlier (Asahi et al. 2001a) however, the band was relatively faint (data not shown). To minimize inter- and intra-gel variation, background corrections were made for individual lanes and band intensity was normalized to an internal positive control.
Figure 2. MMP-9 gelatinolytic activity following H/I: Zymogram Analysis.


Figures 2A & 2B illustrate typical cell loss in db/+ and db/db mice brains by TTC staining following 48 hr H/I. The corresponding results are expressed as percentage area of infarction in Figure 2B. Data are mean ± SEM (n=23–24/ group). *p<0.05 vs db/+.  db/+ ■ db/db
Figure 2C represents a typical zymogram obtained from extracts of contralateral (C) and ipsilateral (I) hemispheres of db/+ and db/db mice brain after 48 hr of hypoxic-ischemic recovery. A clear band was observed, at ~92kDa that corresponds to MMP-9 Fig. 2D illustrates significantly greater MMP-9 proteolytic activity in ipsilateral hemispheres of the db/db mice as compared to the db/+ mice. Results are expressed as mean ± SEM (n=3). Significance denoted as *p<0.05 vs db/+(C), # p<0.05 vs db/db (C). db/+(C)  db/+(l)
  db/db (C) ■ db/db (l)
Figure 2E. Zymogram Analysis: Gradation of tissue damage.
Figure 2E provides a comparison of MMP-9 gelatinolytic activity in db/db and db/+ mice brains with different degrees of damaged tissue. Samples were selected based on the TTC measurement as described in Method section. Increased MMP-9 gelatinolytic activity is correlative with the percentage increase in infarction, but is significantly greater in the db/db. Results are expressed as mean � SEM (n=3–6/group). *p<0.05 vs db/+. db/+ ■ db/db
The increased MMP-9 gelatinolytic activity in db/db mice raised the question as to whether this is due to the larger infarct in db/db mice or is inherent to the diabetic state. To address this question, we collected brains after 48 hr of recovery. TTC staining was performed on a 2 mm section at the level of the anterior hippocampus to measure the infarct area and a 4 mm adjacent section was divided into contralateral and ipsilateral for zymogram analysis. Brains from both db/+ and db/db mice were graded according to infarct area. We considered an infarct area 0–20% as mild, 20–40% as moderate, and greater than 40% as severely damaged. The average lesion area as a percentage of the corresponding contralateral hemispheres in mild db/+ & db/db group was 14.81 ± 2.74 vs 9.95 ± 1.17mm2, moderate (25.96 ± 2.07 vs 39.42 ± 2.7 mm2, p<0.05) and severe (52.7±6.69 vs 57.82±1.97 mm2). In db/+ group, out of a total of 24 mice, 11 showed no damage, 4 (<20%), 5 (<40%) and 4 (>40%) whereas in 23 db/db mice, 6 showed no damage, 3 (<20%), 4 (20–40%) and 10 mice (>40%). The statistical difference in lesion size was only observed in the moderate db/db group compared to db/+.
The gelatinase activity of MMP-9 was expressed as a ratio to the positive control, as illustrated in Figure 2E. We detected a 2-fold increase in gelatinase activity between the mild to moderate stroke groups in the db/+ mice and this activity was unchanged in the severely damaged brains. The db/db mice enzyme activity ratio was also increased 2-fold from mild to moderate stroke, but was further increased 4-fold in the severe stroke group. This result clearly indicates inherently higher MMP-9 activity in the ipsilateral hemispheres of db/db compared to db/+ mice following a stroke that is independent of infarct size.
Effect of H/I on MMP-9 protein expression
To quantitate more accurately the levels of MMP-9 protein, we performed Western blot analysis in db/+ and db/db brains obtained at 24 and 48 hr of stroke recovery. A sharp band was observed at approximately 92 kDa in the ipsilateral hemispheres of db/db mice in both 24 & 48 hr brain db/db mice samples, whereas in db/+, the band was only detected at 48 hr (Data not shown). Figure 3A, shows a typical Western blotting of MMP-9 in both contralateral & ipsilateral hemispheres of db/+ & db/db in the matched stroke size sample at 48 hr of hypoxic-ischemic recovery and Figure 3B illustrates the relationship between infarct size and MMP-9 protein expression. Both db/+ & db/db brains exhibit a relationship between infarct size and MMP-9 protein levels; however, the levels of MMP-9 are greater in all gradations of injury in db/db mice compared to their db/+ counterparts suggesting that an additional element in the db/db mice results in an increased MMP-9 level that is independent of infarct volume.
Figure 3. MMP-9 protein levels: Western blot analysis.

Figure 3A is a typical Western blot of MMP-9 protein expression in the contralateral (C) and ipsilateral (I) hemispheres of db/+ and db/db mice brain following 48 hr of H/I. The levels of MMP-9 are greater in ipsilateral hemispheres of db/db mice compared to db/+ and are detected earlier (not shown).
Figure 3B demonstrates a linear relationship between MMP-9 protein expression & tissue damage following stroke. A linear regression line was plotted for percentage infarction vs protein
expression in db/+ and db/db mice. The slope of the diabetic group was significantly greater than control. Two tailed null hypothesis was applied to find out the significance between two slopes. Result is expressed as mean ± SEM (n=9/group). *p<0.05 vs db/+.  db/+ ■ db/db
RT-PCR analysis of MMPs and TIMPs mRNA expression following H/I
MMP-9 activity is carefully regulated by both proteases and tissue inhibitors of metalloproteases as shown in Figure 4. TIMP-3 controls MMP-3 release, which in turn converts proMMP-9 to MMP-9 that ultimately leads to BBB disruption. TIMP-3 also regulates MT-MMP (MMP-14), which causes conversion of pro MMP-2 to MMP-2 and participates in BBB leakage along with MMP-9.
Figure 4. TIMP-3 is a central regulator.

Figure 4 illustrates the central role TIMP-3 plays in controlling MMP-9 & MMP-2 release by inhibiting MMP-3 and MT-MMP and controls TNFα release via TACE (TNFα converting enzyme) inhibition. This figure was adopted from Lancet Neurology, 2009 Feb 8 (2) ; 205–215 with the permission from Elsevier Inc., MA, USA.
To determine which of the activities might be altered in the diabetic mice, we measured the expression of the metalloproteases (MMP-9, MMP-2 & MMP-3) and their endogenous inhibitors (TIMP-1, TIMP-2 & TIMP-3) in the contralateral and ipsilateral hemispheres of db/+ and db/db mice at baseline and 4, 8, 24 & 48 hr following H/I. We did not observe any mRNA expression in baseline animals except TIMP-2. TIMP-2 expression was less in db/db but not significantly different to db/+. It should be noted that some up-regulation of TIMP-3 mRNA was observed in the contralateral hemisphere as early as 4 hr, however the increases were small compared to the levels in the ipsilateral hemisphere and thus we have expressed the data as a ratio of respective ipsilateral: contralateral expression.
As shown in Figure 5, the expression of the tissue inhibitor metalloproteases 1 & 3 were significantly reduced in db/db at 4 & 8 hr of stroke recovery compared to the db/+ mice. TIMP-1 mRNA expression was about 2-fold higher in db/+ at 4 & 8 hr whereas TIMP-3 mRNA was 4.3-fold higher at 4 hr and increased to 6.7 -fold by 8 hr in db/+ compared to db/db mice. There was no significant difference in TIMP-3 mRNA expression between the two groups at 24 and 48 hr. In contrast to the rapid changes in TIMP expression, we did not observe any significant difference in MMP expression at 4 hr of recovery between db/+ and db/db, and only at 8 hr was a 4-fold increase in MMP-3 mRNA expression in the db/db mice observed. An increasing MMP-9 mRNA expression was apparent at 8 hr in db/db mice and by 24 hr it was increased 2.6 fold over that of db/+. Expression returned to control levels in both db/db and db/+ mice by 48 hr, as indicated in Figure 5. There also appears to be a delay in the up-regulation of MMP-9 compared to MMP3 between 8 and 24 hr in the db/db mice that may reflect the expression of the TIMPs. For example, there is an early expression of TIMP-3 in db/+ mice that does not occur in db/db at any time point, which may well explain the greater expression of MMP-3 at 8 hr and the ultimate up-regulation of MMP-9 at 24 hr. Similarly the reduced expression of TIMP-1 and TIMP-2 in diabetic mice early in recovery could clearly contribute to the increased MMP-9 & MMP-2 release in db/db mice and although we did not see any significant difference in the level of increase in MMP-2 mRNA expression in the control and diabetic mice during recovery, the expression of its specific inhibitor TIMP-2 was 2-fold higher in db/+ mice at 8 hr.
Figure 5. Time course of MMPs and TIMPs mRNA expression in db/+ and db/db mice during recovery from H/I: RT- PCR analysis.

MMP-2, MMP-3 MMP-9 & TIMP-1, TIMP-2 &TIMP-3 mRNA expression was measured by RT-PCR in both contralateral (C) and ipsilateral (I) hemispheres of db/+ and db/db mice in baseline and at 4, 8, 24 & 48 hr of hypoxic-ischemic recovery. The results are expressed as a ratio of ipsilateral to contralateral hemispheres. *p<0.05 vs db/+ (n=4 to 6). ND – Not detectable db/+ ■ db/db
Leukocytes infiltration: Immunohistochemistry
To determine if neutrophils are a potential source of MMP-9, we looked for infiltration in db/+ and db/db mice at 24 hr of H/I recovery. As illustrated in Figure 6, while we observed a similar infiltration of neutrophils in the cortex of the db/+ and db/db mice, we consistently observed a greater infiltration of neutrophils in the striatum of the db/db brains despite a similar infarct size in the db/+ brains. Surprisingly, though, we observed leakage of dye in the thalamus at 48 hr of H/I recovery, but no neutrophils were seen at 24 hr of recovery.
Figure 6. Neutrophil Infiltration: Immunohistochemistry.

Figure 6 illustrates the extent of neutrophil infiltration in the cortex and straitum of the ipsilateral hemishpheres at 24 hr of recovery in db/+ control and db/db dibetic mice with comparable infarct sizes as determined by H&E staining. Neutrophil infiltration is visualized by Lys6B.2 antibody that specifically binds to the neutrophil receptor. The presence of neutrophils was signifcantly greater in striatum of db/db mice compared to db/+ control mice , while in cortex db/+ and db/db mice showed similar neutrophil infiltration. Neutrophils were not observed in the contralteral hemispheres of either db/+ or db/db mice (data not shown) or in sham control mice. Images were obtained by Olympus BX −50 microscope at 10× magnification (n=11–15/group).
MMP-9 mediated loss of occludin & collagen IV following H/I
Tight junction (TJs) proteins are the major target of MMP-9 and other proteases, leading to increased BBB permeability and the cerebral influx of inflammatory cells such as monocytes and neutrophils following H/I. To demonstrate the alteration in TJs, we measured occludin levels by Western blotting and immunohistochemistry in both contralateral and ipsilateral hemispheres of db/+ & db/db mice at 24 hr recovery. We observed a significant loss of occludin, 1.3 fold decrease in the db/db compared to db/+ in the ipsilateral hemisphere as shown in Fig. 7A. Similarly, a significant loss of occludin was seen by immunohistochemistry in the ipsilateral hemisphere of the db/db mice especially in cortex and striatum compared to the db/+, as illustrated in Fig.7C. These regions correspond to those where there was greater neutrophil invasion and albumin leakage following stroke. We also measured the levels of basement membrane protein of cerebral microvessel, collagen IV, by Western blotting. The analysis showed approximately 1.2 fold decrease in collagen IV expression in diabetic compare to non-diabetic control as shown in Fig. 7B. Overall, these data indicate that diabetes increases MMP-9 gelatinolytic activity and BBB permeability via loss of TJs and extracellular matrix protein, and is associated with elevated levels of MMP-9 and greater neutrophil invasion following stroke.
Figure 7. Loss of occludin & collagen at 24 hr of H/I.

Occludin and collagen IV were measured in both contralateral (C) and ipsilateral (I) hemishpheres in db/+ & db/db mice at 24 hr of H/I recovery by western blotting. Figures 7A and B show a significant decrease of occludin & collagen IV in db/db compare to db/+. Interstingly we observed a greater expression of occludin and collagen in diabetic contralateral hemishpheres compared to non-diabetic controls. The individual band is normalized to a positive control and then, results are expressed as a ratio ipsilateral to contralateral as described above.
Immunohistochemistry shows an intense staining of occludin around vessels in the contralateral cortex of both db/+ and db/db. The decreased reactivity of occludin was observed in the ipsilateral hemishpheres of cortex and striatum of db/db mice compared to db/+ ipsilateral hemispheres, as shown in Fig. 7C. Images of occludin were captured using confocal microscopy (Olympus Fluoview 1000 1.7) fluorescence maxima of approximately 594 nm at 40× magnification. A microvessel from a db/+ mouse contralateral hemisphere is presented in 100 × magnification to clearly see the immunostaining.*p<0.05 vs db/+ (n=6) db/+ ■ db/db
Discussion
In earlier studies, we observed larger infarct volumes following H/I insult in both diabetic ob/ob and db/db mice as compared to their heterozygous non-diabetic littermates (Zhang et al. 2004; Kumari et al. 2007; Kumari et al. 2010). In this study, we have investigated BBB permeability following H/I in db/+ and db/db mice and observed that the greater BBB disruption in the db/db mice at 48 hr of recovery is associated with increased metalloproteases activity (MMPs).
Several studies in both humans and rodents have implicated the involvement of MMPs in the breakdown of BBB following stroke and in one rat study, hyperglycemia seemed to enhance the BBB injury (Dietrich et al. 1993; Rosell et al. 2008). Moreover, treatment with broad spectrum MMPs inhibitors was effective in reducing the BBB leakage and improving stroke recovery, although prolonged inhibition of MMP-9 was found to be detrimental to the late recovery phase of stroke (Asahi et al. 2001b; Baker et al. 2007). In this study, we observed an enhanced MMP-9 proteolytic activity in db/db mice following stroke compared to the db/+, which appeared to reflect the larger infarct size in db/db mice. However, when the protease activities were normalized for infarct area in the db/+ and db/db mice, the integral MMP-9 gelatinolytic activity was greater in the diabetic mice (Fig. 2E). We also observed an increased MMP-2 activity but only at 48 hr of recovery and only in the more severely damaged db/db mice (data not shown). These observations appear to be consistent with those of Gashe et al, 1999 and Planas et al, 2001 who found that MMP-9 up-regulation occurred early in the acute phase of stroke whereas MMP-2 elevation occurred during the late phase of recovery. However, in marked contrast Jin and colleagues proposed that a biphasic opening of the BBB is mediated by the differential regulation of MMP-9 & MMP-2 during stroke recovery (Jin et al.2010). They proposed that there is an initial opening of the BBB (within 3 hr of the insult) in mild to moderate strokes that is mediated by MMP-2 and is potentially reversible. Their proposed second opening of the BBB then becomes evident at 24 hr and is mediated by MMP-9, which results in the severe BBB disruption, brain edema, infarction and hemorrhagic transformation In this study, we did not observe any early (6–12 hr recovery) MMP-2 enzyme activity by zymography in either the db/db or db/+ mice (data not shown). Western Blot analysis has enabled us to attribute the increased MMP-9 gelatinolytic activity in the ipsilateral hemisphere of the db/db mice to increased total protein, and similarly, to assign the apparent linear relationship between gelatinolytic activity and infarct size in both groups of mice illustrated in Figure 3B, to increasing levels of MMP-9 protein.
These observations are also consistent with other studies in the rat, where a greater MMP-9 activity was found in diabetic rat macrovasculature following stroke (Elgebaly et al. 2010; Kamada et al. 2007). However, an important distinction between the current study and that of Elegebaly et al is that we did not observe any MMP-9 activity in contralateral hemispheres of either db/+ or db/db mice whereas Elegebaly et al found MMP-9 activities in non-ischemic hemispheres of control and diabetic rats.
Early studies showed increased vascular endothelial swelling, luminal narrowing and the BBB opening after 30 min of global ischemia in hyperglycemic rats (Paljarvi et al. 1983); however, a link between hyperglycemia, enhanced vascular MMP-9 activity and the generation of reactive oxygen species in vascular endothelial cells was first made by Uemura et al (Uemura et al. 2001). Subsequently, Kamada et al, confirmed in the rat that hyperglycemia increased superoxide generation and oxidative stress following cerebral ischemic reperfusion, that resulted in increased MMP-9 activity and BBB disruption which could be reversed by over-expression of superoxide dismutase SOD1 (Kamada et al. 2007).
As illustrated in Figure 4, MMPs activities are tightly regulated by their corresponding tissue inhibitors. TIMP-1 and TIMP-2 inhibit MMP-9 and MMP-2 respectively, and the over-expression of TIMP-1/TIMP-2 was found to be effective in reducing infarct volume in a rat MCAO model and in a mouse model of transient global ischemia (Baker et al. 2007; Tejima et al. 2009). TIMP-3 is widely expressed and plays several important roles in cellular growth, cellular death and tissue repair and is expressed early in recovery from H/I injury (Rosenberg 2009). Specifically, TIMP-3 inhibits MT1-MMP, MMP-3 and TNFα converting enzyme (TACE), which in turn suppresses the release of MMP-2, MMP-9 and TNFα respectively (Fig. 4). In this study, we followed the expression of TIMPs 1, 2 and 3 and the MMPs 2, 3, and 9 during recovery. The increased expression of the TIMPs occurred much earlier than their respective MMPs and the patterns of TIMPs expression in the infarcted hemispheres of db/+ and db/db brains appear to be closely related to the expression and activities of their corresponding MMPs. TIMP-1 & TIMP-3 mRNA expression is reduced in db/db mice early in recovery giving rise to an increased MMP-3 and MMP-9 expression, hence, an enhanced MMP-9 gelatinolytic activity led to subsequent increased BBB permeability. These data are temporally consistent with the observations of Wallace et al who observed the greatest TIMP3 expression at 2 hr following reperfusion in both ischemic and non-ischemic cortex (Wallace et al. 2002).
The regulation of TIMP and MMP expression is intimately associated with the initiation of an inflammatory response following the ischemic insult. For example in TIMP3 KO mice, there is a reduction in the activation of astrocytes and microglia and the overall inflammatory response following global ischemia, causes delayed neuronal cell death (Walker and Rosenberg 2009). Several studies have indicated that MMPs 2, 3, and 9 are induced by TNFα, MCP-1, and particularly IL1β in the brain following CNS injury (Vecil et al. 2000; Zeni et al. 2007). Integrating such observations with our earlier studies presents somewhat of a paradox: for while we observed delayed astrocytic and microglial activation in both db/db and ob/ob mice during the initial recovery from H/I that are consistent with these observations, we also observed a delayed inflammatory response with markedly reduced levels of IL-1β and TNFα mRNA and protein early in stroke recovery in diabetic mice. This is clearly inconsistent with the observed increases in MMP-9 activity and suggests an alternative mode of activation of MMP-9 expression that remains to be identified (Zhang et al. 2004; Kumari et al. 2007; Kumari et al. 2010).
Recent clinical and experimental data have suggested the major sources of MMP-9 during the first 24 hr of stroke recovery are microvascular endothelial cells and leukocytes, mainly neutrophils (Justicia et al. 2003; Zhao et al. 2006). MMP-9 is stored in the granules of mature neutrophils and is released within one hour of activation, whereas de novo synthesis of MMP-9 is relatively slow (Jin et al.2010). We observed comparable levels of neutrophil infiltration in the cortex of both control & diabetic brain tissue at 24 hr of recovery. However, in Figure 6 we observed the infiltration of neutrophils was much greater in striatum of the db/db mice, which is consistent with the increased leakage seen in Figure 1. These data are comparable to the recent observations of Tureyen et al, who found increased myeloperoxidase activity, a marker for neutrophils, in db/db mice brain, at 72 hr of recovery following MCAO (Tureyen et al. 2011). Western blotting analysis for the presence of neutrophils with an antibody raised against LYS6.B2 antigen indicated an increased level of neutrophils in diabetic brain compared to control at 24 hr of recovery although values were not statistically significant (data not shown). In this study, the extravasations of neutrophils in cortex and striatum is coupled with the loss of occludin (TJs protein) from cerebral microvessels in damaged hemispheres of diabetic mice as shown in Fig.7C. A striking difference between control and diabetic seems to be the striatum, where we observed greater neutrophil infiltration, greater occludin losses and subsequently greater microvascular permeability. Similar to our finding, MMP-9 mediated alteration in TJs protein occludin was reported by Reijerkerk A et al, In rats which they suggested was due to protein degradation following H/I, and was restored by MMP-9 inhibition (Reijerkerk et al. 2006). The reduced endothelial occludin content and increased vascular permeability in diabetic rat retina was also shown by (Antonetti et al. 1998), that further supports the greater proteolytic postischemic changes in diabetics compared to nondiabetics in this study. During cerebral ischemia, endothelial tight junctions open rapidly and increase the transendothelial transport, following which the basal lamina is the only barrier to prevent blood components from entering into the brain. The Extracellular matrix of the brain endothelial cell is comprised of several protein components, including collagen IV, which is a specific substrate for MMP-9 from which it derives its alternative name, type IV collagenase. MMP-9-mediated loss of collagen was reported in rat following H/I by (Hu et al, 2009) which we can clearly confirm in the db/+ and more extensively in the db/db mice at 24 hr of H/I recovery. The study by Krizanac-Bengez et al also reported increased luminal MMP-9 & MMP-2, partial reduction of TIMP-1 and complete reduction of TIMP-2 activity in the presence of circulating leukocytes, further supporting the role of leukocytes in increased BBB permeability (Krizanac-Bengez et al. 2006). If leukocytes are indeed the source of the MMP-9 in the current study, then the increased levels observed in the db/db mice would be consistent with our earlier observations demonstrating greater macrophage association/ infiltration in the db/db mice at 48 hr of stoke recovery (Zhang et al, 2004).
Moreover, while blocking leukocyte adhesion and inhibiting MMP-9 activity have been shown to be moderately effective in promoting stroke recovery in control animals, its efficacy may be greatly enhanced in reducing the stroke severity and promoting recovery in the diabetic animals and will become a major focus of our future investigations (Bowes et al. 1995; Justicia et al. 2003).
Acknowledgements
This work was supported by the grants from National Institutes of Health (RO1-DK75130 & 3 RO1-DK75130-03S3) and American Diabetes Association (ADA1-11-BS-146).
Abbreviations
- MMPs
Matrix Metalloproteases
- TIMPs
Tissue Inhibitors of Metalloproteases
- BBB
Blood-Brain Barrier
Footnotes
Disclosure: We do not have any conflict of interest to disclose.
References
- Amantea D, Russo R, Gliozzi M, Fratto V, Berliocchi L, Bagetta G, Bernardi G, Corasaniti MT. Early upregulation of matrix metalloproteinases following reperfusion triggers neuroinflammatory mediators in brain ischemia in rat. Int Rev Neurobiol. 2007;82:149–169. doi: 10.1016/S0074-7742(07)82008-3. [DOI] [PubMed] [Google Scholar]
- Antonetti DA, Barber AJ, Khin S, Lieth E, Tarbell JM, Gardner TW. Vascular permeability in experimental diabetes is associated with reduced endothelial occludin content: vascular endothelial growth factor decreases occludin in retinal endothelial cells. Penn State Retina Research Group. Diabetes. 1998;47:1953–1959. doi: 10.2337/diabetes.47.12.1953. [DOI] [PubMed] [Google Scholar]
- Asahi M, Sumii T, Fini ME, Itohara S, Lo EH. Matrix metalloproteinase 2 gene knockout has no effect on acute brain injury after focal ischemia. Neuroreport. 2001a;12:3003–3007. doi: 10.1097/00001756-200109170-00050. [DOI] [PubMed] [Google Scholar]
- Asahi M, Asahi K, Jung JC, del Zoppo GJ, Fini ME, Lo EH. Role for matrix metalloproteinase 9 after focal cerebral ischemia: effects of gene knockout and enzyme inhibition with BB-94. J Cereb Blood Flow Metab. 2000;20:1681–1689. doi: 10.1097/00004647-200012000-00007. [DOI] [PubMed] [Google Scholar]
- Asahi M, Wang X, Mori T, Sumii T, Jung JC, Moskowitz MA, Fini ME, Lo EH. Effects of matrix metalloproteinase-9 gene knock-out on the proteolysis of blood-brain barrier and white matter components after cerebral ischemia. J Neurosci. 2001b;21:7724–7732. doi: 10.1523/JNEUROSCI.21-19-07724.2001. [DOI] [PMC free article] [PubMed] [Google Scholar]
- Baker AH, Sica V, Work LM, Williams-Ignarro S, de Nigris F, Lerman LO, Casamassimi A, Lanza A, Schiano C, Rienzo M, Ignarro LJ, Napoli C. Brain protection using autologous bone marrow cell, metalloproteinase inhibitors, and metabolic treatment in cerebral ischemia. Proc Natl Acad Sci U S A. 2007;104:3597–3602. doi: 10.1073/pnas.0611112104. [DOI] [PMC free article] [PubMed] [Google Scholar]
- Bonoiu A, Mahajan SD, Ye L, Kumar R, Ding H, Yong KT, Roy I, Aalinkeel R, Nair B, Reynolds JL, Sykes DE, Imperiale MA, Bergey EJ, Schwartz SA, Prasad PN. MMP-9 gene silencing by a quantum dot-siRNA nanoplex delivery to maintain the integrity of the blood brain barrier. Brain Res. 2009;1282:142–155. doi: 10.1016/j.brainres.2009.05.047. [DOI] [PMC free article] [PubMed] [Google Scholar]
- Clark AW, Krekoski CA, Bou SS, Chapman KR, Edwards DR. Increased gelatinase A (MMP-2) and gelatinase B (MMP-9) activities in human brain after focal ischemia. Neurosci Lett. 1997;238:53–56. doi: 10.1016/s0304-3940(97)00859-8. [DOI] [PubMed] [Google Scholar]
- Dietrich WD, Alonso O, Busto R. Moderate hyperglycemia worsens acute blood-brain barrier injury after forebrain ischemia in rats. Stroke. 1993;24:111–116. doi: 10.1161/01.str.24.1.111. [DOI] [PubMed] [Google Scholar]
- Dzwonek J, Rylski M, Kaczmarek L. Matrix metalloproteinases and their endogenous inhibitors in neuronal physiology of the adult brain. FEBS Lett. 2004;567:129–135. doi: 10.1016/j.febslet.2004.03.070. [DOI] [PubMed] [Google Scholar]
- Elgebaly MM, Prakash R, Li W, Ogbi S, Johnson MH, Mezzetti EM, Fagan SC, Ergul A. Vascular protection in diabetic stroke: role of matrix metalloprotease-dependent vascular remodeling. J Cereb Blood Flow Metab. 2010;30:1928–1938. doi: 10.1038/jcbfm.2010.120. [DOI] [PMC free article] [PubMed] [Google Scholar]
- Ferland-McCollough D, Ozanne SE, Siddle K, Willis AE, Bushell M. The involvement of microRNAs in Type 2 diabetes. Biochem Soc Trans. 2010;38:1565–1570. doi: 10.1042/BST0381565. [DOI] [PubMed] [Google Scholar]
- Hirsch S, Gordon S. Polymorphic expression of a neutrophil differentiation antigen revealed by monoclonal antibody 7/4. Immunogenetics. 1983;18:229–239. doi: 10.1007/BF00952962. [DOI] [PubMed] [Google Scholar]
- Hossain P, Kawar B, El Nahas M. Obesity and diabetes in the developing world--a growing challenge. N Engl J Med. 2007;356:213–215. doi: 10.1056/NEJMp068177. [DOI] [PubMed] [Google Scholar]
- Hu Q, Chen C, Yan J, Yang X, Shi X, Zhao J, Lei J, Yang L, Wang K, Chen L, Huang H, Han J, Zhang JH, Zhou C. Therapeutic application of gene silencing MMP-9 in a middle cerebral artery occlusion-induced focal ischemia rat model. Exp Neurol. 2009;216(1):35–46. doi: 10.1016/j.expneurol.2008.11.007. [DOI] [PubMed] [Google Scholar]
- Jin R, Yang G, Li G. Molecular insights and therapeutic targets for blood-brain barrier disruption in ischemic stroke: critical role of matrix metalloproteinases and tissue-type plasminogen activator. Neurobiol Dis. 2010;38:376–385. doi: 10.1016/j.nbd.2010.03.008. [DOI] [PMC free article] [PubMed] [Google Scholar]
- Krizanac-Bengez L, Hossain M, Fazio V, Mayberg M, Janigro D. Loss of flow induces leukocyte-mediated MMP/TIMP imbalance in dynamic in vitro blood-brain barrier model: role of pro-inflammatory cytokines. Am J Physiol Cell Physiol. 2006;291:C740–C749. doi: 10.1152/ajpcell.00516.2005. [DOI] [PubMed] [Google Scholar]
- Kumari R, Willing LB, Krady JK, Vannucci SJ, Simpson IA. Impaired wound healing after cerebral hypoxia-ischemia in the diabetic mouse. J Cereb Blood Flow Metab. 2007;27:710–718. doi: 10.1038/sj.jcbfm.9600382. [DOI] [PubMed] [Google Scholar]
- Kumari R, Willing LB, Patel SD, Krady JK, Zavadoski WJ, Gibbs EM, Vannucci SJ, Simpson IA. The PPAR-gamma agonist, darglitazone, restores acute inflammatory responses to cerebral hypoxia-ischemia in the diabetic ob/ob mouse. J Cereb Blood Flow Metab. 2010;30(2):352–360. doi: 10.1038/jcbfm.2009.221. [DOI] [PMC free article] [PubMed] [Google Scholar]
- Lambert E, Dasse E, Haye B, Petitfrere E. TIMPs as multifacial proteins. Crit Rev Oncol Hematol. 2004;49:187–198. doi: 10.1016/j.critrevonc.2003.09.008. [DOI] [PubMed] [Google Scholar]
- Montaner J, Alvarez-Sabin J, Molina CA, Angles A, Abilleira S, Arenillas J, Monasterio J. Matrix metalloproteinase expression is related to hemorrhagic transformation after cardioembolic stroke. Stroke. 2001;32:2762–2767. doi: 10.1161/hs1201.99512. [DOI] [PubMed] [Google Scholar]
- Paljarvi L, Rehncrona S, Soderfeldt B, Olsson Y, Kalimo H. Brain lactic acidosis and ischemic cell damage: quantitative ultrastructural changes in capillaries of rat cerebral cortex. Acta Neuropathol. 1983;60:232–240. doi: 10.1007/BF00691871. [DOI] [PubMed] [Google Scholar]
- Rosell A, Foerch C, Murata Y, Lo EH. Mechanisms and markers for hemorrhagic transformation after stroke. Acta Neurochir Suppl. 2008;105:173–178. doi: 10.1007/978-3-211-09469-3_34. [DOI] [PubMed] [Google Scholar]
- Rosenberg GA. Matrix metalloproteinases and their multiple roles in neurodegenerative diseases. Lancet Neurol. 2009;8:205–216. doi: 10.1016/S1474-4422(09)70016-X. [DOI] [PubMed] [Google Scholar]
- Rosenberg GA, Estrada EY, Mobashery S. Effect of synthetic matrix metalloproteinase inhibitors on lipopolysaccharide-induced blood-brain barrier opening in rodents: Differences in response based on strains and solvents. Brain Res. 2007;1133:186–192. doi: 10.1016/j.brainres.2006.11.041. [DOI] [PMC free article] [PubMed] [Google Scholar]
- Shaw JE, Sicree RA, Zimmet PZ. Global estimates of the prevalence of diabetes for 2010 and 2030. Diabetes Res Clin Pract. 2010;87:4–14. doi: 10.1016/j.diabres.2009.10.007. [DOI] [PubMed] [Google Scholar]
- Singh KP, Gerard HC, Hudson AP, Boros DL. Expression of matrix metalloproteinases and their inhibitors during the resorption of schistosome egg-induced fibrosis in praziquantel-treated mice. Immunology. 2004;111:343–352. doi: 10.1111/j.0019-2805.2004.01817.x. [DOI] [PMC free article] [PubMed] [Google Scholar]
- Tejima E, Guo S, Murata Y, Arai K, Lok J, van Leyen K, Rosell A, Wang X, Lo EH. Neuroprotective effects of overexpressing tissue inhibitor of metalloproteinase TIMP-1. J Neurotrauma. 2009;26:1935–1941. doi: 10.1089/neu.2009.0959. [DOI] [PMC free article] [PubMed] [Google Scholar]
- Tureyen K, Bowen K, Liang J, Dempsey RJ, Vemuganti R. Exacerbated Brain Damage, Edema and Inflammation in Type-2 Diabetic Mice Subjected to Focal Ischemia. J Neurochem. 2011;116(4):499–507. doi: 10.1111/j.1471-4159.2010.07127.x. [DOI] [PMC free article] [PubMed] [Google Scholar]
- Vannucci SJ, Willing LB, Goto S, Alkayed NJ, Brucklacher RM, Wood TL, Towfighi J, Hurn PD, Simpson IA. Experimental stroke in the female diabetic, db/db, mouse. J Cereb Blood Flow Metab. 2001;21:52–60. doi: 10.1097/00004647-200101000-00007. [DOI] [PubMed] [Google Scholar]
- Walker EJ, Rosenberg GA. TIMP-3 and MMP-3 contribute to delayed inflammation and hippocampal neuronal death following global ischemia. Exp Neurol. 2009;216:122–131. doi: 10.1016/j.expneurol.2008.11.022. [DOI] [PMC free article] [PubMed] [Google Scholar]
- Wild S, Roglic G, Green A, Sicree R, King H. Global prevalence of diabetes: estimates for the year 2000 and projections for 2030. Diabetes Care. 2004;27:1047–1053. doi: 10.2337/diacare.27.5.1047. [DOI] [PubMed] [Google Scholar]
- Zhang L, Nair A, Krady K, Corpe C, Bonneau RH, Simpson IA, Vannucci SJ. Estrogen stimulates microglia and brain recovery from hypoxia-ischemia in normoglycemic but not diabetic female mice. J Clin Invest. 2004;113:85–95. doi: 10.1172/JCI200418336. [DOI] [PMC free article] [PubMed] [Google Scholar]
- Zhou J, Li J, Rosenbaum DM, Barone FC. Thrombopoietin protects the brain and improves sensorimotor functions: reduction of stroke-induced MMP-9 upregulation and blood-brain barrier injury. J Cereb Blood Flow Metab. 2011;31:924–933. doi: 10.1038/jcbfm.2010.171. [DOI] [PMC free article] [PubMed] [Google Scholar]