

Abstract
The DNA hypomethylating drug decitabine maintains normal hematopoietic stem cell (HSC) self-renewal but induces terminal differentiation in acute myeloid leukemia (AML) cells. The basis for these contrasting cell-fates, and for selective CpG hypomethylation by decitabine, is poorly understood. Promoter CpGs, with methylation measured by microarray, were classified by the direction of methylation change with normal myeloid maturation. In AML cells, the methylation pattern at maturation-responsive CpG suggested at least partial maturation. Consistent with partial maturation, in gene expression analyses, AML cells expressed high levels of the key lineage-specifying factor CEBPA, but relatively low levels of the key late-differentiation driver CEBPE. In methylation analysis by mass-spectrometry, CEBPE promoter CpG that are usually hypomethylated during granulocyte maturation were significantly hypermethylated in AML cells. Decitabine treatment induced cellular differentiation of AML cells, and the largest methylation decreases were at CpG that are hypomethylated with myeloid maturation, including CEBPE promoter CpG. In contrast, decitabine-treated normal HSC retained immature morphology, and methylation significantly decreased at CpG that are less methylated in immature cells. High expression of lineage-specifying factor and aberrant epigenetic repression of some key late-differentiation genes distinguishes AML cells from normal HSC and could explain the contrasting differentiation and methylation responses to decitabine.
INTRODUCTION
An important goal in myelodysplastic syndrome (MDS) and acute myeloid leukemia (AML) research is to develop treatment that is more selectively detrimental to MDS/AML cells and relatively sparing of normal hematopoietic stem cells (HSC). One such potential therapeutic is the deoxycytidine analogue decitabine, which at low, non-cytotoxic concentrations can deplete the chromatin modifying enzyme DNA methyl-transferase 1 (DNMT1) and hypomethylate DNA CpG (1–5): in a number of studies from different groups, decitabine and histone deacetylase inhibitors (HDACi, another class of drug that inhibit chromatin modifying enzymes) have been shown to maintain or increase normal HSC self-renewal (6–15); in contrast, decitabine and HDACi induce terminal differentiation of AML primary cells and cell lines encompassing the wide morphologic and cytogenetic spectrum of disease (5;16–24). The basis for these contrasting cell fate responses of AML cells and normal HSC to chromatin-relaxing drugs is poorly understood, impeding rational and optimal clinical translation of this mode of therapy. Since a major effect of decitabine is to hypomethylate DNA, pre- and post-decitabine patterns of DNA methylation could provide an insight into underlying mechanisms. However, changes in promoter CpG methylation are also an important and usual aspect of hematopoietic differentiation (25). Therefore, to better understand and interpret DNA methylation patterns before and after treatment with decitabine, promoter CpGs, with methylation measured by microarray and mass spectrometry, were categorized by the direction of methylation change with normal myeloid maturation. The methylation levels of maturation-responsive CpG were then compared in normal, MDS and AML cells. The methylation analyses were complemented by gene expression measurements of key lineage-specifying and late-differentiation transcription factors (TF), which together drive progressive myeloid maturation. These analyses exposed differences in baseline maturation and epigenetic context between AML cells and normal HSC that likely contribute to and explain contrasting cell fate and methylation responses to decitabine.
MATERIALS AND METHODS
Cells from human subjects and cell lines
Informed consent for sample and data collection was obtained according to protocols approved by the Cleveland Clinic Institutional Review Board. Bone marrow aspirates were collected from MDS and AML patients between 2002 and 2007. High risk disease was defined as MDS or AML with ≥5% myeloblasts (n=130), and low risk disease as MDS with <5% myeloblasts (n=27). Clinical annotation of samples used for promoter CpG methylation analysis by microarray was described in detail in a previous publication (26). Normal total bone marrow (NBM) were aspirates from healthy individuals (n=42). Six AML cell lines were studied, of which K-562 and TF1 are described as erythro-leukemia cell lines, and KG1, TF1 and Kasumi-1 express CD34. A model of ‘first-hit’ abnormality (pre-leukemia) was also examined: cord blood CD34+ cells transduced with retrovirus to express the leukemia fusion protein RUNX1-ETO, as previously described and characterized (27).
Promoter CpG methylation measurement by methylation array
The Methylation Cancer Panel I and GoldenGate Assay kit with UDG (Illumina, San Diego, CA) was used for microarray methylation analysis of 1505 CpG sites mostly in the 5′-regulatory regions of 807 genes (known oncogenes, tumor suppressor, X-linked and imprinted, DNA repair, cell cycle control, differentiation and apoptosis genes) (28). DNA was bisulfite converted using the EZ DNA methylation kit (Zymo Research, Orange, CA). For each CpG site, there were two pairs of probes corresponding to either the methylated or unmethylated state of the CpG site. Through allele-specific extension and ligation, PCR templates were generated and then amplified by PCR using fluorescently labeled common primers. The resulting PCR products were hybridized to a bead array at sites bearing complementary address sequences. These hybridized targets contained a fluorescent label that denotes a methylated or unmethylated state for a given locus. Methylation status of the interrogated CpG site was then calculated as the ratio of fluorescent signal from one allele relative to the sum of both methylated and unmethylated alleles (β-value).
Our verification of the precision of the array, by analyzing technical replicate samples on 2 separate arrays, and our validation of microarray results with another method for measuring methylation levels, has been published previously (26).
The β-value provides a continuous measure of levels of DNA methylation at a CpG site, ranging from 0 for completely unmethylated sites to 1 in completely methylated sites (28). Three categories of CpG sites were defined (raw methylation data uploaded to GEO Datasets, GSE29047):
CpG that undergo a significant (p<0.001, t-test) increase in methylation from normal bone marrow CD34+ (NCD34, n=9), with 95–99% immature CD34+ cells, to normal total bone marrow (NBM, n=42), with <2% immature CD34+ cells (‘hypomethylated in NCD34’, 108 CpG, table S1);
CpG that undergo a significant (p<0.001, t-test) decrease in methylation from NCD34 to NBM (‘hypermethylated in NCD34’, 162 CpG, table S1);
CpG that do not undergo a statistically significant change in methylation status between normal NCD34 and NBM (‘no methylation change’, 1236 CpG).
The image extraction and statistical analysis were done with Beadstudio and Genomestudio Methylation Module (Illumina). All Illumina recommended control oligos were used. Statistical significance of the difference between mean and median values of methylation level for different samples/groups was assessed using Beadstudio Methylation Module software (Illumina) and SAS V8 (SAS, Cary, N. Carolina). Hierarchical clustering was performed by Euclidean distance metric and centroid linkage (ArrayStar 3, DNAStar).
CEBPE promoter CpG methylation analyses
CEBPE promoter methylation was measured with the Sequenom MassARRAY Compact System (www.sequenom.com/). Gene-specific amplification of bisulfite-treated DNA was followed by in vitro transcription and analysis by matrix-assisted laser desorption ionization time-of-flight (MALDITOF) mass spectrometry (29). DNA (1 μg) was bisulfite converted using EZ DNA Methylation kit (Zymo Research). PCR primers specific for bisulfite converted DNA were designed (Epidesigner Online Tool -http://www.epidesigner.com/). Each reverse primer contained a T7-promoter tag for in vitro transcription (5′-cagtaatacgactcactatagggagaaggct-3′), and the forward primer was tagged with a 10mer to balance Tm (5′-aggaagagag-3′). Primer sequences used for the CEBPε promoter are; CEBPε F (5 ′-aggaagagagTGGGTTTGGTTAAAGTATTTGGTTA) and CEBPε R (5′–cagtaatacgactcactatagggagaaggctAAACTTCTCAAACCTCACAAAAAAA). The genomic coordinates for the CEBPε promoter region analyzed are chr14:23,588,987-14:23,589,309. Mass spectra were acquired using a MassARRAY MALDI-TOF MS (Bruker-Sequenom) and peak detection, signal-to-noise calculations, and quantitation of CpG methylation performed using proprietary EpiTyper software v1.0 (Sequenom). Differentiation-responsive CpG within this region were identified by time-course analyses of normal CD34+ hematopoietic precursors treated with granulocyte-colony stimulating factor (G-CSF). Putative TF binding sites in the analyzed region were identified by TFSEARCHv1.3 (“TFSEARCH: Searching Transcription Factor Binding Sites”, http://www.rwcp.or.jp/papia/)(30).
Pyrosequencing analysis of methylation at repetitive element CpGs
DNA was purified from cells using the Wizard Genomic DNA Purification Kit (Promega) and DNA (1 μg) was bisulfite converted using EZ DNA Methylation kit (Zymo Research). The PCR primers were 10 pmol of 5- TTTTTTGAGTTAGGTGTGGG-3 and 10 pmol of biotinylated-5-TTGTTTGGTATTTTTTAGTGAGA-3. PCR cycling conditions were; cycle temperature of 94°C for 30 seconds, 60°C for 30 seconds, and 72°C for 30 seconds, for 45 cycles to consume all the biotinylated primers. The biotinylated strand was captured on streptavidin sepharose beads (Amersham Biosciences, Uppsala, Sweden) and annealed with the sequencing primer 5-GGGTGGGAGTGAT-3. The methylation degree of LINE-1 was computed as the average of 4 CpG sites pyrosequenced with the Pyromark Q24 Pyrosequencer (Qiagen).
RESULTS
Methylation at maturation-responsive CpG in MDS and AML bone marrow cells
Three categories of CpG sites were defined: (i) CpG that undergo a significant (p<0.001, t-test) increase in methylation from normal bone marrow CD34+ precursors (NCD34, 95–99% CD34+ immature cells, n=9) to normal total bone marrow (NBM, <2% CD34+ immature cells, n=42) (‘hypomethylated in NCD34’, 108 CpG)(table S1); (ii) CpG that undergo a significant (p<0.001, t-test) decrease in methylation from NCD34 to NBM (‘hypermethylated in NCD34’, 162 CpG)(table S1); (iii) CpG that do not undergo a statistically significant change in methylation status between NCD34 and NBM (‘no methylation change’, 1236 CpG). In gene ontology analyses, gene expression in blood, leukocyte, neutrophil, platelet, leukemia, liver and spleen was significantly associated with maturation-responsive CpG (hypo- and hypermethylated in normal CD34) compared to ‘no methylation change’ CpG (table S2). In a comparison of pathway associations, hematopoietic pathways (eg., ‘hematopoietic cell lineage’) were the pathways most frequently associated with maturation-responsive CpG; this was not the case with ‘no methylation change’ CpG (table S3). In unbiased hierarchical cluster analysis of methylation data from an independent study (31), clusters generated using maturation-responsive CpG discriminated best between NCD34 and NBM, despite 7 to 8-fold more CpG sites in the ‘no methylation change’ category (figure S1).
CpG sites that became more methylated with normal myeloid maturation (hypomethylated in NCD34) were even more methylated in bone marrow cells from patients with low-risk MDS (n=27) and high-risk MDS/AML (≥5% myeloblasts, n=130) (figure 1, red box plots). CpG sites that became less methylated with normal myeloid maturation (hypermethylated in NCD34) were less methylated in low-risk MDS and high-risk MDS/AML bone marrow (figure 1, blue box plots). CpG sites that do not undergo significant methylation changes with normal myeloid maturation (‘no methylation change’) were individually selected based on no significant difference in methylation between NCD34 (n=9) and NBM (n=42). However, when combined for analysis, these 1236 CpG sites were significantly more methylated in NBM compared to NCD34, although the increase was small in magnitude (figure 1, grey box plots). These CpG sites were also significantly more methylated in MDS and AML bone marrow compared to NCD34, however, the increase was substantially smaller than the methylation shifts in maturation-responsive CpG (figure 1, grey box plots).
Figure 1. Methylation changes at maturation-responsive CpG sites in MDS and AML bone marrow compared to CD34+ precursors from normal bone marrow. Distribution of methylation β-values by bone marrow sample type.
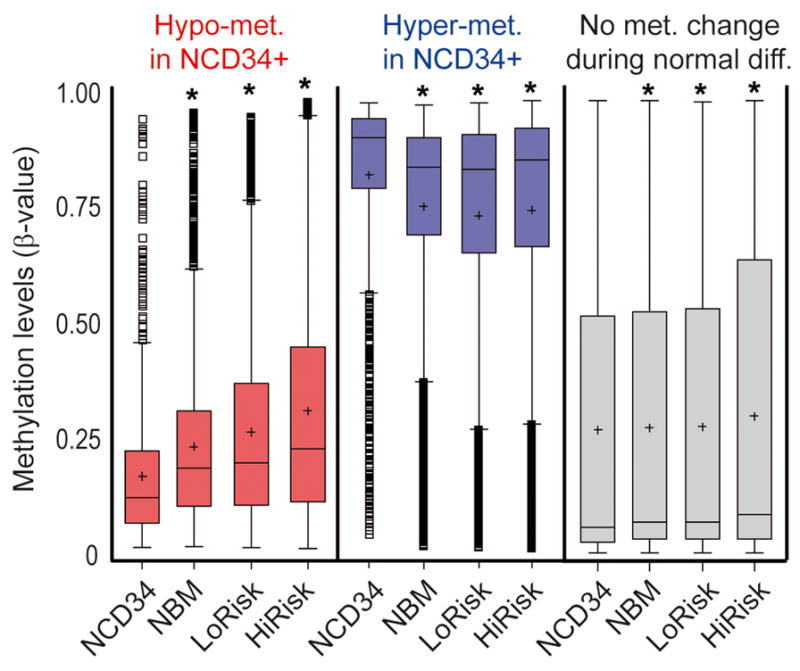
Methylation levels are represented by a β-value between 0 (unmethylated) and 1 (fully methylated). Promoter CpG sites were classified into 3 categories: CpG sites that undergo a significant (p<0.001, t-test) increase in methylation from normal CD34+ cells (NCD34) (n=9) to normal total bone marrow (NBM) (n=42) (108 CpG, ‘hypomet. in NCD34+’) (red box plots); CpG sites that undergo a significant (p<0.001, t-test) decrease in methylation from NCD34 to NBM (162 CpG, ‘hypermet. in NCD34+’) (blue box plots); CpG sites that do not undergo a change in methylation between NCD34 and NBM (1236 CpG, ‘no met. change during n. diffn.’) (grey box plots). LoRisk = bone marrow from low-risk MDS patients (n=27), HiRisk = bone marrow from high-risk MDS/AML patients (n=130) (26). Box-plot boundaries = inter-quartile range, horizontal line = median, ‘+’ = mean, whiskers = range of values, small boxes = out-lying values. Asterixes represent statistically significant (p<0.0001) differences between the median in the sample group compared to the NCD34+ group (median one-way).
To strengthen these observations, the analyses were repeated in a dataset of promoter CpG methylation generated by other investigators (31). Ninety-five CpG sites from ‘Hypomethylated in NCD34’, 157 CpG sites from ‘Hypermethylated in NCD34’ and 1157 CpG sites from ‘no methylation change’ were present in the independent dataset. Methylation of maturation-responsive CpG (hypo and hypermethylated in NCD34) changed in the expected directions from independent NCD34 to NBM (figure S2, red and blue box plots). Although ‘no methylation change’ were significantly more methylated in NBM compared to NCD34, the methylation increase was smaller in magnitude than the methylation changes at maturation-responsive CpG (figure S2, grey box plots). CpG sites that become more methylated with normal myeloid maturation were not significantly more methylated in independent dataset MDS/myeloproliferative disease (MDS/MPD) (n=13) or AML bone marrow (n=116) (figure S2). Nonetheless, of the 25 CpG sites that were >20% more methylated in AML cells than NCD34, 11 were from the category of 95 CpG sites that become more methylated with normal myeloid maturation and 14 were from the 1157 ‘no change in methylation’ CpG sites (figure S3). Therefore, maturation-responsive CpG sites were over-represented amongst the most hypermethylated CpG sites in AML bone marrow (p<0.0001, Chi-Square test). As expected, CpG sites that become less methylated with normal myeloid maturation were significantly less methylated in the MDS/MPD and AML cells (figure S2). All 6 CpG sites that were >20% less methylated in AML cells than NCD34 were from the category of 157 CpG sites that become less methylated with normal myeloid maturation (figure S3). ‘No methylation change’ CpG were significantly more methylated in MDS/MPD and AML (figure S2).
Methylation at maturation-responsive CpG in CD34+ and CD34- AML cell lines
To extend the analyses to more homogenous populations of AML cells, including CD34+ AML cells, promoter CpG methylation, with CpG sites classified as above, was analyzed in a model of first-hit or pre-leukemia (CD34+ cells retrovirally transduced to express the leukemia fusion protein RUNX1-ETO [CD34 RUNX1-ETO]; the phenotype of these cells has been previously described (27)), and six AML cell lines, including the CD34+ cell lines KG1, TF1 and Kasumi-1. The control sample was normal CD34+ cells isolated from cord-blood (NCD34).
CpG sites that become more methylated with normal myeloid maturation were significantly more methylated in three of the AML cell lines compared to NCD34 (figure 2, red box plots). CpG sites that become less methylated with normal myeloid maturation were significantly less methylated in five of the cell lines compared to NCD34 (figure 2, blue box plots). ‘No methylation change’ CpG were significantly hypermethylated in six of the cell lines compared to NCD34 (figure 2, grey box plots), however, the increase in methylation was substantially smaller in magnitude than the changes in methylation in the categories of myeloid maturation-responsive CpG (figure 2). Therefore, the AML cell lines recapitulated the methylation pattern observed in primary MDS and AML cells.
Figure 2. Methylation changes at maturation-responsive CpG sites In AML cell lines (including CD34+ cell lines KG1, TF1 and Kasumi-1) compared to normal CD34+ precursors. Distribution of methylation β-values by cell line.

Methylation at maturation-responsive (red and blue box plots) and non-responsive (grey box plots) promoter CpGs was analyzed in a model of first-hit or pre-leukemia (CD34+ cells retrovirally transduced to express the leukemia fusion protein RUNX1-ETO (27)), and 6 AML cell lines. The control sample was normal CD34+ cells isolated from cord blood. Asterixes represent statistically significant differences between the median in the cell line compared to NCD34 (median one-way). Asterixes indicate p<0.0001 or at the following comparisons ‘Hypo-met in NCD34’: NCD34 v KG1 p=0.0042, NCD34 v Kasumi-1 p=0.0002; ‘Hyper-met in NCD34’: NCD34 v KG1 p=0.0086. Box-plot boundaries = inter-quartile range, horizontal line = median, ‘+’ = mean, whiskers = range of values, small boxes = out-lying values.
Effects of non-cytotoxic concentrations of decitabine on CD34+ normal, pre-leukemia and leukemia cell lines
CD34+ normal, pre-leukemia (CD34 RUNX1-ETO) and leukemia cells (Kasumi-1) were treated with identical concentrations of decitabine, to compare the cell fate and promoter CpG methylation response.
Normal CD34+ cells treated with decitabine 0.5μM continued to proliferate exponentially, although cell counts were lower than in vehicle treated control. In contrast, CD34+ RUNX1-ETO and CD34+ Kasumi-1 cells treated with decitabine 0.5μM decreased in cell numbers (figure 3A). A higher concentration of decitabine (1μM) decreased normal CD34+, RUNX1-ETO and Kasumi-1 cell numbers. Cytarabine (AraC) is another clinically utilized cytosine analogue which is the mainstay of AML chemotherapy. Unlike decitabine 0.5μM, AraC 0.5μM decreased cell numbers of normal CD34+ as well as RUNX1-ETO and Kasumi-1 (figure 3A).
Figure 3. Decitabine, at levels that do not cause apoptosis, has opposite effects on the proliferation, differentiation and colony-formation of AML cells and normal CD34+ cells.

Normal cells: CD34+ cells from normal cord blood (NCD34+). Pre-leukemia and AML cells: (i) CD34+ cells transduced with RUNX1-ETO, (ii) Kasumi-1 cell line. Treatment: Decitabine (DAC) 0.5–1μM or cytarabine (AraC) 0.5μM on day 1, 4 and 7. A) Effects of DAC and AraC on proliferation of normal and AML cells. Cell counts by automated cell counter. Experiments were performed in triplicate. Error bars = standard error. B) Apoptosis induction by DAC and AraC. Annexin and 7AAD measured by flow-cytometry on Day 5. Annexin/7AAD data for Kasumi-1 in figure S4. C) Effects of DAC on cell morphology. Giemsa stained cytospin preparations on day 9 of liquid culture. All images 600X. D) Effects of DAC on colony formation by normal and AML cells. Cells were plated in semisolid media after 7, 14 or 21 days in liquid culture (DAC 0.5μM treatment was discontinued after day 7 of liquid culture). Phase-contrast images of colonies. All images 40X. U=Untreated, D=DAC treated, A=Ara-C treated. Colony formation data for Kasumi-1 in figure S4.
Although decitabine 0.5μM decreased RUNX1-ETO and Kasumi-1 cell numbers, this concentration of decitabine did not cause early apoptosis (measured by annexin/7AAD-staining 24 hours after drug exposure)(figure 3B, figure S4, data not shown). Decitabine at 1μM caused early apoptosis (figure 3B, figure S4, data not shown), although not to the same extent as AraC 0.5μM (figure 3B, figure S4).
On day 9 of liquid culture, vehicle treated normal CD34+ cells showed changes of early myeloid differentiation (decreased nuclear-cytoplasmic ratio, increase in pale blue cytoplasm, vacuolization), however, in the decitabine-treated wells, immature morphology was retained (high nuclear-cytoplasmic ratio, fine chromatin) (figure 3C). In contrast, RUNX1-ETO cells treated with decitabine 0.5μM exhibited extensive myeloid differentiation (decreased nuclear cytoplasmic ratio, nuclear condensation and segmentation, cytoplasmic granulation and vacuolation), whereas vehicle treated cells demonstrated immature morphology (figure 3C). Similarly, decitabine 0.5μM induced morphologic changes of differentiation in Kasumi-1 (nuclear segmentation and lobulation, increase in cell-size, and cytoplasmic vacuolization), although these changes were not as prominent as those noted in decitabine treated RUNX1-ETO cells (figure 3C).
Colony formation in semi-solid media is an assay for stem cells and progenitors. Larger colony size and/or mixed character of the colony (more than one cell lineage) suggest greater immaturity of the colony forming cell. Normal CD34+ cells treated with decitabine 0.5μM produced fewer colonies than vehicle treated normal cells, however, the colonies formed were larger and mixed. Furthermore, normal CD34+ cells treated with decitabine 0.5μM retained colony-forming ability after extended liquid culture (14 and 21 days), while normal CD34+ cells cultured in the identical conditions without decitabine had rapidly diminished colony forming ability (figure 3D). RUNX1-ETO and Kasumi-1 cells treated with decitabine 0.5μM lost their otherwise vigorous colony-forming ability (figure 3D, figure S4).
Normal CD34+ cells treated with decitabine 0.5μM demonstrated significant decreases in methylation in both categories of myeloid maturation-responsive CpG (hypo- and hypermethylated in NCD34) (figure 4, red and blue box plots). However, CpG that are not responsive to normal myeloid maturation (‘no methylation change’) were not significantly hypomethylated by decitabine (figure 4, grey box plots). In RUNX1-ETO and Kasumi-1 cells treated with decitabine 0.5μM, consistent with the morphologic response, the largest and statistically significant decreases in methylation were at CpG that become less methylated with normal myeloid maturation (‘hypermethylated in NCD34’, figure 4, blue box plots). Although decitabine also decreased methylation at CpG that become more methylated with normal myeloid maturation (‘hypomethylated in NCD34’), this decrease was smaller in magnitude and not statistically significant (figure 4, red box plots). CpG that are not responsive to normal myeloid maturation (‘no change in methylation’) were also significantly hypomethylated by decitabine (figure 4, grey box plots), however, the methylation shift was substantially smaller than the methylation change at ‘hypermethylated in NCD34’ (figure 4).
Figure 4. Methylation at maturation-responsive CpG sites before and after DAC treatment of normal CD34+ precursors and CD34+ AML cell lines.

DNA for promoter CpG methylation analysis was isolated from the cells treated as per figure 3. Promoter CpG sites were classified as per figure 1, with myeloid maturation-responsive (red and blue box plots) and non-responsive (grey box plots) CpGs. Asterixes represent statistically significant differences between control versus treated median values (median one-way). Asterixes represent p<0.0001 except at the comparisons ‘No Met. Change’ RUNX1-ETO Ctrl v DAC p=0.0286, Kasumi Ctrl v DAC p=0.0083. Box-plot boundaries = inter-quartile range, horizontal line = median, ‘+’ = mean, whiskers = range of values, small boxes = out-lying values.
Primary AML samples (n=5) and the erythro-megakaryoblastic AML cell lines UT7 and K562 were also treated with decitabine (the classification and chromosome abnormalities in the primary cells are listed in table S4, the cell lines contain complex chromosome abnormalities). Compared to vehicle treatment, decitabine 0.5μM on day 1, 4 and 7 decreased cell numbers accompanied by cellular changes of differentiation (decreased nuclear-cytoplasmic ratio, nuclear condensation, segmentation or lobulation, cytoplasmic granulation or vacuolization) (figure 5).
Figure 5. Effects of DAC 0.5μM (full lines) and vehicle treatment (dashed lines) on cell counts and cellular morphology in AML patient samples and additional AML cell-lines.

Decitabine 0.5μM on day 1, 4 and 7 or vehicle control was added to primary leukemia cells from 5 patients (classification and detected chromosome abnormalities in table S4), and the UT7 and K562 erythro-megakaryoblastic AML cell lines. Cell counts by automatic cell counter on day 8. Giemsa-stained cytospins were generated on day 8. All images 600X.
High expression of lineage-specifying TF, but epigenetic repression of key late-differentiation driver TF, in MDS and AML cells
Lineage commitment and maturation is driven by and absolutely requires key DNA-binding TF (32–34). Therefore, differentiation of AML cells by decitabine suggests high baseline and/or induced expression of key myeloid differentiation-driving TF.
Using QRT-PCR, the levels of the key myeloid lineage-specifying TF CEBPA (CEBPα), which is essential for producing granulocytes, and the lineage-specifying TF PU.1 (SPI1), which is essential for producing monocytes and B-cells, (32) were measured in bone marrow from healthy controls (n=8), low risk MDS (n=4), and high risk MDS/AML (average myeloblasts 40%, n=12) (MDS and AML sub-types listed in table S5). Compared to normal CD34+ and total bone marrow, both MDS and AML bone marrow cells expressed significantly higher levels of CEBPA, and a trend towards higher PU.1 (p=0.026 and p=0.06 respectively) (figure 6A). To restrict the comparison to cells with a similar precursor surface-phenotype, CD34+ cells were isolated from AML (n=3) and normal donor bone marrow (n=3) (AML sub-types listed in table S6). Compared to CD34+ normal cells, CD34+ AML cells expressed 10 to 100-fold higher CEBPA (figure 6B). CEBPA levels in the AML cells were 2 to 30-fold higher than HOXB4 levels in the same cells (figure 6B). These observations were extended and recapitulated in analyses of public gene expression data (figure S5)(35–40).
Figure 6. The pattern of expression of key myeloid differentiation-driving transcripton factors (TF) in MDS/AML cells suggests impaired differentiation of lineage-committed cells.

A) Lineage-specifying TF are expressed at higher levels in MDS and AML compared to normal CD34+ hematopoietic precursors or total bone marrow. CEBPA (CEBPα) and PU.1 levels were measured by QRT-PCR. B) CD34+ AML cells (n=3) express 10–100 fold higher CEBPA, but lower levels of late differentiation TF CEBPE (CEBPε), than normal CD34+ hematopoietic precursors (n=3). HOXB4 is a stem cell associated TF. CEBPA/HOXB4 (index of lineage-commitment) and CEBPE/A ratio (index of progressive maturation) calculated in each individual sample. Box-plot displays distribution of these ratios, horizontal line in box = median, box boundaries = interquartile range, whiskers = range of values. Gene expression was measured by QRT-PCR. Wilcoxon Two-sample test.
Since AML cells express high levels of CEBPA, levels of CEBPE (CEBPε), a key late-differentiation TF necessary for progressive maturation, and a gene target of CEBPA, were measured (normally, CEBPE levels peak relative to CEBPA in the transition from proliferating pro-myelocytes to non-proliferating myelocytes (33;34;41)). CD34+ AML cells expressed 2 to 10-fold lower CEBPE levels than CD34+ normal cells, despite expressing substantially higher levels of CEBPA (figure 6B). These observations were extended and recapitulated in analyses of public gene expression data (figure S5)(35–40).
The CEBPE locus on chromosome 14 is not cytogenetically deleted in AML, suggesting the repression may be by epigenetic means. Using mass spectrometry, CEBPE promoter CpG that become less methylated during G-CSF-induced differentiation of normal CD34+ precursors into granulocytes were identified (figure 7A). Notably, the three identified CEBPE promoter CpG were in proximity to putative CEBPA and RUNX1 binding sites (figure S6). The methylation levels of these CpG sites were compared in bone marrow samples from normal volunteers, AML in remission, AML, and promyelocytic leukemia (cytogenetic abnormalities in the AML samples are listed in table S7). Two of the three CpG sites were significantly hypermethylated in AML compared to normal and/or remission bone marrow (figure 7B), but were not hypermethylated in promyelocytic leukemia cells, which express higher levels of CEBPE than other AML sub-types (figure 7B, figure S7). In contrast to the CEBPE promoter CpG, methylation levels at LINE-1 repetitive DNA element CpGs were similar in normal, remission, and AML bone marrow (figure 7C). The effect of decitabine treatment on CEBPE promoter and LINE-1 CpG methylation was examined in an AML cell line (THP1). Decitabine 0.5μM decreased CEBPE promoter CpG methylation by a much greater extent (>40–60%) than the ~20% decrease at LINE-1 CpG (figure 7D, figure S8). Decitabine-induced CEBPE promoter hypomethylation was accompanied by a substantial increase in CEBPE levels (figure 7D).
Figure 7. Maturation-responsive CpG in the CEBPE (CEBPε) promoter are aberrantly hypermethylated in AML cells.
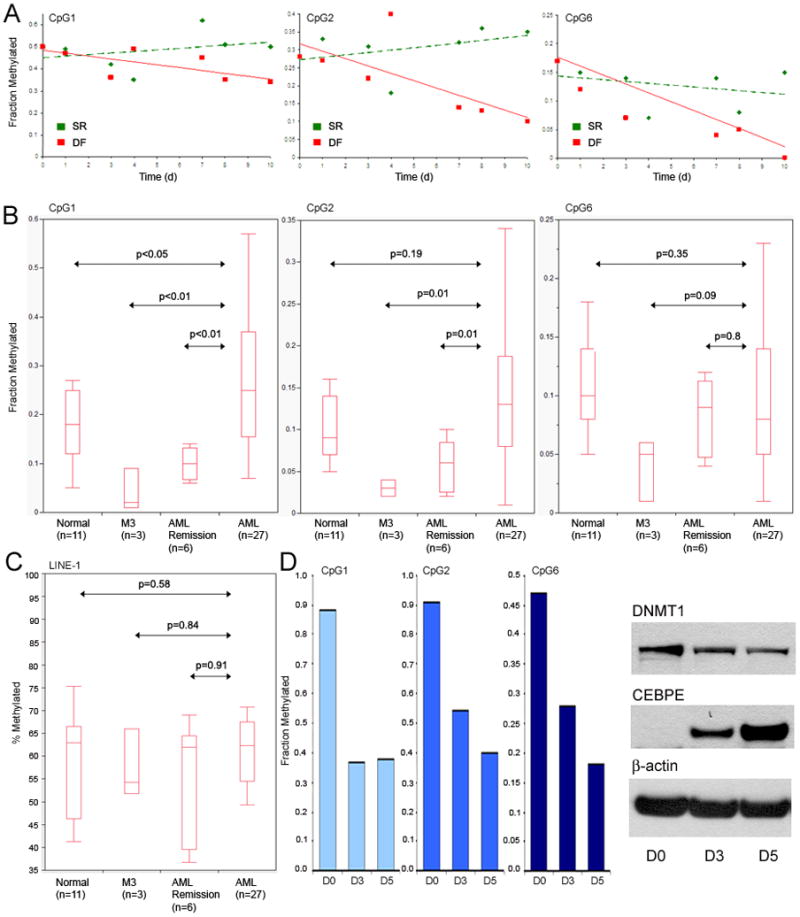
A) CpG sites in the CEBPE promoter that undergo hypomethylation during G-CSF treatment of normal CD34+ precursors were identified. Methylation measured by mass spectrometry. The identified CpG sites were in proximity to putative CEBPA and RUNX1 binding sites (figure S6). B) Methylation levels of these CpG sites in normal volunteer, AML in remission, AML, and promyelocytic leukemia (M3) bone marrow. M3 leukemia cells express higher levels of CEBPE than other AML sub-types (figure S7). C) LINE-1 repetitive DNA element CpG methylation in normal, remission, AML and M3 bone marrow. Methylation measured by pyrosequencing. D) Effect of decitabine treatment on methylation of CEBPE promoter CpG and on DNMT1 and CEBPE protein levels. LINE-1 methylation changes in figure S8. THP1 AML cells treated with decitabine 0.5 μM on day 1 and day 4. DNA harvested on 48 hrs (day 3) after the first decitabine treatment and 24 hours after the second decitabine treatment (day 5). Cells were harvested for Western blot at the same time-points as for DNA analysis.
DISCUSSION
Promoter CpG methylation patterns reflect differentiation context and stage (25). In primary MDS and AML cells, the pattern of methylation at maturation-responsive promoter CpGs mimicked the pattern in mature myeloid elements, and was the opposite of that in normal CD34+ precursors. In high risk MDS/AML samples, which contain more myeloblasts, and in uniformly morphologically immature CD34+ and CD34− AML cell lines, this pattern was emphasized. These observations suggest that MDS and AML cells are in at least some aspects maturation progressed from normal CD34+ precursors. Accordingly, MDS and AML cells express relatively high levels of key lineage-specifying TF CEBPA and PU.1 (SPI1), compared to normal CD34+ precursors or total bone marrow, and AML leukemia initiating cells frequently have surface-phenotype features of lineage-commitment (CD34+38+, CLL-1+, CD71+, CD90−, c-Kit-)(42–52). Despite high CEBPA expression, expression of CEBPE, a key downstream gene target of CEBPA, was relatively repressed in AML cells, accompanied by hypermethylation of differentiation-responsive CpG in the CEBPE promoter. Hypermethylation has also been reported for CpG in the promoter of CEBPD (CEBPδ), another late-differentiation gene target of CEBPA (53).
Why are key late-differentiation genes such as CEBPE and CEBPD epigenetically repressed in AML cells, despite high expression of lineage-specifying TF that should activate these genes? Genetic abnormalities in genes for lineage-specifying TF (eg., CEBPA) or their cofactors (eg., RUNX1) that compromise transactivation by these differentiation-drivers could have a role: in mice engineered to express mutated Cebpa (p30) with reduced transactivating capacity, the leukemia initiating cells that arose were lineage-committed with impaired expression of key late-differentiation genes including Cebpd (43). Similarly, Runx1 haploinsufficiency, a common abnormality in MDS and AML, impairs the usual cooperative gene activation by Runx1 and the differentiation driver Pu.1/Spi1, producing increased corepressor recruitment to Pu.1 and epigenetic repression of late-differentiation target genes (eg., Gm-csfr and Mcsfr) (54). Mutations in some chromatin modifying enzyme genes (e.g., ASXL1, EZH2) increase in frequency from MDS to AML (55–57). Possibly these genetic abnormalities additionally favor corepressor over coactivator recruitment at late-differentiation genes. DNMT1 depletion by decitabine, which not only hypomethylates DNA but disrupts DNMT1 containing histone modifying protein complexes involved in transcription repression, can potentially redress such corepressor/coactivator imbalance, and thereby trigger late-differentiation gene expression in these cells already expressing high levels of lineage-specifying TF. In contrast, in normal HSC which do not express high levels of lineage-specifying TF, DNMT1 depletion prevents stem cell gene repression by differentiation stimuli, thereby maintaining stem cell phenotype (6–15).
An important goal in MDS and AML research is to identify differences between malignant cells and normal HSC that can be exploited for therapy. In MDS/AML cells, the pattern of expression of key myeloid differentiation-driving TF, and methylation patterns at myeloid maturation-responsive CpG, suggests differentiation is impaired after lineage-commitment, mediated by aberrant epigenetic repression of some key late-differentiation driver genes. This maturation and epigenetic profile, distinct from that of normal HSC, likely plays a major role in the contrasting differentiation response of AML cells and normal HSC to decitabine and other chromatin-relaxing drugs.
Supplementary Material
Acknowledgments
We gratefully acknowledge the assistance of Dr Ying Jiang for bio-informatics analysis and sample preparation, Dr Pieter Faber and the Cleveland Clinic Genomics Core for processing of samples, and the following gifts: Mary Laughlin and Nick Greco at the Abraham J and Phyllis Katz Cord Blood Foundation and Cleveland Cord Blood Center for cord blood samples. YS is supported by NIH (1R01CA138858, U54HL090513), Dept. of Defense (PR081404). KPN is supported by Scott Hamilton CARES Foundation.
Footnotes
CONFLICTS OF INTEREST
The authors have no conflicts of interest to declare.
Supplementary information accompanies the paper on the Leukemia website (http://www.nature.com/leu)
References
- 1.Santi DV, Garrett CE, Barr PJ. On the mechanism of inhibition of DNA-cytosine methyltransferases by cytosine analogs. Cell. 1983;33(1):9–10. doi: 10.1016/0092-8674(83)90327-6. [DOI] [PubMed] [Google Scholar]
- 2.Covey JM, D’Incalci M, Tilchen EJ, Zaharko DS, Kohn KW. Differences in DNA damage produced by incorporation of 5-aza-2′-deoxycytidine or 5,6-dihydro-5-azacytidine into DNA of mammalian cells. Cancer Res. 1986;46(11):5511–5517. [PubMed] [Google Scholar]
- 3.Schermelleh L, Haemmer A, Spada F, Rosing N, Meilinger D, Rothbauer U, Cardoso MC, Leonhardt H. Dynamics of Dnmt1 interaction with the replication machinery and its role in postreplicative maintenance of DNA methylation. Nucleic Acids Res. 2007;35(13):4301–4312. doi: 10.1093/nar/gkm432. [DOI] [PMC free article] [PubMed] [Google Scholar]
- 4.Momparler RL, Goodman J. In vitro cytotoxic and biochemical effects of 5-aza-2′-deoxycytidine. Cancer Res. 1977;37(6):1636–1639. [PubMed] [Google Scholar]
- 5.Jones PA, Taylor SM. Cellular differentiation, cytidine analogs and DNA methylation. Cell. 1980;20(1):85–93. doi: 10.1016/0092-8674(80)90237-8. [DOI] [PubMed] [Google Scholar]
- 6.Milhem M, Mahmud N, Lavelle D, Araki H, Desimone J, Saunthararajah Y, Hoffman R. Modification of hematopoietic stem cell fate by 5aza 2′deoxycytidine and trichostatin A. Blood. 2004;103(11):4102–4110. doi: 10.1182/blood-2003-07-2431. [DOI] [PubMed] [Google Scholar]
- 7.Bug G, Gul H, Schwarz K, Pfeifer H, Kampfmann M, Zheng X, Beissert T, Boehrer S, Hoelzer D, Ottmann OG, Ruthardt M. Valproic acid stimulates proliferation and self-renewal of hematopoietic stem cells. Cancer Res. 2005;65(7):2537–2541. doi: 10.1158/0008-5472.CAN-04-3011. [DOI] [PubMed] [Google Scholar]
- 8.Young JC, Wu S, Hansteen G, Du C, Sambucetti L, Remiszewski S, O’Farrell AM, Hill B, Lavau C, Murray LJ. Inhibitors of histone deacetylases promote hematopoietic stem cell self-renewal. Cytotherapy. 2004;6(4):328–336. doi: 10.1080/14653240410004899. [DOI] [PubMed] [Google Scholar]
- 9.Araki H, Yoshinaga K, Boccuni P, Zhao Y, Hoffman R, Mahmud N. Chromatin-modifying agents permit human hematopoietic stem cells to undergo multiple cell divisions while retaining their repopulating potential. Blood. 2007;109(8):3570–3578. doi: 10.1182/blood-2006-07-035287. [DOI] [PubMed] [Google Scholar]
- 10.De Felice L, Tatarelli C, Mascolo MG, Gregorj C, Agostini F, Fiorini R, Gelmetti V, Pascale S, Padula F, Petrucci MT, Arcese W, Nervi C. Histone deacetylase inhibitor valproic acid enhances the cytokine-induced expansion of human hematopoietic stem cells. Cancer Res. 2005;65(4):1505–1513. doi: 10.1158/0008-5472.CAN-04-3063. [DOI] [PubMed] [Google Scholar]
- 11.Hu Z, Negrotto S, Gu X, Mahfouz R, Ng KP, Ebrahem Q, Copelan E, Singh H, Maciejewski JP, Saunthararajah Y. Decitabine maintains hematopoietic precursor self-renewal by preventing repression of stem cell genes by a differentiation-inducing stimulus. Mol Cancer Ther. 2010;9(6):1536–1543. doi: 10.1158/1535-7163.MCT-10-0191. [DOI] [PMC free article] [PubMed] [Google Scholar]
- 12.Chung YS, Kim HJ, Kim TM, Hong SH, Kwon KR, An S, Park JH, Lee S, Oh IH. Undifferentiated hematopoietic cells are characterized by a genome-wide undermethylation dip around the transcription start site and a hierarchical epigenetic plasticity. Blood. 2009;114(24):4968–4978. doi: 10.1182/blood-2009-01-197780. [DOI] [PubMed] [Google Scholar]
- 13.Suzuki M, Harashima A, Okochi A, Yamamoto M, Nakamura S, Motoda R, Yamasaki F, Orita K. 5-Azacytidine supports the long-term repopulating activity of cord blood CD34(+) cells. Am J Hematol. 2004;77(3):313–315. doi: 10.1002/ajh.20178. [DOI] [PubMed] [Google Scholar]
- 14.Broske AM, Vockentanz L, Kharazi S, Huska MR, Mancini E, Scheller M, Kuhl C, Enns A, Prinz M, Jaenisch R, Nerlov C, Leutz A, Andrade-Navarro MA, Jacobsen SE, Rosenbauer F. DNA methylation protects hematopoietic stem cell multipotency from myeloerythroid restriction. Nat Genet. 2009;41(11):1207–1215. doi: 10.1038/ng.463. [DOI] [PubMed] [Google Scholar]
- 15.Trowbridge JJ, Snow JW, Kim J, Orkin SH. DNA methyltransferase 1 is essential for and uniquely regulates hematopoietic stem and progenitor cells. Cell Stem Cell. 2009;5(4):442–449. doi: 10.1016/j.stem.2009.08.016. [DOI] [PMC free article] [PubMed] [Google Scholar]
- 16.Pinto A, Attadia V, Fusco A, Ferrara F, Spada OA, Di Fiore PP. 5-Aza-2′-deoxycytidine induces terminal differentiation of leukemic blasts from patients with acute myeloid leukemias. Blood. 1984;64(4):922–929. [PubMed] [Google Scholar]
- 17.Creusot F, Acs G, Christman JK. Inhibition of DNA methyltransferase and induction of Friend erythroleukemia cell differentiation by 5-azacytidine and 5-aza-2′-deoxycytidine. J Biol Chem. 1982;257(4):2041–2048. [PubMed] [Google Scholar]
- 18.Nowak D, Stewart D, Koeffler HP. Differentiation therapy of leukemia: 3 decades of development. Blood. 2009;113(16):3655–3665. doi: 10.1182/blood-2009-01-198911. [DOI] [PMC free article] [PubMed] [Google Scholar]
- 19.Niitsu N, Hayashi Y, Sugita K, Honma Y. Sensitization by 5-aza-2′-deoxycytidine of leukaemia cells with MLL abnormalities to induction of differentiation by all-trans retinoic acid and 1alpha,25-dihydroxyvitamin D3. Br J Haematol. 2001;112(2):315–326. doi: 10.1046/j.1365-2141.2001.02523.x. [DOI] [PubMed] [Google Scholar]
- 20.Kosugi H, Towatari M, Hatano S, Kitamura K, Kiyoi H, Kinoshita T, Tanimoto M, Murate T, Kawashima K, Saito H, Naoe T. Histone deacetylase inhibitors are the potent inducer/enhancer of differentiation in acute myeloid leukemia: a new approach to anti-leukemia therapy. Leukemia. 1999;13(9):1316–1324. doi: 10.1038/sj.leu.2401508. [DOI] [PubMed] [Google Scholar]
- 21.Wang J, Saunthararajah Y, Redner RL, Liu JM. Inhibitors of histone deacetylase relieve ETO-mediated repression and induce differentiation of AML1-ETO leukemia cells. Cancer Res. 1999;59(12):2766–2769. [PubMed] [Google Scholar]
- 22.Spira AI, Carducci MA. Differentiation therapy. Curr Opin Pharmacol. 2003;3(4):338–343. doi: 10.1016/s1471-4892(03)00081-x. [DOI] [PubMed] [Google Scholar]
- 23.Jones PA. DNA methylation and cancer. Cancer Res. 1986;46(2):461–466. [PubMed] [Google Scholar]
- 24.Lotem J, Sachs L. Epigenetics wins over genetics: induction of differentiation in tumor cells. Semin Cancer Biol. 2002;12(5):339–346. doi: 10.1016/s1044-579x(02)00054-8. [DOI] [PubMed] [Google Scholar]
- 25.Attema JL, Papathanasiou P, Forsberg EC, Xu J, Smale ST, Weissman IL. Epigenetic characterization of hematopoietic stem cell differentiation using miniChIP and bisulfite sequencing analysis. Proc Natl Acad Sci U S A. 2007;104(30):12371–12376. doi: 10.1073/pnas.0704468104. [DOI] [PMC free article] [PubMed] [Google Scholar]
- 26.Jiang Y, Dunbar A, Gondek LP, Mohan S, Rataul M, O’Keefe C, Sekeres M, Saunthararajah Y, Maciejewski JP. Aberrant DNA methylation is a dominant mechanism in MDS progression to AML. Blood. 2009;113(6):1315–1325. doi: 10.1182/blood-2008-06-163246. [DOI] [PMC free article] [PubMed] [Google Scholar]
- 27.Mulloy JC, Cammenga J, MacKenzie KL, Berguido FJ, Moore MA, Nimer SD. The AML1-ETO fusion protein promotes the expansion of human hematopoietic stem cells. Blood. 2002;99(1):15–23. doi: 10.1182/blood.v99.1.15. [DOI] [PubMed] [Google Scholar]
- 28.Bibikova M, Lin Z, Zhou L, Chudin E, Garcia EW, Wu B, Doucet D, Thomas NJ, Wang Y, Vollmer E, Goldmann T, Seifart C, Jiang W, Barker DL, Chee MS, Floros J, Fan JB. High-throughput DNA methylation profiling using universal bead arrays. Genome Res. 2006;16(3):383–393. doi: 10.1101/gr.4410706. [DOI] [PMC free article] [PubMed] [Google Scholar]
- 29.Ehrich M, Nelson MR, Stanssens P, Zabeau M, Liloglou T, Xinarianos G, Cantor CR, Field JK, van den BD. Quantitative high-throughput analysis of DNA methylation patterns by base-specific cleavage and mass spectrometry. Proc Natl Acad Sci U S A. 2005;102(44):15785–15790. doi: 10.1073/pnas.0507816102. [DOI] [PMC free article] [PubMed] [Google Scholar]
- 30.Heinemeyer T, Wingender E, Reuter I, Hermjakob H, Kel AE, Kel OV, Ignatieva EV, Ananko EA, Podkolodnaya OA, Kolpakov FA, Podkolodny NL, Kolchanov NA. Databases on transcriptional regulation: TRANSFAC, TRRD and COMPEL. Nucleic Acids Res. 1998;26(1):362–367. doi: 10.1093/nar/26.1.362. [DOI] [PMC free article] [PubMed] [Google Scholar]
- 31.Martin-Subero JI, Ammerpohl O, Bibikova M, Wickham-Garcia E, Agirre X, Alvarez S, Bruggemann M, Bug S, Calasanz MJ, Deckert M, Dreyling M, Du MQ, Durig J, Dyer MJ, Fan JB, Gesk S, Hansmann ML, Harder L, Hartmann S, Klapper W, Kuppers R, Montesinos-Rongen M, Nagel I, Pott C, Richter J, Roman-Gomez J, Seifert M, Stein H, Suela J, Trumper L, Vater I, Prosper F, Haferlach C, Cruz CJ, Siebert R. A comprehensive microarray-based DNA methylation study of 367 hematological neoplasms. PLoS ONE. 2009;4(9):e6986. doi: 10.1371/journal.pone.0006986. [DOI] [PMC free article] [PubMed] [Google Scholar]
- 32.Iwasaki H, Akashi K. Myeloid lineage commitment from the hematopoietic stem cell. Immunity. 2007;26(6):726–740. doi: 10.1016/j.immuni.2007.06.004. [DOI] [PubMed] [Google Scholar]
- 33.Yamanaka R, Barlow C, Lekstrom-Himes J, Castilla LH, Liu PP, Eckhaus M, Decker T, Wynshaw-Boris A, Xanthopoulos KG. Impaired granulopoiesis, myelodysplasia, and early lethality in CCAAT/enhancer binding protein epsilon-deficient mice. Proc Natl Acad Sci U S A. 1997;94(24):13187–13192. doi: 10.1073/pnas.94.24.13187. [DOI] [PMC free article] [PubMed] [Google Scholar]
- 34.Theilgaard-Monch K, Jacobsen LC, Borup R, Rasmussen T, Bjerregaard MD, Nielsen FC, Cowland JB, Borregaard N. The transcriptional program of terminal granulocytic differentiation. Blood. 2005;105(4):1785–1796. doi: 10.1182/blood-2004-08-3346. [DOI] [PubMed] [Google Scholar]
- 35.Stirewalt DL, Meshinchi S, Kopecky KJ, Fan W, Pogosova-Agadjanyan EL, Engel JH, Cronk MR, Dorcy KS, McQuary AR, Hockenbery D, Wood B, Heimfeld S, Radich JP. Identification of genes with abnormal expression changes in acute myeloid leukemia. Genes Chromosomes Cancer. 2008;47(1):8–20. doi: 10.1002/gcc.20500. [DOI] [PubMed] [Google Scholar]
- 36.Ferrari F, Bortoluzzi S, Coppe A, Basso D, Bicciato S, Zini R, Gemelli C, Danieli GA, Ferrari S. Genomic expression during human myelopoiesis. BMC Genomics. 2007;8:264. doi: 10.1186/1471-2164-8-264. [DOI] [PMC free article] [PubMed] [Google Scholar]
- 37.Valk PJ, Verhaak RG, Beijen MA, Erpelinck CA, Barjesteh van Waalwijk van Doorn-Khosrovani, Boer JM, Beverloo HB, Moorhouse MJ, van der Spek PJ, Lowenberg B, Delwel R. Prognostically useful gene-expression profiles in acute myeloid leukemia. N Engl J Med. 2004;350(16):1617–1628. doi: 10.1056/NEJMoa040465. [DOI] [PubMed] [Google Scholar]
- 38.Cheung AM, Chow HC, Liang R, Leung AY. A comparative study of bone marrow and peripheral blood CD34+ myeloblasts in acute myeloid leukaemia. Br J Haematol. 2009;144(4):484–491. doi: 10.1111/j.1365-2141.2008.07431.x. [DOI] [PubMed] [Google Scholar]
- 39.Pellagatti A, Cazzola M, Giagounidis AA, Malcovati L, Porta MG, Killick S, Campbell LJ, Wang L, Langford CF, Fidler C, Oscier D, Aul C, Wainscoat JS, Boultwood J. Gene expression profiles of CD34+ cells in myelodysplastic syndromes: involvement of interferon-stimulated genes and correlation to FAB subtype and karyotype. Blood. 2006;108(1):337–345. doi: 10.1182/blood-2005-12-4769. [DOI] [PubMed] [Google Scholar]
- 40.Majeti R, Becker MW, Tian Q, Lee TL, Yan X, Liu R, Chiang JH, Hood L, Clarke MF, Weissman IL. Dysregulated gene expression networks in human acute myelogenous leukemia stem cells. Proc Natl Acad Sci U S A. 2009;106(9):3396–3401. doi: 10.1073/pnas.0900089106. [DOI] [PMC free article] [PubMed] [Google Scholar]
- 41.Nakajima H, Ihle JN. Granulocyte colony-stimulating factor regulates myeloid differentiation through CCAAT/enhancer-binding protein epsilon. Blood. 2001;98(4):897–905. doi: 10.1182/blood.v98.4.897. [DOI] [PubMed] [Google Scholar]
- 42.Taussig DC, Miraki-Moud F, Anjos-Afonso F, Pearce DJ, Allen K, Ridler C, Lillington D, Oakervee H, Cavenagh J, Agrawal SG, Lister TA, Gribben JG, Bonnet D. Anti-CD38 antibody-mediated clearance of human repopulating cells masks the heterogeneity of leukemia-initiating cells. Blood. 2008;112(3):568–575. doi: 10.1182/blood-2007-10-118331. [DOI] [PubMed] [Google Scholar]
- 43.Kirstetter P, Schuster MB, Bereshchenko O, Moore S, Dvinge H, Kurz E, Theilgaard-Monch K, Mansson R, Pedersen TA, Pabst T, Schrock E, Porse BT, Jacobsen SE, Bertone P, Tenen DG, Nerlov C. Modeling of C/EBPalpha mutant acute myeloid leukemia reveals a common expression signature of committed myeloid leukemia-initiating cells. Cancer Cell. 2008;13(4):299–310. doi: 10.1016/j.ccr.2008.02.008. [DOI] [PubMed] [Google Scholar]
- 44.Huntly BJ, Shigematsu H, Deguchi K, Lee BH, Mizuno S, Duclos N, Rowan R, Amaral S, Curley D, Williams IR, Akashi K, Gilliland DG. MOZ-TIF2, but not BCR-ABL, confers properties of leukemic stem cells to committed murine hematopoietic progenitors. Cancer Cell. 2004;6(6):587–596. doi: 10.1016/j.ccr.2004.10.015. [DOI] [PubMed] [Google Scholar]
- 45.Somervaille TC, Cleary ML. Identification and characterization of leukemia stem cells in murine MLL-AF9 acute myeloid leukemia. Cancer Cell. 2006;10(4):257–268. doi: 10.1016/j.ccr.2006.08.020. [DOI] [PubMed] [Google Scholar]
- 46.van Rhenen A, Moshaver B, Kelder A, Feller N, Nieuwint AW, Zweegman S, Ossenkoppele GJ, Schuurhuis GJ. Aberrant marker expression patterns on the CD34+ Leukemia. 2007;21(8):1700–1707. doi: 10.1038/sj.leu.2404754. [DOI] [PubMed] [Google Scholar]
- 47.Blair A, Hogge DE, Ailles LE, Lansdorp PM, Sutherland HJ. Lack of expression of Thy-1 (CD90) on acute myeloid leukemia cells with long-term proliferative ability in vitro and in vivo. Blood. 1997;89(9):3104–3112. [PubMed] [Google Scholar]
- 48.Blair A, Sutherland HJ. Primitive acute myeloid leukemia cells with long-term proliferative ability in vitro and in vivo lack surface expression of c-kit (CD117) Exp Hematol. 2000;28(6):660–671. doi: 10.1016/s0301-472x(00)00155-7. [DOI] [PubMed] [Google Scholar]
- 49.Wunderlich M, Chou FS, Link KA, Mizukawa B, Perry RL, Carroll M, Mulloy JC. AML xenograft efficiency is significantly improved in NOD/SCID-IL2RG mice constitutively expressing human SCF, GM-CSF and IL-3. Leukemia. 2010;24(10):1785–1788. doi: 10.1038/leu.2010.158. [DOI] [PMC free article] [PubMed] [Google Scholar]
- 50.Feuring-Buske M, Gerhard B, Cashman J, Humphries RK, Eaves CJ, Hogge DE. Improved engraftment of human acute myeloid leukemia progenitor cells in beta 2-microglobulin-deficient NOD/SCID mice and in NOD/SCID mice transgenic for human growth factors. Leukemia. 2003;17(4):760–763. doi: 10.1038/sj.leu.2402882. [DOI] [PubMed] [Google Scholar]
- 51.Agliano A, Martin-Padura I, Mancuso P, Marighetti P, Rabascio C, Pruneri G, Shultz LD, Bertolini F. Human acute leukemia cells injected in NOD/LtSz-scid/IL-2Rgamma null mice generate a faster and more efficient disease compared to other NOD/scid-related strains. Int J Cancer. 2008;123(9):2222–2227. doi: 10.1002/ijc.23772. [DOI] [PubMed] [Google Scholar]
- 52.Sarry JE, Murphy K, Perry R, Sanchez PV, Secreto A, Keefer C, Swider CR, Strzelecki AC, Cavelier C, Recher C, Mansat-De Mas V, Delabesse E, Danet-Desnoyers G, Carroll M. Human acute myelogenous leukemia stem cells are rare and heterogeneous when assayed in NOD/SCID/IL2Rgammac-deficient mice. J Clin Invest. 2011;121(1):384–395. doi: 10.1172/JCI41495. [DOI] [PMC free article] [PubMed] [Google Scholar]
- 53.Agrawal S, Hofmann WK, Tidow N, Ehrich M, van den BD, Koschmieder S, Berdel WE, Serve H, Muller-Tidow C. The C/EBPdelta tumor suppressor is silenced by hypermethylation in acute myeloid leukemia. Blood. 2007;109(9):3895–3905. doi: 10.1182/blood-2006-08-040147. [DOI] [PubMed] [Google Scholar]
- 54.Hu Z, Gu X, Baraoidan K, Ibanez V, Sharma A, Kadkol S, Munker R, Ackerman S, Nucifora G, Saunthararajah Y. RUNX1 regulates corepressor interactions of PU.1. Blood. 2011 doi: 10.1182/blood-2010-10-312512. [DOI] [PMC free article] [PubMed] [Google Scholar]
- 55.Rocquain J, Carbuccia N, Trouplin V, Raynaud S, Murati A, Nezri M, Tadrist Z, Olschwang S, Vey N, Birnbaum D, Gelsi-Boyer V, Mozziconacci MJ. Combined mutations of ASXL1, CBL, FLT3, IDH1, IDH2, JAK2, KRAS, NPM1, NRAS, RUNX1, TET2 and WT1 genes in myelodysplastic syndromes and acute myeloid leukemias. BMC Cancer. 2010;10:401. doi: 10.1186/1471-2407-10-401. [DOI] [PMC free article] [PubMed] [Google Scholar]
- 56.Boultwood J, Perry J, Pellagatti A, Fernandez-Mercado M, Fernandez-Santamaria C, Calasanz MJ, Larrayoz MJ, Garcia-Delgado M, Giagounidis A, Malcovati L, Della Porta MG, Jadersten M, Killick S, Hellstrom-Lindberg E, Cazzola M, Wainscoat JS. Frequent mutation of the polycomb-associated gene ASXL1 in the myelodysplastic syndromes and in acute myeloid leukemia. Leukemia. 2010;24(5):1062–1065. doi: 10.1038/leu.2010.20. [DOI] [PubMed] [Google Scholar]
- 57.Makishima H, Jankowska AM, Tiu RV, Szpurka H, Sugimoto Y, Hu Z, Saunthararajah Y, Guinta K, Keddache MA, Putnam P, Sekeres MA, Moliterno AR, List AF, McDevitt MA, Maciejewski JP. Novel homo- and hemizygous mutations in EZH2 in myeloid malignancies. Leukemia. 2010;24(10):1799–1804. doi: 10.1038/leu.2010.167. [DOI] [PubMed] [Google Scholar]
Associated Data
This section collects any data citations, data availability statements, or supplementary materials included in this article.