

Abstract

The racemic product of the Betti reaction of 5-chloro-8-hydroxyquinoline, benzaldehyde, and 2-aminopyridine was separated by chiral HPLC to determine which enantiomer inhibited botulinum neurotoxin serotype A. When the enantiomers unexpectedly proved to have comparable activity, the absolute structures of (+)-(R)-1 and (−)-(S)-1 were determined by comparison of calculated and observed circular dichroism spectra. Molecular modeling studies were undertaken in an effort to understand the observed bioactivity and revealed different ensembles of binding modes, with roughly equal binding energies, for the two enantiomers.
Keywords: Chiral resolution, Betti reaction products, TDDFT CD calculations, molecular docking, inhibition of botulinum neurotoxin
We recently reported the identification of 7-substituted 8-hydroxyquinolines (e.g., 1), products of the Betti reaction, as leads to potential chemotherapies for botulinum poisoning.1 The Betti reaction2 originated as a condensation of Schiff bases with 2-naphthol,3,4 but it was later extended to other nucleophilic aromatic substrates, e.g., 8-hydroxyquinoline.5 While a chiral center is formed in this reaction, the products are typically racemic mixtures, as the reagents are usually achiral (Scheme 1). Over the years, there have been several efforts to resolve Betti product racemates, most of which involve preparing diastereomeric salts with chiral acids.6−8
Scheme 1.

Chiral chromatography seemed an obvious alternative for resolution of these racemates, but we examined a total of six chiral columns and 18 different methods before observing sufficient resolution of the two enantiomers on a Chiralcel OD column to permit semipreparative purification of adequate quantities of (+)-1 and (−)-1 for evaluation in our bioassays and assignment of absolute configuration (Figures S1 and S2 of the Supporting Information).
Initial comparison of the botulinum neurotoxin serotype A (BoNT/A) inhibitory activity of the (+) and (−) enantiomers of 1 was accomplished via an HPLC-based assay using a full-length recombinant BoNT/A protease light chain (LC).1 To our surprise, both compounds displayed similar IC50 values, 1.0 and 1.1 μM for (+)-1 and (−)-1, respectively. We subsequently evaluated their potential to inhibit the biological activity of BoNT/A holotoxin in murine neuroblastoma N2a cells.1 No difference was observed in percent inhibition (P > 0.05) of SNAP-25 cleavage for both enantiomers and the racemate (±)-1 at the four concentrations tested (60, 45, 30, and 15 μM). We then examined the efficacy of these compounds in mouse phrenic nerve hemidiaphragm preparations (MPNHDA).1 Similar to observations in HPLC and cell-based assays, both (+)-1 and (−)-1 were equipotent (P = 0.94) in the tissue-based assay. At 2 μM concentrations, both enantiomers dramatically delayed (P = 1.58 × 10⁻⁸ and 2.30 × 10⁻⁶ for (+)-1 and (−)-1, respectively) the BoNT/A-induced paralytic half-time 3-fold. The comparative testing of (±)-1 and the two enantiomers is summarized in Table 1.
Table 1. Comparative Testing of (±)-1, (+)-1, and (−)-1a.
| HPLC assay |
N2a cell culture assay |
MPNHDAb | ||||||
|---|---|---|---|---|---|---|---|---|
| % inhibition |
IC50 | % inhibition of SNAP-25 cleavage |
minutesc,d | |||||
| sample | 20 μM | 5 μM | (μM) | 60 μM | 45 μM | 30 μM | 15 μM | 2 μM |
| (±)-1 | 92 | 88 | 1.5 | 91 | 90 | 74 | 41 | NDe |
| (+)-1 | 94 | 90 | 1.1 | 96 | 94 | 89 | 56 | 191f |
| (−)-1 | 91 | 90 | 1.0 | 96 | 93 | 69 | 54 | 188f |
Assays conducted as described in ref (1) and the Supporting Information.
Mouse phrenic nerve hemidiaphragm assay.
Average time to 50% loss of twitch tension (min).
Average value for BoNT/A toxin control was 63 min.
Not determined.
P value < 0.001 (highly significant) for comparison with values recorded for the BoNT/A control; statistical analyses performed using SigmaPlot 10 (Systat Software, San Jose, CA).
We then turned to assigning the absolute configuration of (+)-1 and (−)-1 via comparison of calculated and experimental electronic dichroism (CD) spectra. As a prelude, we determined the 3-dimensional conformation of 1 through a series of NMR experiments. Proton and carbon resonances were assigned from a combination of COSY, HSQC, and HMBC experiments (Table S1, Supporting Information). Numerous NOE interactions were observed in the NOESY experiment (Scheme 2), with those of NH, OH, H6, and H9 providing the greatest insight into the conformation of the compound. While all NMR data were obtained for the racemic mixture, the (S)-enantiomer is shown for ease of portraying the structural analysis. The observed NOE between H6 and H18a,b and lack of NOE between the C8 hydroxyl proton and H18a,b indicate that the phenyl ring is rotated away from the C8 OH. The NOE between the OH and the NH, as well as the OH and H9 interaction, supports this conformation. The phenyl ring assumes a position perpendicular to the quinoline ring system to minimize steric interactions. This is supported by NOEs of H18a,b with H6, H9, and the NH. Interestingly, H15 and H16 both have an NOE with the NH, but not with H9, suggesting that the pyridine ring is oriented so as to place the ring nitrogen toward H9, while H15 and H16 are projected away. Also, this allows the pyridine ring to be orthogonal to the quinoline and pseudoparallel to the phenyl ring, further minimizing steric interactions. A locked conformation of the compound due to hydrogen bonding between the lone pair of the NH and the proton of the C8 hydroxyl is highly probable. However, the high number of NOEs for the NH (OH, H6, H9, H18a,b, and H19a,b) implies that the structure may not be entirely rigid.
Scheme 2.

To assign the absolute configuration of (+)- and (−)-1, their electronic CD spectra9,10 were recorded in solution and compared with those calculated using the time-dependent DFT (TDDFT) method.11,12 The enantiomers of 1 show almost mirror image CD spectra in methanol, as expected (Figure 1). Due to the presence of three different aromatic chromophores, these spectra feature many bands between 200 and 350 nm. For the (+)-enantiomer, the first band appearing in the 280−340 nm region is broad and positive, followed by a moderately intense negative band centered around 260 nm and two stronger bands, a positive one at 245 nm and a negative one around 220 nm.
Figure 1.

CD spectra of the enantiomers of 1 in methanol; concentration 4.8 × 10⁻⁵ M.
Several rotatable bonds in the structure of 1, most directly affecting the relative orientation of the chromophores, made obtaining a reliable set of input structures crucial for CD calculations. A preliminary molecular-mechanics conformational search was run with the MMFF force field, using a starting geometry with (R) absolute configuration (see Supporting Information for details). All low-energy structures obtained were optimized with the DFT method at the B3LYP/6-31G(d) level, converging to a set of nine distinct conformers within 10 kJ/mol. Their energies and populations at 298.15 K were estimated with B3LYP/6-311++G(d,p) in methanol (PCM solvent model).13 The low-energy DFT structures were then checked against the conformational picture provided by NMR experiments, bearing in mind that the coexistence of several low-energy minima rendered interpretation of NOEs in terms of a single conformation questionable. The calculated structures may be divided into two subsets according to the rotation around the C7−C9 bond. In one (major) subset, composed of four lowest-energy conformers, H9 is directed toward the OH. Within this subset, two conformers are especially stable (absolute minimum, 30.8% population at 298.15 K; second lowest minimum, +0.37 kJ/mol, 26.5%; Figure 2); the structures and relative energies for all minima are reported in the Supporting Information. In the second (minor) subset, composed of the remaining five conformers accounting for 25% overall population, H9 is again in the plane of the quinoline ring but directed toward C6. These findings corroborate the observed NOEs that NH and H9 each have with both the C8 OH and H6.
Figure 2.
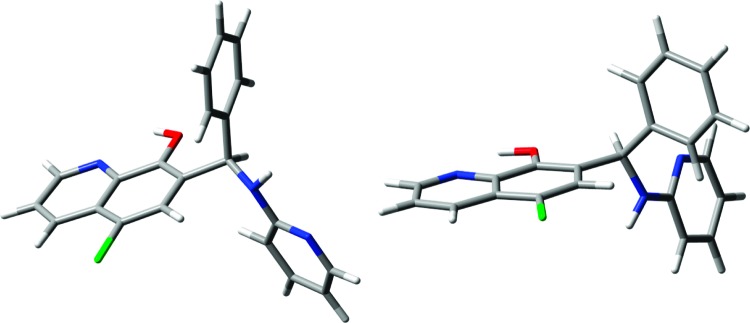
DFT-optimized structures for the absolute lowest energy (left) and second lowest energy (right) conformers of (R)-1.
Taking the lowest-energy structure as a test molecule, TDDFT calculations were run using different combinations of hybrid DFT functionals (B3LYP, PBE0, CAM-B3LYP, BH&HLYP) and basis sets (SVP, TZVP, aug-TZVP),14in vacuo or in methanol. The three basis sets led to very similar results (using B3LYP), except for a small red shift observed for all computed transitions on increasing the basis size. It appears that the two “standard” functionals B3LYP and PBE0 led to calculated transition energies underestimated with respect to the experiment, while the opposite was true for Coulomb-attenuated B3LYP (CAM-B3LYP) and the half a d-half functional BH&HLYP. Looking, for example, at the absorption band measured at 250 nm, the calculated transition wavelength was 270 and 230 nm with B3LYP/aug-TZVP and CAM-B3LYP/SVP, respectively. Apart from a systematic wavelength shift, the shape of the calculated CD spectrum was similar in all cases. Finally, including the solvent model in CAM-B3LYP/SVP calculations did not appreciably change calculated frequencies and spectra.
TDDFT calculations were then run on all low-energy structures using the two combinations B3LYP/aug-TZVP and CAM-B3LYP/SVP in vacuo. The resulting CD spectra were weighted with the respective Boltzmann factors (estimated from B3LYP/6-311+G(d,p) internal energies in methanol) at 298.15 K and summed to afford weighted average spectra. In all cases, input structures had (R) absolute configuration. Figure 3 displays spectra computed with the two methods for the lowest-energy structure and the weighted averages over nine structures. Apart from the already discussed wavelength shift (taken into account by a frequency correction in Figure 3), the overall shapes of the four spectra are quite similar, especially in the low-energy region (where TDDFT calculations are intrinsically more accurate).15 CAM-B3LYP/SVP results agree especially well with the experimental spectrum for (+)-1 in sign, position, and intensity of bands (Figure 3b). Therefore, the absolute configuration of the enantiomers of compound 1 may be assigned as (+)-(R)-1 and (−)-(S)-1. It must be noted that the calculated average CD spectrum is the superposition of very heterogeneous component spectra; thus, the apparent bands are actually the convolution from several transitions (Supporting Information).
Figure 3.

CD spectra calculated for (R)-1 with two TDDFT methods: (A) B3LYP/aug-TZVP; (B) CAM-B3LYP/SVP. Blue lines: spectra calculated for the lowest-energy DFT structure (divided by 2 for better comparison). Black lines: averages of spectra calculated for nine low-energy DFT structures weighted with Boltzmann factors at 298.15 K using populations estimated with B3LYP/6-311G++(d,p) in methanol. Red dashed line: experimental spectrum for (+)-1. Frequency corrections of +2500 cm−1 and −2000 cm−1 have been applied to calculated spectra in panels A and B, respectively.
The unexpected observation of virtually equivalent BoNT/A-inhibitory activity for the enantiomers in three different bioassays prompted us to examine the bound state of the ligands to rationalize the apparent lack of discrimination. Given the observed pharmacological activity, we hypothesized that both enantiomers bind BoNT/A, presumably in the Zn2+-containing active site. Nevertheless, experimental observations suggest that binding of a similar ligand is not exclusively due to Zn2+ chelation.1,16 To test this hypothesis computationally, we assessed relative binding free energies for the enantiomers by performing Thermodynamic Integration with Molecular Dynamics simulations17 (see the Supporting Information for details). Because the protonation state of the bound ligand is unknown, we assumed that both enantiomers bind the active site Zn2+ without ionization of the OH group. Using 10 lowest stable conformations of each ligand, we generated corresponding complex conformations by superposing the quinoline moiety onto a template complex derived with AutoDock4.0.18−21 The resulting calculations indicated that the (−)-S-enantiomer would bind BoNT/A by 3.8 ± 2.4 kcal/mol more favorably than its (+)-R-counterpart.
The large standard deviation in the free energy calculations indicates significant variability in the conformational ensembles of the bound ligands. To analyze the variety of binding modes of both (+)-R-1 and (−)-S-1 to BoNT/A, along with the corresponding binding features, we performed GROMOS-style clustering22 of the sparsely saved simulation trajectories in the physical state for each of the 10 starting configurations of the (R)-and (S)- complexes. (Table S3 of the Supporting Information summarizes the 16 most prominent features describing the two ensembles and comprising H-bonding interactions, coordinating bonds to the Zn2+ ion and π−π interactions.) The most robust features include coordinate bonds of atoms O, N1 (quinoline), and N12 (pyridine) to the Zn2+ ion. Depending on the number of bonds, the ligand can be monodentate or bidentate. When both O and N12 chelate the Zn2+, the N10 (amine) atom is brought sufficiently close to the Zn2+ that this coordination mode could be considered as tridentate. The most common H-bonding interaction is that of the coordinated OH group with the carboxyl of E224.
Clustering analysis of the trajectories of the protein−ligand complexes captured the diversity of the binding modes that can be described by a few features. Most of these features are common to both enantiomers and pertain to specific interactions of the ligand with the binding site residues. We found that the (−)-S-1 ensemble, on average, has more interaction features per cluster, 3.6 versus 3.0 for that of the (+)-R-1. In addition, the (−)-S-1 ensemble has a larger number of unique interactions with the active site compared to that of the (+)-R-1. These observations are consistent with the computed binding free energy difference. Figure 4 illustrates examples of the likely binding mode for each enantiomer.
Figure 4.

Examples of binding modes for the (R)-enantiomer (A) and (S)-enantiomer (B). Active site residues (yellow) of the protein (green) participate in binding of the Zn2+ (magenta) and the ligand (gray). Blue and red colors correspond to oxygen and nitrogen atoms. Certain active site residues and hydrogen atoms are omitted for clarity. The red dashed lines show some coordinating and hydrogen bonds.
Only a few interactions exist that can differentiate between the two enantiomers. In particular, the N10H−E224 interaction is realized only by the (R)-enantiomer, whereas the interactions OH-Y366, N12−F163(NH), and Ar:Phe-Y366 are only realized by the (S)-enantiomer. Although it is possible that different realizations of common interaction features by the enantiomers can further contribute to binding disparity, quantifying those differences could be daunting.
The fact that our calculations favor BoNT/A binding by the (−)-S-1 suggests that, in reality, the ligands might bind differently. Unlike experimental measurements, our calculated values provide a more limited assessment of the relative binding affinities of the two enantiomers under specified assumptions. It is also possible that the ligand can undergo epimerization, similar to that of ibuprofen23,24 in the presence of certain enzymes.25
In conclusion, we separated the enantiomers of 1 (chiral HPLC), established their chemical structure (NMR) and absolute configuration (CD, molecular modeling), evaluated their BoNT/A inhibitory activity, and explored their docking motifs with BoNT/A LC. To our knowledge, this is the first use of CD calculations to assign the absolute configuration of Betti reaction product enantiomers. While chiral chromatography has recently been applied to the separation of naphthol-based Betti products,26,27 this is the first such separation of Betti products comprised of 8-hydroxyquinoline, an aryl aldehyde and an aryl amine.
While, in a vast majority of cases, one enantiomer of a racemic drug or drug candidate has significantly greater pharmacological activity than the other, as has recently been demonstrated for one BoNT/A inhibitor,28 we found essentially equivalent BoNT/A-inhibitory activity in (+)-(R)-1 and (−)-(S)-1. However, this unexpected finding can be explained by the proposed docking motifs for the two enantiomers—different ensembles, but nearly equivalent in energy. We are currently seeking to confirm those binding models by crystallizing each enantiomer in the active site of BoNT/A.
Acknowledgments
This work was supported by a grant to L.A.S. from the Defense Threat Reduction Agency, JSTO-CBD Project Number 3.10037_07_RD_B. R.C.V. was funded by a National Research Council Research Associateship Award. This work was sponsored by the U.S. Department of Defense High Performance Computing Modernization Program (HPCMP), under the High Performance Computing Software Applications Institutes (HSAI) initiative. We thank James Bougie for help with the chiral HPLC separation. Opinions or assertions contained herein are the private views of the authors and are not to be construed as reflecting the official views of the United States Department of Defense.
Supporting Information Available
Experimental protocols for synthesis, chiral separation, and biological testing of (±)-1, 1H and 13C NMR assignments and NOE interactions, CD calculations leading to assignment of the absolute configurations of (+)-1 and (−)-1, and molecular modeling and docking of (+)- and (−)- 1 into the BoNT/A light chain. This material is available free of charge via the Internet at http://pubs.acs.org.
Supplementary Material
References
- Roxas-Duncan V.; Enyedy I.; Montgomery V. A.; Eccard V. S.; Carrington M. A.; Lai H.; Gul N.; Yang D. C.; Smith L. A. Identification and biochemical characterization of small-molecule inhibitors of Clostridium botulinum neurotoxin serotype A. Antimicrob. Agents Chemother. 2009, 53, 3478–3486. [DOI] [PMC free article] [PubMed] [Google Scholar]
- Betti M. On the addition of benzyl amine to naphthol. Gazz. Chim. Ital. 1900, 30II301–309. [Google Scholar]
- Betti M. General condensation reaction between β-naphthol, aldehydes and amines. Gazz. Chim. Ital. 1900, 30II310–316. [Google Scholar]
- Cardellicchio C.; Capozzi M. A. M.; Naso F. The Betti base: the awakening of a sleeping beauty. Tetrahedron: Asymmetry 2010, 21, 507–517. [Google Scholar]
- Phillips J. D. The reactions of 8-quinolinol. Chem. Rev. 1956, 56, 271–297. [Google Scholar]
- Betti M. Cleavage/fission of the naphtholbenzylamine into its optical antipodes. Gazz. Chim. Ital. 1906, 36II392–394. [Google Scholar]
- Cardellicchio C.; Ciccarella G.; Naso F.; Schingaro E.; Scordari F. The Betti base: absolute configuration and routes to a family of related chiral nonracemic bases. Tetrahedron: Asymmetry 1998, 9, 3667–3675. [Google Scholar]
- Dong Y.; Li R.; Lu J.; Xu X.; Wang X.; Hu Y. An efficient kinetic resolution of racemic Betti base based on an enantioselective N,O-deketalization. J. Org. Chem. 2005, 70, 8617–8620. [DOI] [PubMed] [Google Scholar]
- Berova N., Nakanishi K., Woody R. W., Eds. Circular Dichroism: Principles and Applications, 2nd ed.; Wiley-VCH: Weinheim, 2000. [Google Scholar]
- Berova N.; Di Bari L.; Pescitelli G. Application of electronic circular dichroism in configurational and conformational analysis of organic compounds. Chem. Soc. Rev. 2007, 36, 914–931. [DOI] [PubMed] [Google Scholar]
- Autschbach J. Computing chiroptical properties with first-principles theoretical methods: Background and illustrative examples. Chirality 2009, 21, S116–S152. [DOI] [PubMed] [Google Scholar]
- Pescitelli G.; Kurtán T.; Flörke U.; Krohn K. Absolute structural elucidation of natural products - A focus on quantum-mechanical calculations of solid-state CD spectra. Chirality 2009, 21, S181–S201. [DOI] [PubMed] [Google Scholar]
- Tomasi J., Mennucci B., Cammi R., Eds. Continuum Solvation Models in Chemical Physics: From Theory to Applications; Wiley: Chichester, 2007. [Google Scholar]
- TDDFT calculations were run with Gaussian 09, Revision A.02; Frisch M. J.; et al. Gaussian, Inc.: Wallingford, CT, 2009. See Gaussian’09 documentation at www.gaussian.com/g_tech/g_ur/g09help.htmfor references on DFT functionals and basis sets and the Supporting Information for the complete G09 reference and calculation details. [Google Scholar]
- Casida M. E.; Jamorski C.; Casida K. C.; Salahub D. R. Molecular excitation energies to high-lying bound states from time-dependent density-functional response theory: characterization and correction of the time-dependent local density approximation ionization threshold. J. Chem. Phys. 1998, 108, 4439–4449. [Google Scholar]
- Lai H.; Feng M.; Roxas-Duncan V.; Dakshanamurthy S.; Smith L. A.; Yang D. C. Quinolinol and peptide inhibitors of zinc protease in botulinum neurotoxin A: effects of zinc ion and peptides on inhibition. Arch. Biochem. Biophys. 2009, 491, 75–84. [DOI] [PubMed] [Google Scholar]
- Khavrutskii I. V.; Wallqvist A. Computing relative free energies of solvation using single reference thermodynamic integration augmented with Hamiltonian replica exchange. J. Chem. Theory Comput. 2010, 6, 3427–3441. [DOI] [PMC free article] [PubMed] [Google Scholar]
- Goodsell D. S.; Morris G. M.; Olson A. J. Automated docking of flexible ligands: applications of AutoDock. J. Mol. Recognit. 1996, 9, 1–5. [DOI] [PubMed] [Google Scholar]
- Morris G. M.; Goodsell D. S.; Huey R.; Olson A. J. Distributed automated docking of flexible ligands to proteins: parallel applications of AutoDock 2.4. J. Comput.-Aided Mol. Des. 1996, 10, 293–304. [DOI] [PubMed] [Google Scholar]
- Jiang X.; Kumar K.; Hu X.; Wallqvist A.; Reifman J. DOVIS 2.0: An efficient and easy to use parallel virtual screening tool based on AutoDock 4.0. Chem. Central J. 2008, 2, 1–7. [DOI] [PMC free article] [PubMed] [Google Scholar]
- Zhang S.; Kumar K.; Jiang X.; Wallqvist A.; Reifman J. DOVIS: an implementation for high-throughput virtual screening using AutoDock. BMC Bioinformatics 2007, 9, 1–4. [DOI] [PMC free article] [PubMed] [Google Scholar]
- Daura X.; Gademann K.; Jaun B.; Seebach D.; Gunsteren W. F. V.; Mark A. E. Peptide folding: when simulation meets experiment. Angew. Chem., Int. Ed. 1999, 38, 236–240. [Google Scholar]
- Chen C. S.; Shieh W. R.; Lu P. H.; Harriman S.; Chen C. Y. Metabolic stereoisomeric inversion of ibuprofen in mammals. Biochim. Biophys. Acta 1991, 1078, 411–417. [DOI] [PubMed] [Google Scholar]
- Tracy T. S.; Hall S. D. Metabolic inversion of (R)-ibuprofen. Epimerization and hydrolysis of ibuprofenyl-coenzyme A. Drug Metab. Dispos. 1992, 20, 322–327. [PubMed] [Google Scholar]
- Reichel C.; Brugger R.; Bang H.; Geisslinger G.; Brune K. Molecular cloning and expression of a 2-arylpropionyl-coenzyme A epimerase: a key enzyme in the inversion metabolism of ibuprofen. Mol. Pharmacol. 1997, 51, 576–582. [DOI] [PubMed] [Google Scholar]
- Sztojkov-Ivanov A.; Toth D.; Szatmári I.; Fűlöp F.; Péter A. High-performance liquid chromatographic enantioseparation of 1-(aminoalkyl)-2-naphthol analogs on polysaccharide-based chiral stationary phases. Chirality 2007, 19, 374–379. [DOI] [PubMed] [Google Scholar]
- Ilisz I.; Pataj Z.; Berkecz R.; Szatmári I.; Fűlöp F.; Péter A. High-performance liquid chromatographic enantioseparation of aminonaphthol analogs on polysaccharide-based chiral stationary phases. J. Chromatogr., A 2010, 1217, 2980–2985. [DOI] [PubMed] [Google Scholar]
- Stowe G. N.; Silhár P.; Hixon M. S.; Silvaggi N. R.; Allen K. N.; Moe S. T.; Jacobson A. R.; Barbieri J. T.; Janda K. D. Chirality holds the key for potent inhibition of botulinum neurotoxin serotype A protease. Org. Lett. 2010, 12, 756–759. [DOI] [PMC free article] [PubMed] [Google Scholar]
Associated Data
This section collects any data citations, data availability statements, or supplementary materials included in this article.