

Abstract
Background
Patient-shared electronic health records provide opportunities for care outside of office visits. However, those who might benefit may be unable to or choose not to use these resources, while others might not need them.
Objective
Electronic Communications and Home Blood Pressure Monitoring (e-BP) was a randomized trial that demonstrated that Web-based pharmacist care led to improved blood pressure (BP) control. During recruitment we attempted to contact all patients with hypertension from 10 clinics to determine whether they were eligible and willing to participate. We wanted to know whether particular subgroups, particularly those from vulnerable populations, were less willing to participate or unable to because they lacked computer access.
Methods
From 2005 to 2006, we sent invitation letters to and attempted to recruit 9298 patients with hypertension. Eligibility to participate in the trial included access to a computer and the Internet, an email address, and uncontrolled BP (BP ≥ 140/90 mmHg). Generalized linear models within a modified Poisson regression framework were used to estimate the relative risk (RR) of ineligibility due to lack of computer access and of having uncontrolled BP.
Results
We were able to contact 95.1% (8840/9298) of patients. Those refusing participation (3032/8840, 34.3%) were significantly more likely (P < .05) to be female, be nonwhite, have lower levels of education, and have Medicaid insurance. Among patients who answered survey questions, 22.8% (1673/7354) did not have computer access. Older age, minority race, and lower levels of education were risk factors for lack of computer access, with education as the strongest predictor (RR 2.63, 95% CI 2.30-3.01 for those with a high school degree compared to a college education). Among hypertensive patients with computer access who were willing to participate, African American race (RR 1.22, 95% CI 1.06-1.40), male sex (RR 1.28, 95% CI 1.18-1.38), and obesity (RR 1.53, 95% CI 1.31-1.79) were risk factors for uncontrolled BP.
Conclusion
Older age, lower socioeconomic status, and lower levels of education were associated with decreased access to and willingness to participate in a Web-based intervention to improve hypertension control. Failure to ameliorate this may worsen health care disparities.
Trial Registration
Clinicaltrials.gov NCT00158639; http://www.clinicaltrials.gov/ct2/show/NCT00158639 (Archived by WebCite at http://www.webcitation.org/5v1jnHaeo)
Keywords: electronic medical record
Introduction
There is increasing evidence that patient access to practice-based electronic health records (defined here as patient-shared electronic health records) [1], combined with secure Web-based communications between patients and health care providers, improves the treatment of chronic diseases [2,3], and may result in improved health outcomes and decreased costs [4,5]. Their use is consistent with the Institute of Medicine’s Crossing the Quality Chasm report, which states that care should not just occur with face-to-face visits, but that continuous “access to care should be provided over the Internet” [6] and that meaningful use of health information technology should be implemented [7]. However, some patients may choose not to engage in Web-based health care and others may be unable. Older patients, ethnic and racial minorities, and those with lower education levels or who are unemployed have less access to the Web, typically described as the “digital divide” [8-11]. Other patients with Web access might be healthier than those without access, potentially increasing health outcome disparities.
The Electronic Communications and Home Blood Pressure Monitoring (e-BP) study was a randomized controlled trial designed to test whether use of home blood pressure (BP) monitoring, use of an existing patient Web portal with a patient-shared electronic health record and secure email, and Web-based pharmacist-assisted care led to hypertension control. During recruitment we attempted to contact all patients with hypertension from 10 clinics to determine whether they were eligible and willing to participate. Patients randomized to home BP monitoring and Web-based collaborative care with a pharmacist were almost twice as likely as those in usual care to have controlled BP at the 12-month follow-up visit (adjusted relative risk [RR] 1.84, 95% CI 1.48-2.29) [2]. We describe here characteristics of patients with hypertension who were not eligible to participate because of lack of computer access. Of those with computer access, we also compared characteristics of patients with controlled and uncontrolled hypertension. Identifying characteristics of these populations will provide a context for engaging participation in and designing future Web-based interventions that lead to improved health outcomes for all populations.
Methods
We attempted to contact all patients with a diagnosis of hypertension and taking medications for this from 10 primary care clinics to invite them to participate in the e-BP trial. During recruitment patients could refuse to participate (either actively or passively, by not responding) or be ineligible to participate because of lack of computer access, having controlled BP, or having other ineligibility medical conditions. We attempted to survey all patients contacted regardless of their willingness and eligibility to participate in the e-BP trial. Eligible patients who provided consent were randomly assigned to (1) usual care, (2) receive a home BP monitor and training to use it, and training to use an existing patient Web portal with secure messaging and other Web services, or (3) group 2 interventions plus collaborative pharmacist care management delivered via Web communications. The study design was based on the chronic care model [12]. A complete description of the methods and recruitment processes of the e-BP study were reported elsewhere, but an overview follows [13].
Study Setting
We recruited participants between June 2005 and December 2006 at 10 primary care medical centers within Group Health, a nonprofit, integrated group practice that provides both medical coverage and care to more than 600,000 residents of Washington State and Idaho. Group Health Research Institute’s Institutional Review Board reviewed and approved this study.
Group Health has a comprehensive electronic health record system, EpicCare (Epic Systems Corporation, Verona, Wisconsin, USA), which integrates clinical communication and information processes into a single interface that includes physician order entry (eg, laboratory tests, prescriptions, and referrals), documentation of all patient encounters, clinical decision support, clinical messaging between physicians, secure online messaging with patients, and automated reminders at the point of care. Group Health provides patients with access to the electronic health record via a patient Web site (myGroupHealth), which they can use to refill medications, make appointments, view portions of their medical record (current health conditions, laboratory test results, after-visit summaries, allergies, and medications), and send secure messages to their health care team. Detailed description of the patient Website and its integration into overall access to care at Group Health is described elsewhere [14,15].
Recruitment
We used clinical and administrative data routinely collected and maintained by Group Health to identify all patients age 25-75 years with a diagnosis of hypertension and taking antihypertensive medications, with no diagnoses of diabetes, cardiovascular or renal disease, or other serious conditions (such as dementia or active treatment of cancer). Research assistants telephoned potential participants to confirm eligibility, including computer access (defined as access to a computer, the Internet, and an email address), and willingness to attend screening visits. All patients surveyed by telephone, including those ineligible or refusing to participate in the study, were asked to answer several demographic questions (race and ethnicity, education level, occupation), computer access questions, and whether they owned a home BP monitor.
Patients with a hypertension diagnosis, computer access, and no other exclusions were invited to an in-person screening visit at their primary care medical center to obtain BP measurements. Patients who had not previously signed up to use the myGroupHealth patient Website secure services were assisted in doing so and given Group Health pamphlets on the various functionalities of the Web portal. Patients were eligible to participate in the trial if their BP was elevated at both of two in-person screening visits. BP was measured three times at each visit using a validated Omron Hem-705CP automated monitor (OMRON Corporation, Schaumburg, IL, USA) with a cuff fitted for the patient’s upper arm circumference [16]. The first measurement was dropped and the last two were averaged. If the mean diastolic BP was 90-109 mmHg or systolic BP was 140-199 mmHg at both visits, the patient was invited to participate, and written informed consent was obtained. Patients were randomly assigned to one of three study conditions. Group 1 (usual care) received Group Health’s pamphlet on elevated BP and were advised to work with their doctor to improve their BP control. Group 2 (Web only) received a home BP monitor and training to use it proficiently on their own and a tour of the functionalities of the myGroupHealth Website. Group 3 (Web plus pharmacist) was the same as group 2 plus Web-based pharmacist collaborative care. Intervention components are described in more detail elsewhere [2,13].
Measures
We used automated databases to obtain sex, age, insurance plan type (commercial, Medicare, Medicaid, or state-subsidized basic health), prior use of secure messaging, and body mass index (BMI) using the most recently recorded weight and height. The Johns Hopkins Adjusted Clinical Group’s case-mix system was used to measure each individual’s overall level of morbidity burden. Their software assigns each individual a level of overall morbidity depending on age, sex, and number and types International Classification of Diseases, ninth revision, codes over a 12-month period [17,18]. Patients were classified as having high, medium, or low expected clinical need. Demographic variables not available in the Group Health databases, including education level, employment status, marital status, and race, were collected during the telephone survey. When participants chose more than one category for race, coding precedence was given to Hispanic, non-Hispanic black, Asian, other, and non-Hispanic white categories, in that order. Survey participants were also asked if they used a home BP monitor.
Statistical Analysis
We present frequencies of patient characteristics by four recruitment outcomes (unable to contact, refused, ineligible, and randomized) and applied Pearson chi-square tests to assess any differences between groups. To evaluate factors related to computer access we used generalized linear models with a log link and robust sandwich variance estimator using a modified Poisson regression framework to estimate RR of not having computer access [19]. Logistic regression models were not used because computer access was not rare. We present two sets of adjusted RRs: (1) adjusted for age and sex only, and (2) adjusted for all variables shown in Table 2 including age, sex, socioeconomic measures, BMI, expected clinical need, and having a home BP monitor.
Table 2.
Adjusted relative risk (RR) of not having computer access by demographic characteristics among patients for whom computer access was ascertained during the telephone screening survey (n = 7354)
| Access | No Access | Adjusted for age and sex | Adjusted for all variablesa | ||||||
| n | Row % | n | Row % | RR | 95% CI | RR | 95% CI | ||
| Total | 5681 | 77.3 | 1673 | 22.8 | |||||
| Sex | |||||||||
| Female | 3207 | 75.5 | 1042 | 24.5 | 1.00 | Referent | 1.00 | Referent | |
| Male | 2474 | 79.7 | 631 | 20.3 | 0.85 | 0.78-0.92 | 1.01 | 0.91-1.11 | |
| Age (years) | |||||||||
| 25-39 | 168 | 87.1 | 25 | 13.0 | 0.87 | 0.59-1.26 | 0.89 | 0.58-1.36 | |
| 40-54 | 1675 | 84.8 | 300 | 15.2 | 1.00 | Referent | 1.00 | Referent | |
| 55-64 | 2437 | 81.4 | 557 | 18.6 | 1.23 | 1.08-1.40 | 1.33 | 1.15-1.54 | |
| 65-75 | 1401 | 63.9 | 791 | 36.1 | 2.37 | 2.11-2.67 | 2.27 | 1.92-2.67 | |
| BMIb (kg/m2) | |||||||||
| Normal/low (<25) | 750 | 73.8 | 266 | 26.2 | 1.00 | Referent | 1.00 | Referent | |
| Overweight (25-30) | 1646 | 77.5 | 478 | 22.5 | 0.93 | 0.81-1.05 | 0.92 | 0.81-1.04 | |
| Obese (≥30) | 2543 | 78.7 | 687 | 21.3 | 0.96 | 0.85-1.08 | 0.91 | 0.80-1.03 | |
| Insurance product | |||||||||
| Commercial | 4292 | 83.1 | 872 | 16.9 | 1.00 | Referent | 1.00 | Referent | |
| Basic health/Medicaid | 58 | 52.7 | 52 | 47.3 | 2.74 | 2.24-3.35 | 1.98 | 1.52-2.59 | |
| Expected clinical need | |||||||||
| Low | 1006 | 77.1 | 299 | 22.9 | 1.00 | Referent | 1.00 | Referent | |
| Medium | 3456 | 78.9 | 924 | 21.1 | 0.83 | 0.74-0.93 | 0.83 | 0.73-0.95 | |
| High | 1073 | 73.2 | 394 | 26.8 | 0.96 | 0.85-1.09 | 0.94 | 0.82-1.09 | |
| Race | |||||||||
| White, non-Hispanic | 4483 | 80.5 | 1085 | 19.5 | 1.00 | Referent | 1.00 | Referent | |
| Black, non-Hispanic | 398 | 74.4 | 137 | 25.6 | 1.56 | 1.34-1.81 | 1.38 | 1.17-1.62 | |
| Hispanic | 138 | 70.1 | 59 | 30.0 | 1.81 | 1.47-2.23 | 1.58 | 1.26-1.99 | |
| Asian | 320 | 66.5 | 161 | 33.5 | 1.86 | 1.63-2.12 | 1.96 | 1.70-2.27 | |
| Other | 315 | 70.2 | 134 | 29.8 | 1.60 | 1.38-1.85 | 1.42 | 1.22-1.66 | |
| Education | |||||||||
| <HSc graduate | 57 | 35.9 | 102 | 64.2 | 3.62 | 3.05-4.29 | 3.22 | 2.67-3.87 | |
| HS graduate/GEDd | 560 | 56.7 | 427 | 43.3 | 2.63 | 2.30-3.01 | 2.53 | 2.18-2.93 | |
| Some post-HS | 2222 | 76.5 | 681 | 23.5 | 1.55 | 1.36-1.77 | 1.56 | 1.36-1.80 | |
| College graduate | 1421 | 85.2 | 247 | 14.8 | 1.00 | Referent | 1.00 | Referent | |
| Postgraduate | 1401 | 92.9 | 117 | 7.7 | 0.51 | 0.41-0.62 | 0.53 | 0.42-0.66 | |
| Employment | |||||||||
| Full-time | 3184 | 84.8 | 571 | 15.2 | 1.00 | Referent | 1.00 | Referent | |
| Retired | 1806 | 70.0 | 776 | 30.1 | 1.26 | 1.11-1.42 | 1.18 | 1.04-1.34 | |
| Part-time | 423 | 80.0 | 106 | 20.0 | 1.14 | 0.95-1.37 | 1.12 | 0.92-1.37 | |
| Disabled | 56 | 59.0 | 39 | 41.1 | 2.60 | 2.03-3.33 | 1.84 | 1.41-2.40 | |
| Unemployed | 65 | 69.9 | 28 | 30.1 | 1.95 | 1.44-2.66 | 1.41 | 1.00-1.99 | |
| Other | 129 | 69.0 | 58 | 31.0 | 1.72 | 1.38-2.16 | 1.22 | 0.95-1.56 | |
| Home blood pressure monitor | |||||||||
| Yes | 3527 | 79.7 | 897 | 20.3 | 1.00 | Referent | 1.00 | Referent | |
| No | 2150 | 75.4 | 700 | 24.6 | 1.32 | 1.21-1.44 | 1.26 | 1.15-1.38 | |
a All variables shown in this table are included in the model.
b BMI: body mass index.
c HS: high school.
d GED: general equivalency diploma.
Modified Poisson regression models were also used to estimate the RR of uncontrolled BP among participants attending the screening visits. We present two sets of adjusted RRs for uncontrolled BP: (1) adjusted for age and sex only, and (2) adjusted for age, sex, education, race, and BMI. In our full model, we adjusted only for covariates that were associated with the uncontrolled BP in the first model. The primary analysis defined BP control based on the BP measurement from the first screening visit. A sensitivity analysis was also performed using a more conservative definition of uncontrolled BP based on study recruitment guidelines requiring uncontrolled BP at both screening visits.
Medicare insurance was omitted from multivariable models including both insurance type and age because of the significant overlap with the age category 65-75 years. In models estimating the RR of uncontrolled BP, the employment categories disabled, unemployed, and other were combined due to small sample sizes.
All analyses were performed using Stata version 11.0 statistical software (StataCorp LP, College Station, TX, USA). All reported P-values and 95% CIs are two sided with significance defined at the 0.05 alpha level and are based on the Wald statistic unless otherwise specified.
Results
Our recruitment sample (N = 9298) included all patients age 25-74 years from 10 primary care medical centers with administrative data indicating they had a diagnosis of hypertension, were taking antihypertensive medications, and had no exclusionary conditions (Figure 1). Automated data were available on all 9298 hypertension patients who were sent invitation letters. Of the 8840 (95.1%) patients we were able to contact, 83.2% (7354/8840) responded to the survey questions assessing computer access eligibility, including 71.0% (2153/3032) of those who refused participation in the trial.
Figure 1.
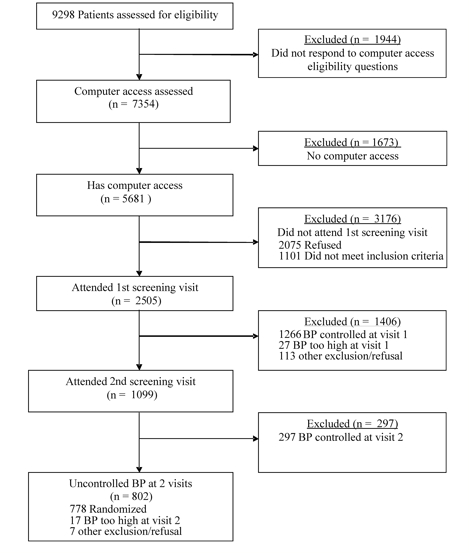
Recruitment Flow
Refusal and Ineligibility to Participate
Of those we attempted to contact, 32.6% (3032/9298) refused participation, 2598 at the time of the telephone survey and 434 after agreeing to attend a screening visit (either by not attending or by refusing at the time of the screening visit) (Table 1). Compared to trial participants, patients refusing participation were significantly more likely to be female (P = .002), to be younger (P = .002), to be from a racial or ethnic minority group (P < .001), and to have lower levels of education (P = .002). The most common reasons for refusal were either being too busy or not being interested in participating. Only 15% (447/3032) listed unwillingness to use the patient Web portal as a reason for refusal.
Table 1.
Demographic characteristics by recruitment outcome (N = 9298)
| Unable to contact | Refused | Ineligible | Randomized | ||||||
| n = 458 | n = 3032 | n = 5030 | n = 778 | ||||||
| n | % | n | % | n | % | n | % | ||
| Sex (% female) | 246 | 53.7 | 1638 | 54.0a | 3040 | 60.4a | 372 | 47.8 | |
| Age (years) | |||||||||
| 25-39 | 22 | 4.8a | 109 | 3.6a | 137 | 2.7a | 13 | 1.7 | |
| 40-54 | 191 | 41.7 | 906 | 29.9 | 1322 | 26.3 | 214 | 27.5 | |
| 55-64 | 169 | 36.9 | 1319 | 43.5 | 1951 | 38.8 | 334 | 42.9 | |
| 65-75 | 76 | 16.6 | 698 | 23.0 | 1620 | 32.2 | 217 | 27.9 | |
| BMIb (kg/m2) | |||||||||
| Normal/low (<25) | 58 | 17.0a | 430 | 16.7a | 728 | 17.6a | 67 | 9.5 | |
| Overweight (25-30) | 122 | 35.8 | 885 | 34.3 | 1375 | 33.3 | 227 | 32.1 | |
| Obese (≥30) | 161 | 47.2 | 1268 | 49.1 | 2026 | 49.1 | 414 | 58.5 | |
| Missingc | 117 | (25.6) | 449 | (14.8) | 901 | (17.9) | 70 | (9.0) | |
| Insurance product | |||||||||
| Commercial | 379 | 82.8a | 2328 | 76.8a | 3362 | 66.8a | 574 | 73.8 | |
| Medicare | 66 | 14.4 | 661 | 21.8 | 1529 | 30.4 | 200 | 25.7 | |
| Basic health/Medicaid | 13 | 2.8 | 43 | 1.4 | 139 | 2.8 | 4 | 0.5 | |
| Expected clinical need | |||||||||
| Low | 156 | 35.1a | 632 | 21.1 | 809 | 17.4a | 145 | 18.7 | |
| Medium | 232 | 52.3 | 1819 | 60.7 | 2803 | 60.4 | 507 | 65.3 | |
| High | 56 | 12.6 | 544 | 18.2 | 1032 | 22.2 | 124 | 16.0 | |
| Missingc | 14 | (3.1) | 37 | (1.2) | 386 | (7.7) | 2 | (0.3) | |
| Prior use of secure messaging | |||||||||
| (% yes) | 101 | 22.1a | 1063 | 35.1a | 1430 | 28.4a | 338 | 43.4 | |
| Race | NAd | ||||||||
| White, non-Hispanic | 1592 | 74.6a | 3335 | 77.3a | 637 | 82.0 | |||
| Black, non-Hispanic | 178 | 8.3 | 297 | 6.9 | 60 | 7.7 | |||
| Hispanic | 59 | 2.8 | 122 | 2.8 | 16 | 2.1 | |||
| Asian | 159 | 7.5 | 294 | 6.8 | 28 | 3.6 | |||
| Other | 147 | 6.9 | 264 | 6.1 | 36 | 4.6 | |||
| Missingc | 897 | (29.6) | 718 | (14.3) | 1 | (0.1) | |||
| Education | NAd | ||||||||
| <HSe graduate | 24 | 1.1a | 129 | 3.0a | 5 | 0.6 | |||
| HS graduate/GEDf | 257 | 12.1 | 672 | 15.6 | 57 | 7.3 | |||
| Some post-HS | 855 | 40.1 | 1723 | 39.9 | 324 | 41.7 | |||
| College graduate | 511 | 24.0 | 961 | 22.3 | 195 | 25.1 | |||
| Postgraduate | 485 | 22.8 | 834 | 19.3 | 197 | 25.3 | |||
| Missingc | 900 | (29.7) | 711 | (14.1) | 0 | (0.0) | |||
| Employment | NAd | ||||||||
| Full-time | 1268 | 59.4 | 2050 | 47.4 a | 435 | 56.0 | |||
| Retired | 624 | 29.2 | 1686 | 39.0 | 270 | 34.8 | |||
| Part-time | 153 | 7.2 | 324 | 7.5 | 51 | 6.6 | |||
| Disabled | 23 | 1.1 | 68 | 1.6 | 4 | 0.5 | |||
| Unemployed | 22 | 1.0 | 63 | 1.5 | 7 | 0.9 | |||
| Other | 44 | 2.1 | 133 | 3.1 | 10 | 1.3 | |||
| Missingc | 898 | (29.6) | 706 | (14.0) | 1 | (0.1) | |||
| Home blood pressure monitor | N/Ad | ||||||||
| Yes | 1452 | 67.6a | 2533 | 58.4 | 437 | 56.2 | |||
| No | 697 | 32.4 | 1808 | 41.7 | 341 | 43.8 | |||
| Missingc | 883 | (29.1) | 689 | (13.7) | 0 | (0.0) | |||
a P < .05, compared to randomized group.
b BMI: body mass index.
c Percentages with missing data (in parentheses) are not included in column percentages.
d NA: not available – survey data not collected from patients we were unable to contact.
e HS: high school.
f GED: general equivalency diploma.
Over half of the sampled patients (5030/9298, 54%) were ineligible for the study. The most common reasons for ineligibility were lack of computer access (n = 1673), and controlled BP at either the first or second screening visit (n = 1563). If patients lacked computer access they were not invited to have screening BP visits. Thus, patients might have had more than one reason for exclusion that was not ascertained. The demographic characteristics of ineligible patients differed by reason for ineligibility; therefore, we separately examined characteristics associated with the two most common reasons for eligibility, lack of computer access and controlled BP.
Computer Access
The majority (7354/8840, 83.2%) of patients we contacted were willing to answer questions on computer access, even those who refused to participate in the study (2153/3032, 71%). Of those answering the computer questions, 22.8% (1673/7354) lacked computer access (no access to a computer, the Web, or email) (Table 2). The RR for lack of computer access was 2.63 (CI 2.30-3.01) for those with a high school diploma and 3.62 (CI 3.05-4.29) for those with less than a high school diploma compared to college graduates. There was a similar relationship between age and lack of computer access. Those ages 65-75 years were two times more likely to not have computer access compared to those ages 40-54 (RR 2.37, CI 2.11-2.67). Being any race or ethnicity other than white was also associated with increased risk for not having computer access, as was being disabled or unemployed, and having Medicaid or state-supported insurance. Age, race-ethnicity, employment, and insurance associations were not attenuated by controlling for education or other covariates. Patients without home BP monitors (at baseline) were also more likely to not have computer access (RR 1.32, CI 1.21-1.44). Anticipated clinical need was not associated with computer access.
Having computer access did not guarantee participation. Almost 40% (2152/5681, 37.9%) of patients with computer access refused participation. Similar to those who refused overall, computer-able refusers were significantly more likely to be female (P < .001), younger (P = .008), nonwhite (P < .001), and less educated (P = .002) than those randomized to participate in the study. They also were less likely to have used secure messaging (P = .01) and own a home BP monitor (P < .001). Even though the majority of people with computer access agreed to go on with the recruitment process, 78.0% (2751/3529) were not eligible, mainly because of controlled BP, discussed in more detail below.
Blood Pressure Control
After the telephone survey, 2937 hypertensive patients with computer access agreed to attend a screening visit to have their BP measured to verify eligibility (uncontrolled BP). Of these, 2505 patients attended the first screening visit (Table 3), where 49.5% (1239/2505) had uncontrolled BP and were invited to a second screening visit. Using our stricter definition of uncontrolled BP at two screening visits, only 33.9% (802/2365) of the patients who completed screening had uncontrolled BP (Table 4). We were unable to determine BP control status for 134 patients who had uncontrolled BP at the first screening visit but did not attend the second visit. This group was excluded from the sensitivity analysis, which used the more strict definition requiring two measures to verify uncontrolled BP.
Table 3.
Adjusted relative risk (RR) of uncontrolled blood pressure (BP) among patients completing the first screening visit (n = 2505)
| Controlled BPa | Uncontrolled BPa | Adjusted for age and sex | Adjusted for age, sex, education, race, and BMIb |
||||||
| n | Row % | N | Row % | RR | 95% CI | RR | 95% CI | ||
| Total | 1266 | 50.4 | 1239 | 49.5 | |||||
| Systolic BPa (mmHg), mean (SD) | 126.3 (8.4) | 151.1 (12.4) | |||||||
| Diastolic BPa (mmHg), mean (SD) | 77.7 (7.2) | 89.3 (9.2) | |||||||
| Sex | |||||||||
| Female | 795 | 55.8 | 630 | 44.2 | 1.00 | Referent | 1.00 | Referent | |
| Male | 471 | 43.6 | 609 | 56.4 | 1.28 | 1.18-1.38 | 1.29 | 1.19-1.40 | |
| Age (years) | |||||||||
| 25-39 | 24 | 51.1 | 23 | 48.9 | 1.00 | 0.73-1.36 | 0.90 | 0.65-1.26 | |
| 40-54 | 374 | 52.3 | 341 | 47.7 | 1.00 | Referent | 1.00 | Referent | |
| 55-64 | 544 | 50.3 | 537 | 49.7 | 1.04 | 0.94-1.14 | 1.04 | 0.94-1.15 | |
| 65-75 | 324 | 48.9 | 338 | 51.1 | 1.08 | 0.97-1.20 | 1.14 | 1.02-1.27 | |
| BMI (kg/m2) | |||||||||
| Normal (<25) | 215 | 65.0 | 116 | 35.1 | 1.00 | Referent | 1.00 | Referent | |
| Overweight (25-30) | 391 | 50.9 | 377 | 49.1 | 1.36 | 1.16-1.61 | 1.34 | 1.14-1.58 | |
| Obese (≥30) | 537 | 46.1 | 628 | 53.9 | 1.53 | 1.31-1.79 | 1.47 | 1.25-1.72 | |
| Insurance product | |||||||||
| Commercial | 950 | 50.8 | 919 | 49.2 | 1.00 | Referent | 1.00 | Referent | |
| Basic health/Medicaid | 7 | 43.8 | 9 | 56.3 | 1.10 | 0.71-1.69 | 1.02 | 0.60-1.75 | |
| Expected clinical need | |||||||||
| Low | 229 | 49.5 | 234 | 50.5 | 1.00 | Referent | 1.00 | Referent | |
| Medium | 814 | 50.5 | 797 | 49.5 | 0.99 | 0.90-1.10 | 0.99 | 0.89-1.11 | |
| High | 218 | 51.5 | 205 | 48.5 | 0.98 | 0.86-1.12 | 0.96 | 0.84-1.11 | |
| Prior use of secure messaging | |||||||||
| No | 664 | 48.4 | 708 | 51.6 | 1.00 | Referent | 1.00 | Referent | |
| Yes | 602 | 53.1 | 531 | 46.9 | 0.92 | 0.85, 0.99 | 0.99 | 0.91, 1.07 | |
| Race | |||||||||
| White, non-Hispanic | 1067 | 51.4 | 1011 | 48.7 | 1.00 | Referent | 1.00 | Referent | |
| Black, non-Hispanic | 65 | 42.2 | 89 | 57.8 | 1.22 | 1.06-1.40 | 1.26 | 1.10-1.45 | |
| Hispanic | 25 | 47.2 | 28 | 52.8 | 1.09 | 0.84-1.41 | 1.12 | 0.86-1.47 | |
| Asian | 63 | 59.4 | 43 | 40.6 | 0.85 | 0.67-1.08 | 0.95 | 0.74-1.22 | |
| Other | 43 | 39.8 | 65 | 60.2 | 1.22 | 1.04-1.43 | 1.18 | 1.00-1.29 | |
| Education | |||||||||
| <HSc graduate | 10 | 52.6 | 9 | 47.4 | 0.98 | 0.59-1.64 | 0.94 | 0.53-1.64 | |
| HS graduate/GEDd | 97 | 47.8 | 106 | 52.2 | 1.13 | 0.97-1.32 | 1.10 | 0.94-1.29 | |
| Some post-HS | 436 | 46.8 | 496 | 53.2 | 1.15 | 1.04-1.27 | 1.10 | 0.99-1.22 | |
| College graduate | 339 | 52.4 | 308 | 47.6 | 1.00 | Referent | 1.00 | Referent | |
| Postgraduate | 384 | 54.6 | 320 | 45.5 | 0.94 | 0.84-1.06 | 0.95 | 0.84-1.07 | |
| Employment | |||||||||
| Full-time | 690 | 49.9 | 692 | 50.1 | 1.00 | Referent | 1.00 | Referent | |
| Retired | 429 | 49.9 | 430 | 50.1 | 0.98 | 0.88-1.09 | 0.98 | 0.88-1.10 | |
| Part-time | 101 | 56.4 | 78 | 43.5 | 0.91 | 0.77-1.09 | 0.94 | 0.78-1.14 | |
| Other | 46 | 54.8 | 38 | 45.2 | 0.97 | 0.76-1.23 | 0.89 | 0.68-1.17 | |
| Home BP monitor | |||||||||
| Yes | 747 | 51.6 | 702 | 48.5 | 1.00 | Referent | 1.00 | Referent | |
| No | 518 | 49.2 | 536 | 50.9 | 1.07 | 0.99-1.16 | 1.03 | 0.94-1.12 | |
a BP and BP control measured at the first screening visit.
b BMI: body mass index.
c HS: high school.
d GED: general equivalency diploma.
Table 4.
Adjusted relative risk (RR) of uncontrolled blood pressure (BP) based on study recruitment guidelines requiring two measures to define uncontrolled BP (n = 2365)
| Controlled BPa | Uncontrolled BPa | Adjusted for age and sex | Adjusted for age, sex, education, race, and BMIb | ||||||
| n | Row % | n | Row % | RR | 95% CI | RR | 95% CI | ||
| Total | 1563 | 66.1 | 802 | 33.9 | |||||
| Systolic BPc (mmHg), mean (SD) | 129.9 (11.2) | 152.8 (11.7) | |||||||
| Diastolic BPc (mmHg), mean (SD) | 79.4 (8.0) | 89.7 (8.7) | |||||||
| Sex | |||||||||
| Female | 966 | 71.5 | 386 | 28.6 | 1.00 | Referent | 1.00 | Referent | |
| Male | 597 | 58.9 | 416 | 41.1 | 1.44 | 1.29-1.62 | 1.50 | 1.33-1.69 | |
| Age (years) | |||||||||
| 25-39 | 27 | 67.5 | 13 | 32.5 | 0.93 | 0.59-1.48 | 0.78 | 0.48-1.29 | |
| 40-54 | 450 | 66.9 | 223 | 33.2 | 1.00 | Referent | 1.00 | Referent | |
| 55-64 | 678 | 66.3 | 345 | 33.7 | 1.01 | 0.88-1.16 | 1.04 | 0.90-1.20 | |
| 65-75 | 408 | 64.9 | 221 | 35.1 | 1.08 | 0.93-1.25 | 1.15 | 0.99-1.35 | |
| BMI (kg/m2) | |||||||||
| Underweight/normal (<25) | 244 | 77.5 | 71 | 22.5 | 1.00 | Referent | 1.00 | Referent | |
| Overweight (25-30) | 499 | 68.2 | 233 | 31.8 | 1.34 | 1.07-1.69 | 1.31 | 1.04-1.64 | |
| Obese (≥30) | 670 | 61.1 | 427 | 38.9 | 1.67 | 1.35-2.08 | 1.60 | 1.28-2.00 | |
| Insurance product | |||||||||
| Commercial | 1169 | 66.3 | 594 | 33.7 | 1.00 | Referent | 1.00 | Referent | |
| Basic health/Medicaid | 394 | 65.5 | 208 | 34.6 | 0.86 | 0.38-1.92 | 0.62 | 0.18-2.20 | |
| Expected clinical need | |||||||||
| Low | 290 | 66.2 | 148 | 33.8 | 1.00 | Referent | 1.00 | Referent | |
| Medium | 1003 | 65.8 | 522 | 34.2 | 1.04 | 0.89-1.20 | 0.96 | 0.82-1.12 | |
| High | 265 | 67.1 | 130 | 32.9 | 1.01 | 0.84-1.23 | 0.95 | 0.78-1.16 | |
| Prior use of secure messaging | |||||||||
| No | 831 | 64.5 | 458 | 35.5 | 1.00 | Referent | 1.00 | Referent | |
| Yes | 732 | 68.0 | 344 | 32.0 | 0.91 | 0.81-1.02 | 1.00 | 0.88-1.12 | |
| Race | |||||||||
| White, non-Hispanic | 1321 | 66.9 | 654 | 33.1 | 1.00 | Referent | 1.00 | Referent | |
| Black, non-Hispanic | 76 | 54.3 | 64 | 45.7 | 1.43 | 1.18-1.74 | 1.52 | 1.26-1.83 | |
| Hispanic | 33 | 66.0 | 17 | 34.0 | 1.03 | 0.69-1.52 | 1.01 | 0.66-1.55 | |
| Asian | 72 | 71.3 | 29 | 28.7 | 0.89 | 0.65-1.22 | 1.05 | 0.76-1.45 | |
| Other | 57 | 60.6 | 37 | 39.4 | 1.17 | 0.90-1.52 | 1.15 | 0.88-1.49 | |
| Education | |||||||||
| <HSd graduate | 13 | 72.2 | 5 | 27.8 | 0.83 | 0.38-1.84 | 0.87 | 0.40-1.88 | |
| HS graduate/GEDe | 125 | 67.2 | 61 | 32.8 | 1.08 | 0.85-1.36 | 1.06 | 0.83-1.35 | |
| Some post-HS | 544 | 61.8 | 336 | 38.2 | 1.23 | 1.07-1.42 | 1.17 | 1.01-1.35 | |
| College graduate | 416 | 67.8 | 198 | 32.3 | 1.00 | Referent | 1.00 | Referent | |
| Postgraduate | 465 | 69.7 | 202 | 30.3 | 0.92 | 0.79-1.09 | 0.95 | 0.80-1.12 | |
| Employment | |||||||||
| Full-time | 850 | 65.3 | 452 | 34.7 | 1.00 | Referent | 1.00 | Referent | |
| Retired | 539 | 66.3 | 274 | 33.7 | 0.95 | 0.81-1.11 | 0.99 | 0.84-1.16 | |
| Part-time | 117 | 68.4 | 54 | 31.6 | 0.98 | 0.78-1.24 | 1.06 | 0.83-1.35 | |
| Other | 57 | 73.1 | 21 | 26.9 | 0.86 | 0.59-1.24 | 0.80 | 0.53-1.21 | |
| Home BP Monitor | |||||||||
| Yes | 928 | 67.4 | 449 | 32.6 | 1.00 | Referent | 1.00 | Referent | |
| No | 633 | 64.2 | 353 | 35.8 | 1.12 | 1.00-1.26 | 1.06 | 0.94-1.19 | |
a BP control based on study recruitment guidelines requiring two measures (visits) to define controlled and uncontrolled BP.
b BMI: body mass index.
c BP measured at the first screening visit.
d HS: high school.
e GED: general equivalency diploma.
Male sex, non-Hispanic black race, and being overweight or obese were risk factors for uncontrolled BP regardless of whether uncontrolled BP was defined based on a single screening visit (Table 3) or on two screening visits (Table 4). These risks were somewhat more pronounced when we used the stricter study definition for uncontrolled BP. In the primary analysis, adjusted RR for uncontrolled BP for obese patients was 1.60 (CI 1.28-2.00) when compared to normal-weight individuals in the model that included age, sex, education, race, and BMI. Patients who reported not having a home BP monitor had a marginally higher risk of uncontrolled BP, with the RR attenuating in the fully adjusted models. Expected clinical need was not related to BP control.
Among patients attending at least one screening visit, 44 had severe hypertension with BP too high to be eligible to participate in the trial (defined as an average systolic BP ≥ 200 mmHg or diastolic BP ≥ 110 mmHg; data not shown). Compared to those enrolled with uncontrolled BP, ineligible patients with very high BPs were significantly more likely to be less than age 55 years (61.4% [27/44] vs 34.6% [269/778], P < .001) and non-Hispanic black (15.9% [7/44] vs 7.7% [60/778], P = .05). However, they did not differ in level of obesity (P = .56).
Discussion
Patient-shared electronic health records and secure Web communications allow new opportunities for patients to be uniquely involved in their own care, including viewing their medical records, communicating asynchronously by secure email, and receiving other Web-based services. The e-BP trial demonstrated that the use of these tools and Web-based collaborative pharmacist care led to significant decreases in both systolic and diastolic BP and improved BP control.
Our recruitment efforts included contacting almost all patients with a hypertension diagnosis from 10 primary care clinics. The majority of people we contacted were interested in continuing with the recruitment process; however, one third declined. Those refusing were more likely to be from racial minority and lower socioeconomic groups. Difficulty recruiting from underserved and minority groups has been documented [20,21]. Enrolling people in Web-related research poses additional challenges, as the same groups that have been less likely to participate in clinical trials are also less likely to have computer access.
In 2005 and 2006, over 20% of the patients we attempted to recruit could not participate in a Web-based intervention because of lack of computer access. Lack of computer access was strongly related to lower levels of education, older age, and minority race and ethnicity. Adjustments for potential confounders made little difference. These groups are those typically described as being part of the “digital divide.” Multiple observational studies have documented age, race, socioeconomic, and educational disparities in the use of patient electronic health records and eHealth services [22-24]. These same groups are more likely to experience disparities in health access and outcomes. Blacks, on average, die 6 years earlier than whites from heart disease [25]. Paradoxically, those who might benefit the most from eHealth innovations may be less able or unwilling to use these resources. Eysenbach has called this association between vulnerable populations and lack of computer and information access “the inverse information law”: Access to health information is often most difficult for those who need it most [10].
Interestingly in our analysis, expected clinical need was not related to refusal, lack of computer access, or BP control. Others have found no or increased associations between comorbidity and health status, and Internet and use of patient electronic health records. Ralston et al [26] and Weppner et al [27] found increased use of secure messaging in those with the highest levels of comorbidity. Gracia and Herrero [28] found that, once socioeconomic factors were controlled for, older adults (age 55-74 years) with poor self-reported health were more likely to use the Internet.
Over half of the patients we attempted to recruit had controlled BP and did not need a pharmacist’s intervention. Using the stricter criteria of uncontrolled BP at two separate visits, 66.1% (1563/2365) of the patients had controlled BP, compared to 52.1% (1304/2505) at a single visit. After the diagnosis of hypertension is established, medication decisions are often based on measurements at a single office visit, which according to our findings might lead to misclassifying many people as having uncontrolled BP. While there is a direct relationship between increasing systolic BP and cardiovascular disease events [29], there is no evidence for those with essential hypertension that lowering BP ≤ 140/90 mmHg leads to improved outcomes. Misclassifying people as having uncontrolled BP could result in harm and unnecessary costs [30]. At the time the study was conducted, the patient-shared electronic health record had just been implemented, and there were not enough BP data to prescreen participants. Over 98% of Group Health patients with a primary care visit have at least one BP measure in their electronic health record in any given year. Automated data now could be used to more efficiently identify patients with uncontrolled BP.
Concordant with the literature, non-Hispanic blacks were more likely than other racial and ethnic groups to have uncontrolled BP [31]. Obese patients were also more likely to have uncontrolled BP. Only 7.2% of the trial participants with uncontrolled BP had a normal BMI (using baseline clinical measurements). Obesity is a known risk factor for hypertension incidence and uncontrolled BP [32]. Obesity is also more common in those from minority racial and ethnic groups, and with lower income and lower levels of education [33]. Despite these relationships, in our analysis obesity was not related to either refusing to participate or lack of computer access. Patients were not assessed for metabolic syndrome and sleep apnea, likely contributory factors to uncontrolled BP. Our finding that men were more likely to have uncontrolled BP has also been cited in the literature [34]. The mechanisms for these differences are not well understood. Others have reported higher incidence of uncontrolled BP in women, but generally in older populations [35,36]. Level of education and expected clinical need were not related, and age was only weakly related, to BP control. The association between these covariates and BP control might have changed had we invited those without computer access to attend screening visits.
Our analysis has several important limitations. Almost 21% of the patients we attempted to contact did not answer the survey questions, and we have no information on race, education level, self-monitoring, computer access, or BP control for this group. Additionally, almost all patients at Group Health have health insurance, few have Medicaid, and our results may not be representative of populations without health insurance. Additionally, the Pacific Northwest is known for being “wired” and potential eHealth-associated disparities may be greater in other communities [37].
A particular strength of our analysis is that we were able to collect administrative and electronic medical record data on the entire recruitment sample. Of those successfully contacted (8840/9298, 95.1%), over 80% (7354/8840, 83.2%) consented to answering a brief nonparticipant questionnaire. Few trials, including hypertension and eHealth studies, have access to nonparticipant data. In the Antihypertensive and Lipid-lowering Treatment to Prevent Heart Attack Trial (ALLHAT) over one third of the 33,357 participants in the hypertension trial component were black; however, because recruitment occurred by a variety of methods (radio and newspaper ads, letters, flyers, referral), the researchers were unable to characterize eligible nonparticipants. Glasgow et al [38], in a Web-based weight-loss intervention, found that people age 60 years and older were less likely to enroll, but did not have data for race or education. Stopponi et al [39], in a Web-based nutrition trial, imputed education and income level by census tract. Similar to our results, their results showed that nonparticipants were more likely to be less educated and older. Our analysis adds to these studies, by systematically attempting to invite all patients with hypertension to participate and by capturing a richer set of data. Additional information on type of Internet connection, proficiency with, time spent on, and different usages of the Internet, and their perceptions of Web-based care would have provided further insight, but we were limited in the number of questions we were allowed to ask patients who refused further participation in the recruitment process.
Over 65% of adults who receive care at Group Health clinics are registered and have access to their patient-shared electronic health record and comprehensive Web services, and 30.7% of outpatient primary care encounters occur virtually, over the Web (with phone visits at 15.3% and in-person visits, 54.0%, accounting for the rest) [40]. Patients are very satisfied with these services, particularly secure email, medical test results, and medication refill services [14]. In contrast, only a small proportion of the US population has access to an electronic health record; however, in surveys, most would like access [41,42].
Patient Web portals will likely be increasingly available in other media forms, such as cell phones. In 2008, 84% of American adults owned a cell phone, compared to 74% having access to the Internet [43]. Web communications also have the potential to be translated into different languages, adapted to different literacy levels, and used by people with physical disabilities, which over time might help to mitigate disparity gaps. Patient Web portals also may lead to decreased health care utilization and costs. After the introduction of a patient Web portal in Kaiser Permanente, there was a 20% decrease in primary care and specialty care visits [5,44]. For these reasons and the success of the e-BP trial, we believe that increasing the availability of Web portals is warranted. However, our data show that it is necessary to ensure equity for those without access.
Systematic reviews and meta-analyses have found strong evidence that “team-based” care for hypertension (care provided by a health professional such as a pharmacist or nurse separate from office visits) improves BP control [45,46]. Successful studies have been conducted in a variety of settings (clinic, worksite, and community facilities) and have used different communication techniques (face-to-face visits, telephone, or facilitated transfer of data), and use of e-communication is only one of many different effective options. Which type of program offered could be based on the targeted population, local resources, satisfaction, and costs.
In conclusion, patients unwilling or unable to participate because of lack of computer access in a Web-based intervention to improve hypertension control were more likely to be from populations that already experience disparities in health care. The majority of those willing and able to receive Web-based care had controlled BP and did not need additional Web-based pharmacist medication management. As we strive to learn how best to use patient-shared electronic health records with Web communications to improve the care of chronic conditions, specific attention will be required to insure that health disparities are minimized.
Acknowledgments
We would like to thank Annie Shaffer on her assistance in manuscript preparation and editing. This research was funded by the National Heart, Lung, and Blood Institute of the National Institutes of Health; grant R01-HL075263.
Abbreviations
- ALLHAT
Antihypertensive and Lipid-lowering Treatment to Prevent Heart Attack Trial
- BMI
body mass index
- BP
blood pressure
- e-BP
Electronic Communications and Home Blood Pressure Monitoring
- RR
relative risk
Footnotes
James D Ralston received grant funding from Sanofi-Aventis between 7/1/2004 and 6/30/2006. No other conflicts of interest.
References
- 1.Tang PC, Lee TH. Your doctor's office or the Internet? Two paths to personal health records. N Engl J Med. 2009 Mar 26;360(13):1276–8. doi: 10.1056/NEJMp0810264. http://dx.doi.org/10.1056/NEJMp0810264.360/13/1276 [DOI] [PubMed] [Google Scholar]
- 2.Green BB, Cook AJ, Ralston JD, Fishman PA, Catz SL, Carlson J, Carrell D, Tyll L, Larson EB, Thompson RS. Effectiveness of home blood pressure monitoring, Web communication, and pharmacist care on hypertension control: a randomized controlled trial. JAMA. 2008 Jun 25;299(24):2857–67. doi: 10.1001/jama.299.24.2857. http://jama.ama-assn.org/cgi/pmidlookup?view=long&pmid=18577730.299/24/2857 [DOI] [PMC free article] [PubMed] [Google Scholar]
- 3.Ralston JD, Hirsch IB, Hoath J, Mullen M, Cheadle A, Goldberg HI. Web-based collaborative care for type 2 diabetes: a pilot randomized trial. Diabetes Care. 2009 Feb;32(2):234–9. doi: 10.2337/dc08-1220. http://care.diabetesjournals.org/cgi/pmidlookup?view=long&pmid=19017773.dc08-1220 [DOI] [PMC free article] [PubMed] [Google Scholar]
- 4.Chen C, Garrido T, Chock D, Okawa G, Liang L. The Kaiser Permanente Electronic Health Record: transforming and streamlining modalities of care. Health Aff (Millwood) 2009;28(2):323–33. doi: 10.1377/hlthaff.28.2.323.28/2/323 [DOI] [PubMed] [Google Scholar]
- 5.Zhou YY, Garrido T, Chin HL, Wiesenthal AM, Liang LL. Patient access to an electronic health record with secure messaging: impact on primary care utilization. Am J Manag Care. 2007 Jul;13(7):418–24. http://www.ajmc.com/pubMed.php?pii=3340.3340 [PubMed] [Google Scholar]
- 6.Committee on Quality Health Care in America. Institute of Medicine . Crossing the Quality Chasm: A New Health System for the 21st Century. Washington, DC: National Academy Press; 2001. [PubMed] [Google Scholar]
- 7.Centers for Medicare & Medicaid Services. 2010. [2010-09-17]. EHR Incentive Programs: Meaningful Use https://www.cms.gov/EHRIncentivePrograms/35_Meaningful_Use.asp. [PubMed]
- 8.McNeill LH, Puleo E, Bennett GG, Emmons KM. Exploring social contextual correlates of computer ownership and frequency of use among urban, low-income, public housing adult residents. J Med Internet Res. 2007;9(4):e35. doi: 10.2196/jmir.9.4.e35. http://www.jmir.org/2007/4/e35/v9i4e35 [DOI] [PMC free article] [PubMed] [Google Scholar]
- 9.Chang BL, Bakken S, Brown SS, Houston TK, Kreps GL, Kukafka R, Safran C, Stavri PZ. Bridging the digital divide: reaching vulnerable populations. J Am Med Inform Assoc. 2004;11(6):448–57. doi: 10.1197/jamia.M1535.M1535 [DOI] [PMC free article] [PubMed] [Google Scholar]
- 10.Eysenbach G. Poverty, human development, and the role of eHealth. J Med Internet Res. 2007;9(4):e34. doi: 10.2196/jmir.9.4.e34. http://www.jmir.org/2007/4/e34/v9i4e34 [DOI] [PMC free article] [PubMed] [Google Scholar]
- 11.Rainie L. Report: Internet, broadband, and cell phone statistics. Washington, DC: Pew Internet and American Life Project; 2010. Jan 5, [2010-12-16]. http://www.pewinternet.org/~/media//Files/Reports/2010/PIP_December09_update.pdf. [Google Scholar]
- 12.Wagner EH, Austin BT, Von Korff M. Organizing care for patients with chronic illness. Milbank Q. 1996;74(4):511–44. [PubMed] [Google Scholar]
- 13.Green BB, Ralston JD, Fishman PA, Catz SL, Cook A, Carlson J, Tyll L, Carrell D, Thompson RS. Electronic communications and home blood pressure monitoring (e-BP) study: design, delivery, and evaluation framework. Contemp Clin Trials. 2008 May;29(3):376–95. doi: 10.1016/j.cct.2007.09.005.S1551-7144(07)00132-2 [DOI] [PMC free article] [PubMed] [Google Scholar]
- 14.Ralston JD, Carrell D, Reid R, Anderson M, Moran M, Hereford J. Patient web services integrated with a shared medical record: patient use and satisfaction. J Am Med Inform Assoc. 2007;14(6):798–806. doi: 10.1197/jamia.M2302.M2302 [DOI] [PMC free article] [PubMed] [Google Scholar]
- 15.Ralston JD, Martin DP, Anderson ML, Fishman PA, Conrad DA, Larson EB, Grembowski D. Group health cooperative's transformation toward patient-centered access. Med Care Res Rev. 2009 Dec;66(6):703–24. doi: 10.1177/1077558709338486.1077558709338486 [DOI] [PubMed] [Google Scholar]
- 16.Coleman A, Freeman P, Steel S, Shennan A. Validation of the Omron 705IT (HEM-759-E) oscillometric blood pressure monitoring device according to the British Hypertension Society protocol. Blood Press Monit. 2006 Feb;11(1):27–32. doi: 10.1097/01.mbp.0000189788.05736.5f.00126097-200602000-00006 [DOI] [PubMed] [Google Scholar]
- 17.Starfield B, Weiner J, Mumford L, Steinwachs D. Ambulatory care groups: a categorization of diagnoses for research and management. Health Serv Res. 1991 Apr;26(1):53–74. [PMC free article] [PubMed] [Google Scholar]
- 18.Weiner JP, Starfield BH, Steinwachs DM, Mumford LM. Development and application of a population-oriented measure of ambulatory care case-mix. Med Care. 1991 May;29(5):452–72. doi: 10.1097/00005650-199105000-00006. [DOI] [PubMed] [Google Scholar]
- 19.Zou G. A modified poisson regression approach to prospective studies with binary data. Am J Epidemiol. 2004 Apr 1;159(7):702–6. doi: 10.1093/aje/kwh090. http://aje.oxfordjournals.org/cgi/pmidlookup?view=long&pmid=15033648. [DOI] [PubMed] [Google Scholar]
- 20.Shavers VL, Lynch CF, Burmeister LF. Racial differences in factors that influence the willingness to participate in medical research studies. Ann Epidemiol. 2002 May;12(4):248–56. doi: 10.1016/s1047-2797(01)00265-4.S1047279701002654 [DOI] [PubMed] [Google Scholar]
- 21.Ford JG, Howerton MW, Lai GY, Gary TL, Bolen S, Gibbons MC, Tilburt J, Baffi C, Tanpitukpongse TP, Wilson RF, Powe NR, Bass EB. Barriers to recruiting underrepresented populations to cancer clinical trials: a systematic review. Cancer. 2008 Jan 15;112(2):228–42. doi: 10.1002/cncr.23157. http://dx.doi.org/10.1002/cncr.23157. [DOI] [PubMed] [Google Scholar]
- 22.Roblin DW, Houston TK, Allison JJ, Joski PJ, Becker ER. Disparities in use of a personal health record in a managed care organization. J Am Med Inform Assoc. 2009;16(5):683–9. doi: 10.1197/jamia.M3169.M3169 [DOI] [PMC free article] [PubMed] [Google Scholar]
- 23.Hsu J, Huang J, Kinsman J, Fireman B, Miller R, Selby J, Ortiz E. Use of e-Health services between 1999 and 2002: a growing digital divide. J Am Med Inform Assoc. 2005;12(2):164–71. doi: 10.1197/jamia.M1672.M1672 [DOI] [PMC free article] [PubMed] [Google Scholar]
- 24.Bush N, Vanderpool R, Cofta-Woerpel L, Wallace P. Profiles of 800,000 users of the National Cancer Institute's Cancer Information Service since the debut of online assistance, 2003-2008. Prev Chronic Dis. 2010 Mar;7(2):A31. http://www.cdc.gov/pcd/issues/2010/Mar/09_0047.htm.A31 [PMC free article] [PubMed] [Google Scholar]
- 25.Wong MD, Shapiro MF, Boscardin WJ, Ettner SL. Contribution of major diseases to disparities in mortality. N Engl J Med. 2002 Nov 14;347(20):1585–92. doi: 10.1056/NEJMsa012979. http://dx.doi.org/10.1056/NEJMsa012979.347/20/1585 [DOI] [PubMed] [Google Scholar]
- 26.Ralston JD, Rutter CM, Carrell D, Hecht J, Rubanowice D, Simon GE. Patient use of secure electronic messaging within a shared medical record: a cross-sectional study. J Gen Intern Med. 2009 Mar;24(3):349–55. doi: 10.1007/s11606-008-0899-z. [DOI] [PMC free article] [PubMed] [Google Scholar]
- 27.Weppner WG, Ralston JD, Koepsell TD, Grothaus LC, Reid RJ, Jordan L, Larson EB. Use of a shared medical record with secure messaging by older patients with diabetes. Diabetes Care. 2010 Nov;33(11):2314–9. doi: 10.2337/dc10-1124.dc10-1124 [DOI] [PMC free article] [PubMed] [Google Scholar]
- 28.Gracia E, Herrero J. Internet use and self-rated health among older people: a national survey. J Med Internet Res. 2009;11(4):e49. doi: 10.2196/jmir.1311. http://www.jmir.org/2009/4/e49/v11i4e49 [DOI] [PMC free article] [PubMed] [Google Scholar]
- 29.McCloskey LW, Psaty BM, Koepsell TD, Aagaard GN. Level of blood pressure and risk of myocardial infarction among treated hypertensive patients. Arch Intern Med. 1992 Mar;152(3):513–20. [PubMed] [Google Scholar]
- 30.Arguedas JA, Perez MI, Wright JM. Treatment blood pressure targets for hypertension. Cochrane Database Syst Rev. 2009;(3):CD004349. doi: 10.1002/14651858.CD004349.pub2. [DOI] [PubMed] [Google Scholar]
- 31.Umscheid CA, Gross R, Weiner MG, Hollenbeak CS, Tang SS, Turner BJ. Racial disparities in hypertension control, but not treatment intensification. Am J Hypertens. 2010 Jan;23(1):54–61. doi: 10.1038/ajh.2009.201.ajh2009201 [DOI] [PubMed] [Google Scholar]
- 32.Cushman WC, Ford CE, Cutler JA, Margolis KL, Davis BR, Grimm RH, Black HR, Hamilton BP, Holland J, Nwachuku C, Papademetriou V, Probstfield J, Wright JT, Alderman MH, Weiss RJ, Piller L, Bettencourt J, Walsh SM, ALLHAT Collaborative Research Group Success and predictors of blood pressure control in diverse North American settings: the antihypertensive and lipid-lowering treatment to prevent heart attack trial (ALLHAT) J Clin Hypertens (Greenwich) 2002;4(6):393–404. doi: 10.1111/j.1524-6175.2002.02045.x. [DOI] [PubMed] [Google Scholar]
- 33.Wang Y, Beydoun MA. The obesity epidemic in the United States--gender, age, socioeconomic, racial/ethnic, and geographic characteristics: a systematic review and meta-regression analysis. Epidemiol Rev. 2007;29:6–28. doi: 10.1093/epirev/mxm007.mxm007 [DOI] [PubMed] [Google Scholar]
- 34.He J, Muntner P, Chen J, Roccella EJ, Streiffer RH, Whelton PK. Factors associated with hypertension control in the general population of the United States. Arch Intern Med. 2002 May 13;162(9):1051–8. doi: 10.1001/archinte.162.9.1051. http://archinte.ama-assn.org/cgi/pmidlookup?view=long&pmid=11996617.ioi10241 [DOI] [PubMed] [Google Scholar]
- 35.Lloyd-Jones DM, Evans JC, Levy D. Hypertension in adults across the age spectrum: current outcomes and control in the community. JAMA. 2005 Jul 27;294(4):466–72. doi: 10.1001/jama.294.4.466. http://jama.ama-assn.org/cgi/pmidlookup?view=long&pmid=16046653.294/4/466 [DOI] [PubMed] [Google Scholar]
- 36.Ostchega Y, Hughes JP, Wright JD, McDowell MA, Louis T. Are demographic characteristics, health care access and utilization, and comorbid conditions associated with hypertension among US adults? Am J Hypertens. 2008 Feb;21(2):159–65. doi: 10.1038/ajh.2007.32.ajh200732 [DOI] [PubMed] [Google Scholar]
- 37.Woyke E. Forbes.com. [2010-09-20]. America's most wired cities http://www.forbes.com/2009/01/22/wired-cities-2009-tech-wire-cx_ew_0122wiredcities.html.
- 38.Glasgow RE, Nelson CC, Kearney KA, Reid R, Ritzwoller DP, Strecher VJ, Couper MP, Green B, Wildenhaus K. Reach, engagement, and retention in an Internet-based weight loss program in a multi-site randomized controlled trial. J Med Internet Res. 2007;9(2):e11. doi: 10.2196/jmir.9.2.e11. http://www.jmir.org/2007/2/e11/v9i2e11 [DOI] [PMC free article] [PubMed] [Google Scholar]
- 39.Stopponi MA, Alexander GL, McClure JB, Carroll NM, Divine GW, Calvi JH, Rolnick SJ, Strecher VJ, Johnson CC, Ritzwoller DP. Recruitment to a randomized web-based nutritional intervention trial: characteristics of participants compared to non-participants. J Med Internet Res. 2009;11(3):e38. doi: 10.2196/jmir.1086. http://www.jmir.org/2009/3/e38/v11i3e38 [DOI] [PMC free article] [PubMed] [Google Scholar]
- 40.Ralston JD, Coleman K, Reid RJ, Handley MR, Larson EB. Patient experience should be part of meaningful-use criteria. Health Aff (Millwood) 2010 Apr;29(4):607–13. doi: 10.1377/hlthaff.2010.0113.29/4/607 [DOI] [PubMed] [Google Scholar]
- 41.Adler KG. Web portals in primary care: an evaluation of patient readiness and willingness to pay for online services. J Med Internet Res. 2006;8(4):e26. doi: 10.2196/jmir.8.4.e26. http://www.jmir.org/2006/4/e26/v8i4e26 [DOI] [PMC free article] [PubMed] [Google Scholar]
- 42.Beckjord EB, Finney Rutten LJ, Squiers L, Arora NK, Volckmann L, Moser RP, Hesse BW. Use of the internet to communicate with health care providers in the United States: estimates from the 2003 and 2005 Health Information National Trends Surveys (HINTS) J Med Internet Res. 2007;9(3):e20. doi: 10.2196/jmir.9.3.e20. http://www.jmir.org/2007/3/e20/v9i3e20 [DOI] [PMC free article] [PubMed] [Google Scholar]
- 43.Fox S. Pew Internet. Washington, DC: Pew Internet & American Life Project; 2009. Jun 9, [2010-09-20]. The future of personal health records http://www.pewinternet.org/Presentations/2009/20The-Future-of-Personal-Health-Records.aspx. [Google Scholar]
- 44.Garrido T, Jamieson L, Zhou Y, Wiesenthal A, Liang L. Effect of electronic health records in ambulatory care: retrospective, serial, cross sectional study. BMJ. 2005 Mar 12;330(7491):581. doi: 10.1136/bmj.330.7491.581. http://bmj.com/cgi/pmidlookup?view=long&pmid=15760999.330/7491/581 [DOI] [PMC free article] [PubMed] [Google Scholar]
- 45.Walsh JM, McDonald KM, Shojania KG, Sundaram V, Nayak S, Lewis R, Owens DK, Goldstein MK. Quality improvement strategies for hypertension management: a systematic review. Med Care. 2006 Jul;44(7):646–57. doi: 10.1097/01.mlr.0000220260.30768.32.00005650-200607000-00006 [DOI] [PubMed] [Google Scholar]
- 46.Carter BL, Rogers M, Daly J, Zheng S, James PA. The potency of team-based care interventions for hypertension: a meta-analysis. Arch Intern Med. 2009 Oct 26;169(19):1748–55. doi: 10.1001/archinternmed.2009.316. http://archinte.ama-assn.org/cgi/pmidlookup?view=long&pmid=19858431.169/19/1748 [DOI] [PMC free article] [PubMed] [Google Scholar]