Abstract
A high frequency sound beam was employed to explore an experimental method that could control particle motions in a microfluidic device. A 24 MHz single element lead zirconate titanate (PZT) transducer was built to transmit a focused ultrasound of variable duty factors (pulse duration/pulse repetition time), and its 1–3 piezo-composite structure established a tight focusing with f-number (focal depth/aperture size) of one. The transducer was excited by the Chebyshev windowed chirp signal sweeping from 18 MHz to 30 MHz with a 50% of duty factor, in order to ensure that enough sound beams were penetrated into the microfluidic device. The device was fabricated from a polydimethylsiloxane (PDMS) mold, and had a main channel composed of three subchannels among which particles flowed in the middle. A 60~70 μm diameter single droplet in the flow could be trapped near the channel bifurcation, and subsequently diverted into the sheath flow by releasing or shifting the acoustic trap. Hence, the results showed the potential use of a focused sound beam in microfluidic devices, and further suggested that this method could be exploited in the development of ultrasound-based flow cytometry and cell sorting devices.
Keywords: Particle manipulation, Acoustic trap, High frequency transducer, Microfluidic device
1 Introduction
Over the last decade, lab-on-a-chip type devices have found many biological applications in cellular immunoassay, deoxyribonucleic acid (DNA) analysis, and flow cytometry (Auroux et al. 2002; Reyes et al. 2002). Biological cell manipulation methods using electrostatic (Pohl 1951; Washizu 1990; Hughes 2002; Voldman 2006), magnetic (Saiyed et al. 2003; Lee et al. 2004; Yan et al. 2004), optical (Ashkin et al. 1986; Grier 2003; MacDonald et al. 2003), and acoustic forces (Wu and Du 1990; Hertz 1995; de Castro and Priego-Capote 2007; Laurell et al. 2007) have been developed to precisely control various cell motions within such devices.
In electrostatic technique, dielectrophorestic force generated in non-uniform electric fields can act on the charges induced in the particles for manipulation. The magnetic method can sort and separate magnetically labeled particles. These two approaches can achieve high throughput and be miniaturized easily but have limited flexibility in controlling single particles and pre-labeling of magnetic materials (Shi et al. 2009). Optical force traps electrically neutral dielectric spheres and enables remote manipulation of single cells and molecules. The biomechanical forces associated with certain biological events were measured in the pico-Newton range, e.g., more than 100 pN, and optical force can trap particles in sizes from 25 nm to tens of micrometer size (Ghislain et al. 1994; Svoboda and Block 1994; Grier 2003). Although the optical technique can provide high spatial resolution, its penetration depth and trapping force are limited and the apparatus used is quite complicated making it very difficult for the miniaturization (Shi et al. 2009). Acoustic force scheme mainly based on standing waves has shown some feasibility for manipulation of a group of cell than an individual cell (Woodside et al. 1997; Liu and Hu 2009).
Due to the conceptual similarity with the optical case, high frequency focused ultrasound has recently been considered as a means capable of acoustically trapping microparticles, and its feasibility was theoretically and experimentally investigated (Lee et al. 2005, 2010a). In this method, an acoustic force trap, similar to its optical counterpart, could be formed by a single source of high frequency focused ultrasound. It can provide higher trapping force which is in the range of tens of nano-Newton capable of manipulating particles like eukaryotic cells and achieve deeper penetration than the optical trapping (Coakley 1997; Lee et al. 2010b). Additionally, it can effectively control an individual cell rather than a group of particles as in the standing wave case.
In our previous research, a 30 MHz lithium niobate (LiNbO3) single element transducer was fabricated to experimentally demonstrate the feasibility of acoustic trapping, where a droplet could be held stationary in two-dimensional trap (Lee et al. 2010a). In order to control streaming particles in a fluid in a microfluidic device, it is necessary to generate trapping forces greater than the drag force arising from the surrounding fluid flow. Therefore, high frequency sound beams (>20 MHz) with strong intensity must be provided by a transducer to prevail over the drag force on the moving particles and to allow for deeper penetration of beam into the device. In this paper, a 24 MHz lead zirconate titanate (PZT) transducer was built to immobilize 60~70 μm droplets flowing in a polydimethylsiloxane (PDMS) microfluidic device. Potential particles to be targeted include eukaryotic cells with 10~100 μm diameter. The results were presented to show that the current device might serve as an acoustic switch to direct particle motions in a flow cytometer or similar cell sorting devices.
2 Methods
2.1 Principle of acoustic trapping
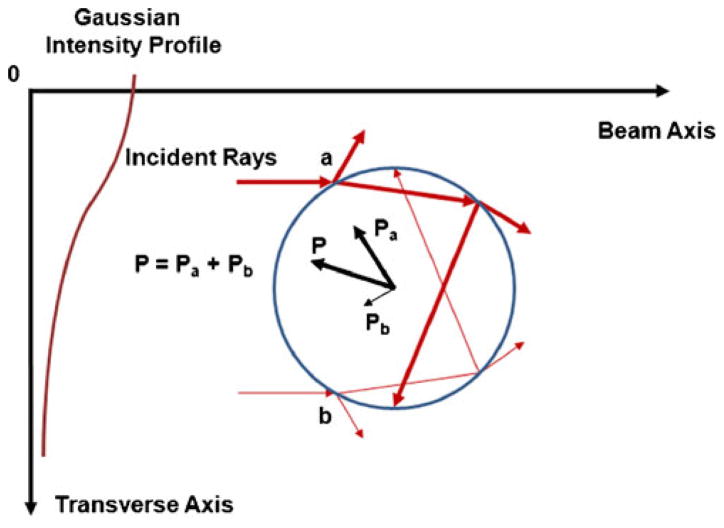
The underlying physics of acoustic trapping was illustrated in Fig. 1, where two incident rays strike upon a sphere in a sound field with a Gaussian intensity distribution. As the rays, denoted as a and b, interact with the sphere, successive scatterings result in the momentum transfer from the rays to the sphere. Each ray generates a pressure on the sphere, denoted as Pa and Pb. Note that Pa in the higher intensity area is stronger than Pb (Pa > Pb). This intensity difference induces acoustic radiation forces P, which may direct the sphere towards the beam axis.
Fig. 1.
Schematic diagram of acoustic trapping (Lee et al. 2010a). A sphere is interrogated by two incident rays (denoted as a and b) in Gaussian intensity profile. A series of scattering events around the sphere occurs both internally and externally. As the incident rays propagate through the sphere, due to the momentum transfer, the outgoing rays induce the pressures of Pa (a thick arrow) and Pb (a thin arrow), respectively. Because Pa may be higher than Pb, the net pressure P may direct the sphere toward the beam axis
2.2 Transducer design/fabrication/test
In order to form a stronger trap, a higher acoustic power is required to overcome the drag force of moving targets in a laminar flow, and allowing deeper penetration in the device. This could readily be achieved by exciting a transducer with increased input voltages or duty factors, which has often been limited to single crystal materials, since the application of excessive energy might result in severely depolarized piezo-elements and in turn degrade the transducer’s performance. This phenomenon occurs more frequently in high frequency transducers with very thin piezoelectric layers. In this paper, a 24 MHz prototype transducer made of PZT4 with low dielectric loss (0.004) and high mechanical Q (500) and high Curie temperature (328°C) was built yielding higher sonication energy and stronger durability (Zhang et al. 2005).
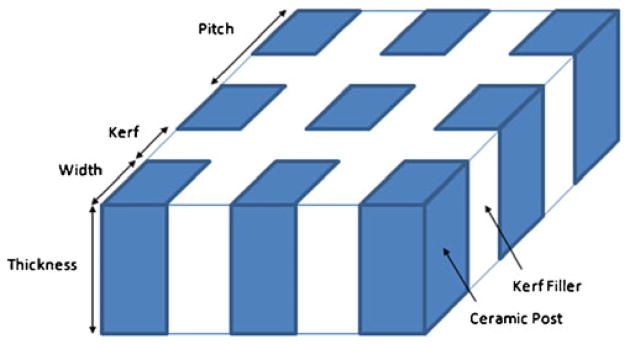
In order to obtain a spherical shaped aperture and a reduced impedance mismatch between a transducer and a propagating medium, the transducer had 1–3 piezocomposite structure (Newnham et al. 1978; Gururaja et al. 1985) which was composed of ceramic post and kerf filler. Figure 2 shows the configuration of 1–3 composite structure and the design specifications for the transducer were summarized in Table 1. The 24 MHz center frequency of the transducer was determined considering the particle size approximately more than 60 μm. The f-number (focal depth/aperture size) of the transducer was ‘1’ based on the previous theory and experiments (Lee et al. 2005, 2010a) in which the trapping force was related to the f-number, i.e., the transducer with lower f-number could provide high performance for particle trapping. The diameter and focal depth was 4 mm which were chosen considering the electrical impedance of the transducer, intensity, and the dimension of PDMS device used for this study. Note that the aforementioned design parameters could be changed based on applications.
Fig. 2.
Configuration of 1–3 piezoceramic composite
Table 1.
Design parameters of the transducer
| Center frequency [MHz] | 24 |
| Ceramic post | PZT4 |
| Kerf filler | EPO-TEK314 |
| Composite pitch [μm] | 50 |
| Composite kerf [μm] | 14 |
| Composite width [μm] | 36 |
| Thickness [μm] | 70 |
| Volume fractional ratio [%] | 52 |
| Ceramic post aspect ratio (width/thickness) | 0.5 |
| Aperture size [mm] | 4 |
| Focal depth [mm] | 4 |
A PZT4 (840, APC Company, Mackeyville, PA) sample, which is one of the PZT materials, was firstly diced using a 14 μm wide blade, and an unloaded epoxy (EPO-TEK314, Epoxy Technology, Billerica, MA) with high glass transition temperature was filled in the diced kerfs. After a three-hour curing, one side was slapped down, and subsequently 0.1 μm thick Gold/Chrome sputter layer was added on that side. The sputtered side was then flipped and its final thickness of 70 μm was obtained by 2nd lapping process. A silver loaded epoxy (E-SOLDER3022, VonRoll Isola, New Haven, CT) was used as a backing material. The 1–3 composite transducer with 4 mm diameter was assembled with a brass housing, and press-focused at 100°C by a 8 mm diameter chrome/steel ball to achieve its spherical shape conformation with f-number of one.
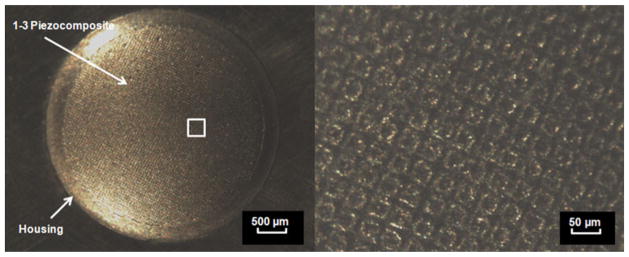
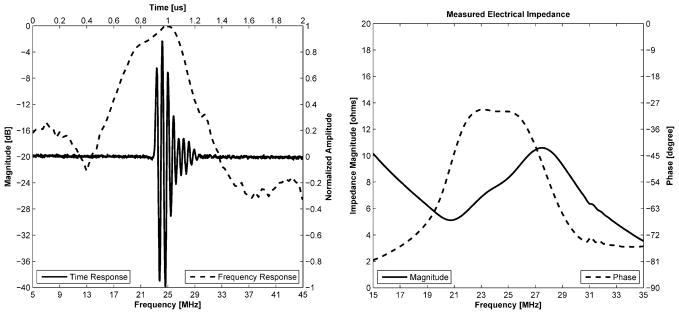
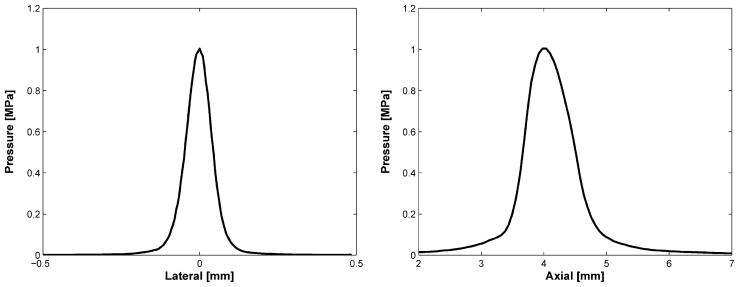
Figure 3 shows the structure of the transducer’s aperture whose center frequency was 24 MHz. The −6 dB bandwidth was 38% and the electrical impedance was 8 Ω at that frequency as shown in Fig. 4. Both bandwidth and impedance were sacrificed to achieve low f-number and required focal depth because of the channel dimension. Figure 5 shows lateral/axial pressure file measured by a hydrophone (HGL-0085, Onda Corp., Sunnyvale, CA). The thermal index (TI) and the mechanical index (MI) were, 0.11 and 0.055, respectively, the peak to peak pressure at the focal point was 1 MPa, which was used throughout the experiment. The lateral beam width and the depth-of-focus (DOF) were 86 and 84 μm, respectively.
Fig. 3.
Photographs of the transducer: a front view of the transducer with 1–3 piezocomposite structure (left) and the region of interest indicated by a white rectangle inset (right). Note that the scales for left and right figures are 500 and 50 μm, respectively
Fig. 4.
Measured pulse echo time/frequency response (left) and electrical impedance/phase (right) plots for the transducer
Fig. 5.
Lateral (left) and axial (right) pressure profiles measured by a hydrophone
2.3 Windowed chirp signal
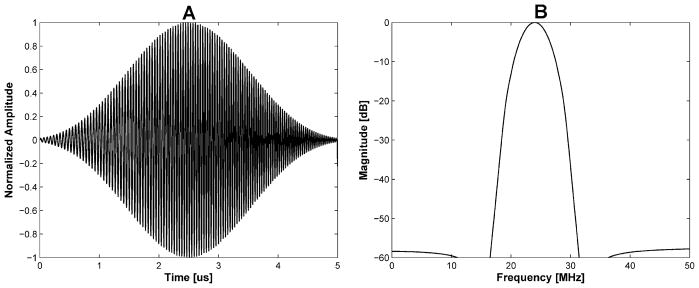
When the amplitude of voltage is fixed, the duty factor will affect the trapping force. However, a sinusoidal burst wave with a duty factor of more than 50% may generate a standing wave effect. It has been demonstrated that such effect can be reduced by frequency-sweeping chirp signals (Erpelding et al. 2007). In order to obtain a high duty factor and yet minimize standing waves, the Chebyshev-windowed-chirp signal with 18 to 30 MHz frequency sweeping range was utilized in the experiment as shown in Fig. 6. The temperature increase in the channel may be reduced by modulating the amplitude of the chirp signal as an applied voltage comparing to the un-modulated chip signal. A chirp signal used here was described as:
| (1) |
where ω0 is the angular frequency, Δω is the angular bandwidth, and α is the frequency slope of the chirp signal (O’Donnell 1992).
Fig. 6.
Simulated time (a) and frequency (b) response for the Chebyshev-windowed-chirp signal with frequency sweeping from 18 to 30 MHz. Note that a burst of this windowed chirp signal was input to the transducer throughout the experiment
2.4 Formation of PDMS microfluidic device
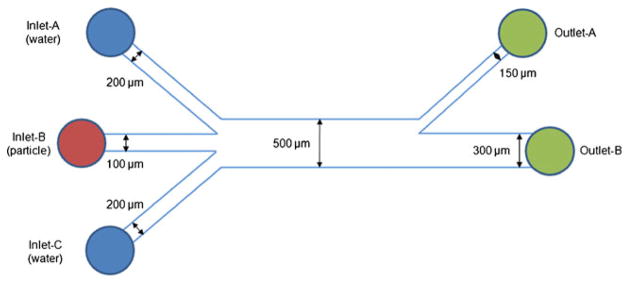
Figure 7 shows a schematic diagram of the microfluidic device with three narrow inlets leading into a main channel and then splitted into two outlets. The sheath flows from the two outer inlets provided the hydrodynamic focusing of the particle flow to the center of the channel. The sheath flow-A and C indicated the sheath flow from the inlet-A to the inlet-C, respectively. The dimension of the device was chosen considering the flowing particle size and penetration depth of ultrasounds.
Fig. 7.
Schematic diagram for the PDMS microfluidic channel device. Note that the height of all the channels was 100 μm
Sorting channels were fabricated in PDMS using conventional soft lithography techniques (Xia and Whitesides 1998). First, 3 in. silicon wafers were spin-coated with a 100 μm layer of SU-8 (NANO SU-8 50, MicroChem, Newton, MA) photoresist baked to evaporate away solvent on the silicon wafer. Subsequently, it was patterned by exposure to ultraviolet (UV) light through a high resolution photomask containing the channel design. After post-exposure baking, the wafer was then submerged in the SU-8 developer to expose the channel pattern. The remaining crosslinked SU-8 resist formed a raised mold for the silicone polymer. PDMS (Sylgard 184, Dow Corning, Midland, MI) was mixed at a 10:1 ratio of prepolymer base to curing agent, and poured over the patterned wafer. The polymer mixture was cured at 65°C during more than 4 h. After curing, the mold was detached and individual devices were obtained with cutting process. The connection holes were bored into the device using the flat end dispensing needles (Integrated Dispensing Solutions Inc., Agoura Hills, CA). The device was then cleaned before bonding via oxygen plasma treatment to a cleaned 5 mm thick slab of PDMS. The oxygen plasma was employed to activate the surfaces of the PDMS and further allowed irreversible bonding between the two surfaces.
A hydrophilic surface treatment was applied to the channels to minimize bubble formation and to match surface wettability. Polyvinyl alcohol (PVA) hydrophilic treatment was applied to the channels as it has been shown to maintain the PDMS surface hydrophilic for multiple weeks (Kozlov et al. 2003). The channels were incubated in a 1 wt.% PVA solution for 5 min at room temperature. The excess solution was removed by vacuum, and the device was incubated in a 120°C oven for 5 min to promote adhesion of the PVA monomers to the PDMS surface. This process was repeated multiple times to ensure even coating to the surface.
2.5 Scenarios
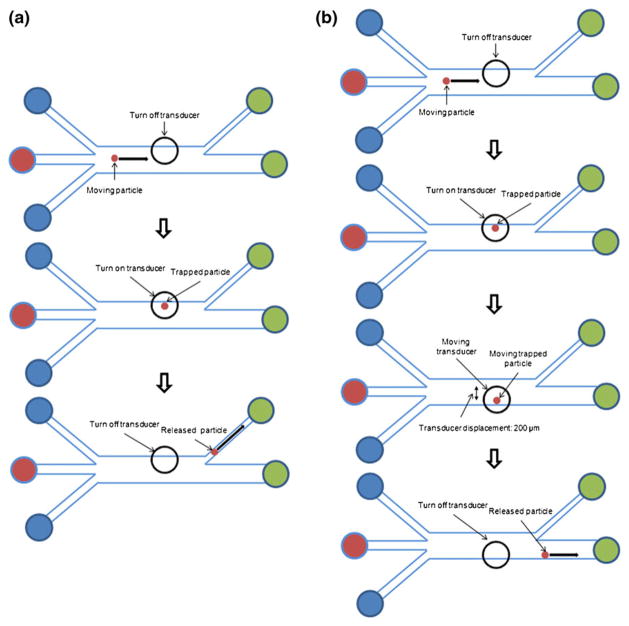
In this study, two kinds of scenarios were experimentally conducted as shown in Fig. 8. In scenario-A (Fig. 8(a)), the moving particle in the center of the main channel was trapped by the activated transducer located at the sheath flow-A. The trapped particle was then released after a few seconds by turning off the transducer and subsequently directed to the outlet-A. In the case of scenario-B (Fig. 8 (b)), the flowing particle was trapped by the activated transducer, and the transducer with trapping a particle was shifted from the sheath flow-A to the sheath flow-C. After turning off the transducer, the trapped particle was released and diverted into the outlet-B.
Fig. 8.
Schematic diagrams for the scenario-A (a) and B (b)
3 Experiments
3.1 Experimental setup
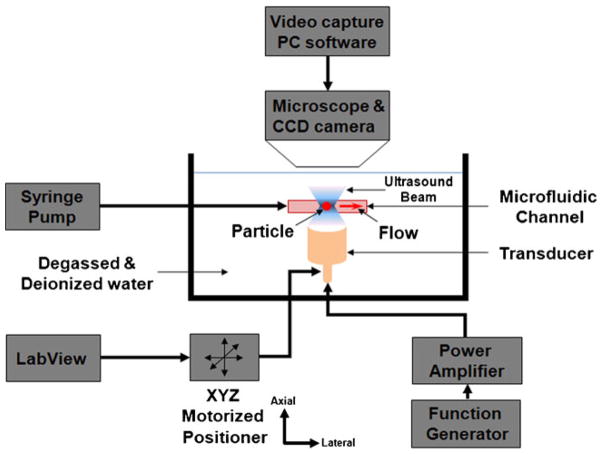
Figure 9 shows the experimental setup for the moving particle trapping. Two outer sheath inlets (inlet-A, C) were connected to multiple syringe pumps (NE-1000 MultiPhaser™, New Era Pump System Inc., NY, USA) and 60~70 μm lipid droplets were injected in the inlet-B. In order to distinguish three sub-channels in the main channel, a green dye was used for inlet-A and C except inlet-B. A transducer was mounted the below of the device, so the focused ultrasound wave was emitted from the bottom to the top. A windowed chirp signal generated by a function generator (AFG 3251; Tecktronix, Anaheim, CA, USA) was amplified with a 50 dB power amplifier (325LA; ENI, Rochester, USA). The position of the transducer was controlled by a three-axis motorized linear stage (LMG26 T50 MM; OptoSigma, Santa Ana, CA, USA). The trapping was monitored and recorded with a CCD camera (InfinityX; Lumenera, USA) which was assembled with a microscope (SMZ1500, Nikon, Japan). A control program for the positioner was programmed by a labVIEW (Laboratory Virtual Instrumentation Engineering Workbench, National Instruments Corp., Austin, TX, USA).
Fig. 9.
Experimental setup for the trapping of particles flowing in the channel
The lipid spheres (Oleic Acid) were injected in the inlet-B. A sample and buffer flow rates were all 2.0 μl/min. The focal depth was 4 mm and the applied voltage to the transducer was 30 Vpp which would provide 1 MPa pressure based on hydrophone measurement (Hurrell 2004; Wilkens and Koch 2004; Howard and Zanelli 2007). The Chebyshev windowed chirp signal with 18~30 MHz frequency range and 5 μs time duration was used. The PRT (Pulse Repetition Time) was 5 ms and the number of cycles was 500 and thus the duty factor of the chirp signal was 50%.
3.2 Experimental results
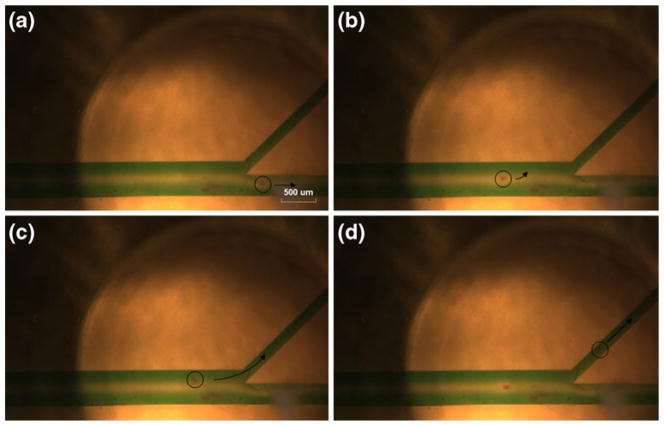
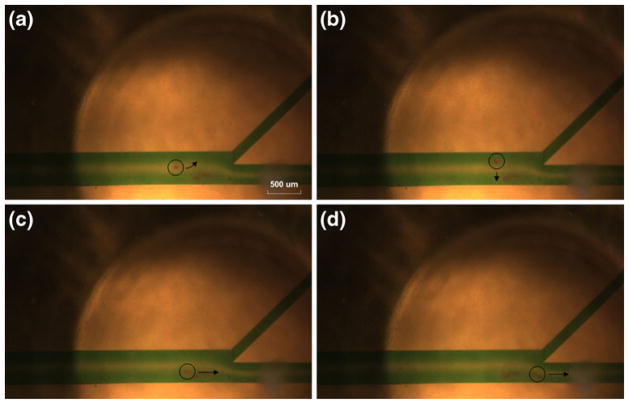
Figure 10 shows the sequential photos for the scenario-A. Water mixed with a green color dye was injected in the inlet-A and C subsequently, red color lipid particles mixed with water were injected in the inlet-B. When the transducer was turned off as shown in Fig. 10(a), the particle flew through the main channel directing outlet-B with 2 μl/min flow velocity. When the transducer was turned on, the flowing particle was trapped by the transducer located at the sheath flow-A as shown in Fig. 10(b) and (c). After a few seconds, the transducer was turned off again, and the particle was released and subsequently directed to the outlet-A as shown in Fig. 10 (d). In the scenario-B in Fig. 11, the particle was trapped by the transducer located at the sheath flow-A (Fig. 11(a) and (b)). The transducer was then moved to the third channel with the trapped particle by 200 μm as shown in Fig. 11(c). In the sheath flow-C, the particle was released (Fig. 11(d)) and it was directed to the outlet-B. Note that all corresponding particles and the next directions were indicated by a black color circle with an arrow, respectively.
Fig. 10.
Experimental demonstration of moving particle trapping with a single acoustic beam. Sequential photographs for a scenario-A; (a) A particle was moved to the outlet-B when a transducer was turned off. (b), (c) A flowing particle was trapped when a transducer was turned on. (d) A trapped particle was diverted to the outlet-A after turning off a transducer. Note that the 4 mm focal distance of the transducer was constant in all experiments
Fig. 11.
Experimental demonstration of moving particle trapping with a single acoustic beam. Sequential photographs for a scenario-B; (a), (b) A flowing particle was trapped when a transducer was turned on. (c) A trapped particle was moved to the sheath flow-C by shifting the transducer vertically by 200 μm. (d) A tapped particle was diverted to the outlet-B after turning off a transducer. Note that the 4 mm focal distance of the transducer was constant in all experiments
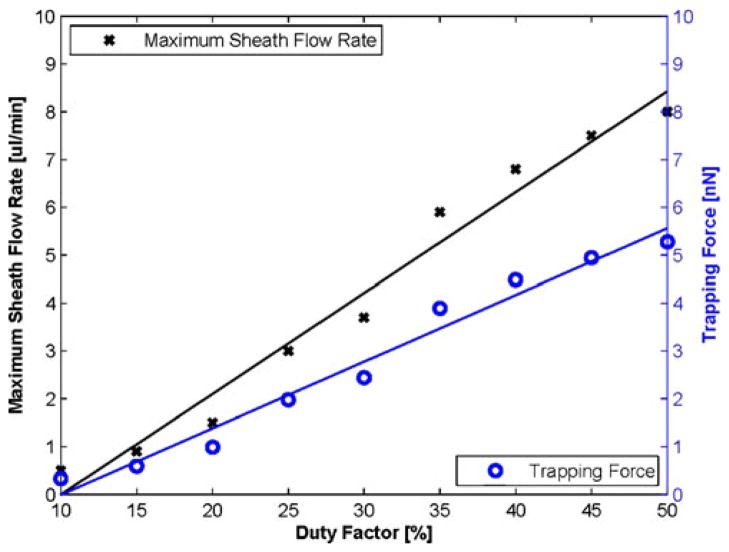
Several repeatable experiments were performed to obtain the relationship between duty factor, trapping force, and lateral shifting under the same experimental setup of scenario-A. The trapping force was estimated from the drag force calculated from the flow rate. For a fixed particle flow of 2 μl/min, the curves for duty factor vs. sheath flow rate and duty factor vs. trapping force have been obtained as shown in Fig. 12. Note that the droplet was trapped at the center of the sheath flow A throughout this experiment for Fig. 12. As the duty factor was changed from 10% to 50%, the maximum sheath flow rate was also increased from 0.5 to 8 μl/min, and thus the trapping force was increased from 0.3 to 5.2 nN.
Fig. 12.
Maximum sheath flow rate (cross scatter, black regression line) and trapping force (circle scatter, blue regression line) as a function of duty factor. A trapping force was estimated from the drag force calculated from the sheath flow rate. There was a linear relationship between the duty ratio and maximum sheath flow rate/the trapping force. The slopes of maximum sheath flow rate and trapping force were approximately 0.21 and 0.14, respectively, obtained from linear least squares method
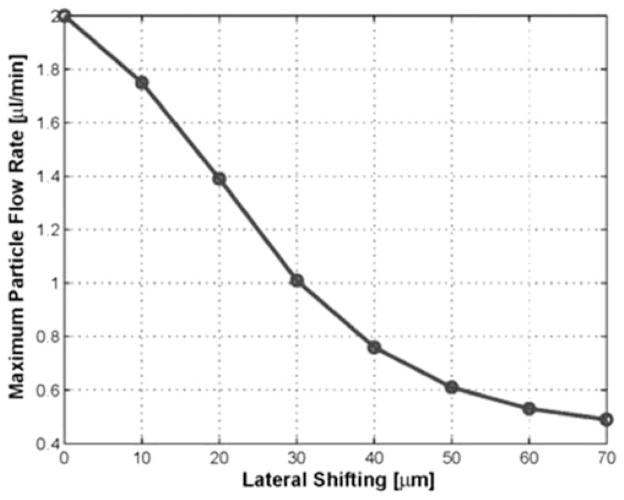
For a fixed duty factor of 50% and sheath flow rate of 8 μl/min, the relationship between lateral shifting and particle flow rate has been displayed as shown in Fig. 13. Initially, the transducer was located at the center of the channel A and the particle flew through middle of the channel B. The transducer was laterally moved towards the channel wall and its shifted distance was measured with respect to the center of the sheath flow A. No flowing particles were trapped more than 70 μm of lateral shifting although the maximum flow rate was lower than 0.5 μl/min.
Fig. 13.
Maximum particle flow rate as a function of lateral shifting. The duty factor was 50% and the sheath flow rate was 8 μl/min
In order to measure how fast the particle can follow, the transducer with trapped particle was moved under the same experimental condition of scenario-B. Note that for a duty factor of 50%, the flow rates for droplets and sheaths were fixed at 2 and 8 μl/min, respectively. A droplet was first trapped at 20 μm below the center of the sheath flow A. The transducer was then laterally (or perpendicularly to the particle flow) translated by 200 μm towards the sheath flow C. Subsequently the once trapped droplet was immobilized at the trap again with a time delay. Given that the frame rate of the camera was 15 frame/s, the number of frames during which the droplet is in motion was 22 and thus the delay was 1.47 s. Hence the speed of the moving droplet was 200 μm/1.47 s = 136 μm/s. In this case, the speed of the moving stage holding the transducer was fixed due to equipment limitation.
4 Discussion and conclusion
In this paper, it was experimentally demonstrated that a 24 MHz high frequency sound beam could successfully trap lipid particles moving in a microfluidic channel. A prototype transducer was built using PZT4 to obtain high acoustic power with increased durability. A highly focused aperture (f-number = 1) was achieved by using 1–3 piezocomposite structure for particle trapping. An acoustic single beam driven by the Chebyshev-windowed chirp signal with 50% duty factor was transmitted to the target without any damage on the transducer and the target. This increased acoustic power could trap moving particles in the microfluidic channel flowing with 2.0 μl/min velocity. Moreover, a further increase in acoustic power would allow trapped particles to move against a streaming fluid. Utilizing a frequency modulated chirp signal minimized the standing wave generation.
There are several factors affecting the performance of the proposed scheme such as the duty factor, the particle flow rate, the distance between acoustic source and the moving target, the focal distance, and the trapping force. In order to measure the threshold values of the aforementioned factors, additional experiments were conducted and each factor was changed maintaining other experimental parameters constant. Under the current experimental setup, the trapping force was 0.3 nN to 5.2 nN as a function of duty factor. In order to measure the trapping force in the flowing channel, the trapping force was assumed to be identical to the drag force calculated by increasing the flow rate while the transducer trapped the particle. The maximum distance to trap the moving particles was approximately 237 μm at sheath flow rate of 0.5 μl/min. The trapped particle was followed the moving transducer with 136 μm/s of velocity. Although the speed of moving transducer was not changed due to equipment limitation, it may be another factor that affects trapping performance, i.e., if its speed is too fast, the trapped particle will be released during the motion of the transducer. A compromise between the amplitude of pressure and duty factor might be needed given that possible mechanical and thermal effects might have to be considered. In order to obtain desired results, careful selection of the aforementioned factors is needed. Additionally, they will affect the design configuration of the microchannel device.
Although the proposed scheme may have low throughput comparing to standing wave method, these preliminary experimental results suggested that a single acoustic beam generated by a high frequency transducer may be used for the development of ultrasound-based flow cytometers or similar cell sorting devices. In the future, the fabrication of very high frequency transducer (>200 MHz) capable of operating at higher power will be pursued to manipulate smaller cells such as prokaryotic cells with a size of a few micrometers.
Supplementary Material
Acknowledgments
The authors would like to thank Dr. Hyung Ham Kim for hydrophone measurements. The work has been partially supported by NIH grant # P41-EB2182.
Footnotes
Electronic supplementary material The online version of this article (doi:10.1007/s10544-011-9548-0) contains supplementary material, which is available to authorized users.
Contributor Information
Jong Seob Jeong, Email: jjsspace@gmail.com, Department of Medical Biotechnology, College of Life Science and Biotechnology, Dongguk University-Seoul, Seoul, 100–715, Republic of Korea.
Jung Woo Lee, Department of Biomedical Engineering, University of Southern California, Los Angeles, CA 90089, USA.
Chang Yang Lee, Department of Biomedical Engineering, University of Southern California, Los Angeles, CA 90089, USA.
Shia Yen Teh, Department of Biomedical Engineering, University of California at Irvine, Irvine, CA 92697, USA.
Abraham Lee, Department of Biomedical Engineering, University of California at Irvine, Irvine, CA 92697, USA.
K. Kirk Shung, Department of Biomedical Engineering, University of Southern California, Los Angeles, CA 90089, USA.
References
- Ashkin A, Dziedzic JM, Bjorkholm JE, Chu S. Opt Lett. 1986;11:288. doi: 10.1364/ol.11.000288. [DOI] [PubMed] [Google Scholar]
- Auroux PA, Iossifidis D, Reyes DR, Manz A. Anal Chem. 2002;74:2637. doi: 10.1021/ac020239t. [DOI] [PubMed] [Google Scholar]
- Coakley WT. Trends Biotechnol. 1997;15:506. doi: 10.1016/s0167-7799(97)01122-0. [DOI] [PubMed] [Google Scholar]
- de Castro MDL, Priego-Capote F. TrAC, Trends Anal Chem. 2007;26:154. [Google Scholar]
- Erpelding TN, Hollmana KW, O’Donnell M. Ultrasound Med Biol. 2007;33:263. doi: 10.1016/j.ultrasmedbio.2006.07.039. [DOI] [PMC free article] [PubMed] [Google Scholar]
- Ghislain LP, Switz NA, Webb WW. Rev Sci Instrum. 1994;65:2762. [Google Scholar]
- Grier DG. Nature. 2003;424:810. doi: 10.1038/nature01935. [DOI] [PubMed] [Google Scholar]
- Gururaja TR, Schulze WA, Cross LE, Newnham RE, Auld BA, Wang YJ. IEEE Trans Ultrason Ferroelectr Freq Control SU- 1985;32:481. [Google Scholar]
- Hertz HM. J Appl Phys. 1995;78:4845. [Google Scholar]
- Howard SM, Zanelli CI. 6th international symposium on therapeutic ultrasound. AIP Conf. Proc; 2007. [Google Scholar]
- Hughes MP. Electrophoresis. 2002;23:2569. doi: 10.1002/1522-2683(200208)23:16<2569::AID-ELPS2569>3.0.CO;2-M. [DOI] [PubMed] [Google Scholar]
- Hurrell A. J Phys Conf Ser. 2004;1:57. [Google Scholar]
- Kozlov M, Quarmyne M, Chen W, McCarthy TJ. Macromolecules. 2003;36:6054. [Google Scholar]
- Laurell T, Petersson F, Nilsson A. Chem Soc Rev. 2007;36:492. doi: 10.1039/b601326k. [DOI] [PubMed] [Google Scholar]
- Lee H, Purdon A, Westervelt RM. Appl Phys Lett. 2004;85:1063. [Google Scholar]
- Lee JW, Ha K, Shung KK. J Acoust Soc Am. 2005;117:3273. doi: 10.1121/1.1886387. [DOI] [PubMed] [Google Scholar]
- Lee JW, Teh SY, Lee A, Kim HH, Lee CY, Shung KK. Ultrasound Med Biol. 2010a;36:350. doi: 10.1016/j.ultrasmedbio.2009.10.005. [DOI] [PMC free article] [PubMed] [Google Scholar]
- Lee JW, Lee CY, Shung KK. IEEE Trans Ultrason Ferroelectr Freq Control. 2010b;57:2305. doi: 10.1109/TUFFC.2010.1691. [DOI] [PMC free article] [PubMed] [Google Scholar]
- Liu Y, Hu J. IEEE Trans Ultrason Ferroelectr Freq Control. 2009;56:798. doi: 10.1109/TUFFC.2009.1102. [DOI] [PubMed] [Google Scholar]
- MacDonald MP, Spalding GC, Dholakia K. Nature. 2003;426:421. doi: 10.1038/nature02144. [DOI] [PubMed] [Google Scholar]
- Newnham RE, Skinner DP, Cross LE. Mater Res Bull. 1978;13:525. [Google Scholar]
- O’Donnell M. IEEE Trans Ultrason Ferroelectr Freq Control. 1992;39:341. doi: 10.1109/58.143168. [DOI] [PubMed] [Google Scholar]
- Pohl HA. J Appl Phys. 1951;22:869. [Google Scholar]
- Reyes DR, Iossifidis D, Auroux PA, Manz A. Anal Chem. 2002;74:2623. doi: 10.1021/ac0202435. [DOI] [PubMed] [Google Scholar]
- Saiyed ZM, Telang SD, Ramch CN. Biomagn Res Technol. 2003;1 doi: 10.1186/1477-044X-1-2. [DOI] [PMC free article] [PubMed] [Google Scholar]
- Shi J, Ahmed D, Mao X, Lin SS, Lawit A, Huang TJ. Lab Chip. 2009;9:2890. doi: 10.1039/b910595f. [DOI] [PubMed] [Google Scholar]
- Svoboda K, Block SM. Opt Lett. 1994;19:930. doi: 10.1364/ol.19.000930. [DOI] [PubMed] [Google Scholar]
- Voldman J. Annu Rev Biomed Eng. 2006;8:425. doi: 10.1146/annurev.bioeng.8.061505.095739. [DOI] [PubMed] [Google Scholar]
- Washizu M. J Electrostat. 1990;25:109. [Google Scholar]
- Wilkens V, Koch C. J Phys Conf Ser. 2004;1:50. [Google Scholar]
- Woodside S, Bowen S, Piret J. AIChE J. 1997;43:1727. [Google Scholar]
- Wu J, Du G. Acoust Soc Am. 1990;87:997. doi: 10.1121/1.399065. [DOI] [PubMed] [Google Scholar]
- Xia YN, Whitesides GM. Annu Rev Mater Sci. 1998;28:153. [Google Scholar]
- Yan J, Skoko D, Marko JF. Phys Rev E. 2004;70:011905. doi: 10.1103/PhysRevE.70.011905. [DOI] [PubMed] [Google Scholar]
- Zhang S, Xia R, Lebrun L, Anderson D, Shrout TR. Mater Lett. 2005;59:3471. [Google Scholar]
Associated Data
This section collects any data citations, data availability statements, or supplementary materials included in this article.


