Abstract
We demonstrated an optical coding method to measure the position of each particle in a microfluidic channel. The technique utilizes a specially designed pattern as a spatial mask to encode the forward scattering signal of each particle. From the waveform of the forward scattering signal, one can obtain the information about the particle position and velocity. The technique enables us to experimentally investigate the complex relations between particle positions within the microfluidic channel and flow conditions and particle sizes. The method also produces insight for important phenomenon in microfluidic and lab-on-a-chip devices such as inertial focusing, Dean flow, flow confinement, etc.
INTRODUCTION
Advances in micro-electromechanical technology have enabled the fabrication of microfluidic devices integrated with various functions related to biology and medicine. For example, microfluidic devices have been shown to be able to detect, separate and analyze biological samples.1, 2, 3, 4 Inside microfluidic channels, bioparticles including cells, beads, and macromolecules are interrogated according to their optical, electrical, acoustic, and magnetic responses. A typical device possessing many of the above functions is a microfluidic flow cytometer.5 For most microfluidic or lab-on-a-chip devices, the positions of samples within the microchannels can significantly affect the quality of signals such as the value of coefficient of variation (CV). Should the device be used to separate or isolate certain subpopulations of cells or particles, the precise control of sample positions inside the channel becomes especially important.
To control and manipulate the positions of samples inside microchannels, a wide range of approaches for positioning particles have been explored. The current methods for positioning samples can be categorized into sheath and sheathless focusing approaches.6 Sheath focusing employs sheath fluids to narrow sample flows. Although highly effective, the design tends to have a relatively low throughput which could become a concern for certain applications.7 Also for most microfluidic devices, sheath flow confines the particles in the in-plane direction but requires special designs and more complex processes to achieve particle confinement in the out-of-plane direction. To significantly increase the throughput for applications that require a large volume of samples such as milliliters of whole blood or body fluid, sheathless approaches have been actively investigated. To control particle behaviors in a sheathless design, an external force can be applied to move particles to the reestablished equilibrium positions through dielecrophoretic (DEP) effects,8 acoustic effects,9 or inertial effects induced by the balance between lifting and drag forces.10 Among these mechanisms, devices using inertial focusing are perhaps the simplest to fabricate because inertial focusing does not require additional electrodes and external signals to guide the suspended particles in the microfluidic channels. Similar to inertial focusing, there exist a large number of designs that use no external forces but the channel geometry and the intrinsic fluid dynamic properties to manipulate the suspended particles in the flow. Some of such designs include microfluidic Dean flow devices,11 curved channel, serpentine channel,12 corrugated channel, to name a few. However, for all the sheath and sheathless methods that control the particle distribution in the flow, there is no experimental technique, to our best knowledge, to accurately and non-invasively measure the particle distribution over the channel area under different flow conditions and particle sizes. Fluid dynamic simulation tools such as FLUENT and COMSOL are often used to simulate the flow velocity profiles within the channel, but these tools have limited capabilities to simulate how real bioparticles are distributed inside the microchannel because of the highly complicated physics and mathematics involved when particles are added to the flow medium in the simulation. However, to achieve repeatable and controllable device characteristics, it is essential to develop a method to measure the particle distribution inside microfluidic channels.
EXPERIMENTS AND METHODS
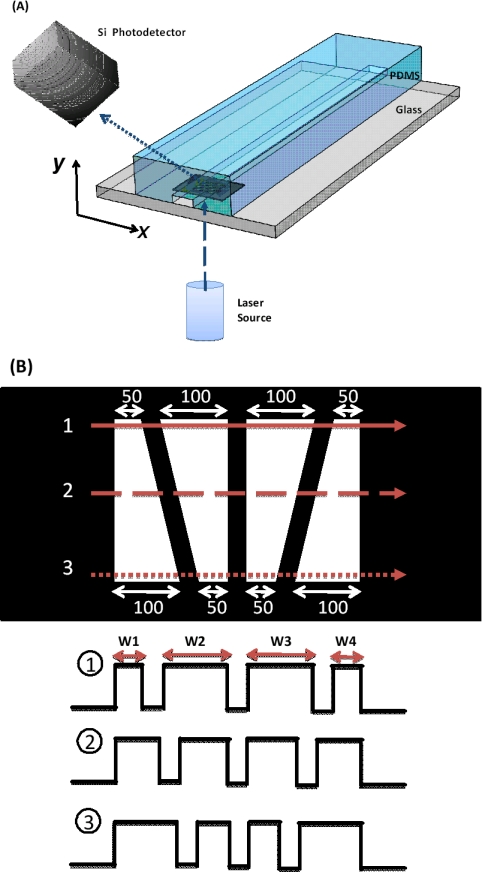
In this paper, we present an optical-coding technique to obtain the position and velocity information of particles within microchannels. In our technique, the forward scattering signal of each individual particle is encoded by a spatial filter designed in such a way that both the position and velocity of each particle can be obtained from the waveform of the forward scattering signal. Figure 1a shows the schematic of the experimental setup. To prove the concept, a microfluidic device with a straight channel was fabricated in polydimethylsiloxane (PDMS, Sylgard 184, Dow Corning) bonded to a glass substrate. The microfluidic channel is 5 cm long and has a cross-section of 100 μm × 45 μm (width × height). Over the area where the forward scattering signal was detected, we formed a pattern of four transparent trapezoidal slits as a spatial mask by patterning a thin Ti/Au metal film on the glass substrate. Thus the forward scattering signal of a particle displayed a specific waveform according to the lateral position the particle travels through, as illustrated in Fig. 1b. Each trapezoidal slit has its base lengths of 100 μm and 50 μm. Fours slits were separated by 50 μm between each other and located 4.5 cm from the inlet.
Figure 1.
(a) Schematic of our optical-coding microfluidic device setup. (b) An illustration of spatial pattern for optical coding. Three representative forward-scattering signals are shown for particles travelling through different positions of the microfluidic channel. Each trapezoidal slit has its base lengths of 100 μm and 50 μm. The width of each peak, W1 through W4, in the signal is used to acquire the position of particles along the x-direction. The method to find the position along the y-direction will be discussed later.
A 488 nm wavelength diode laser (40mW, Spectra-physics) was used as the optical source for the forward scattering measurement. The beam spot of the laser has a Gaussian intensity profile across the whole sensing area of 450 μm. A silicon photodetector (PDA36A, Thorlabs) was placed over the microfluidic device to collect 5∼10 degree forward scattering signals from particles through the sensing area. A mixture of polystyrene beads with diameters of 5, 10 and 15 μm (PPS-6K, Sphero) was injected into the microchannel with the flow rate controlled by a syringe pump (NE-1000, New Era Pump Systems).
Because of the unequal width for each slit, the particles will produce forward scattering signals with 4 peaks of different widths in time domain. The optical-coded forward scattering signals were processed using a custom MATLAB script with standard filtering techniques; and the results gave rise to the particle position along the direction of channel width, defined as the x-axis, and velocity for each particle. This script also allows us to identify the types of particles by the intensity of forward scattering signals.
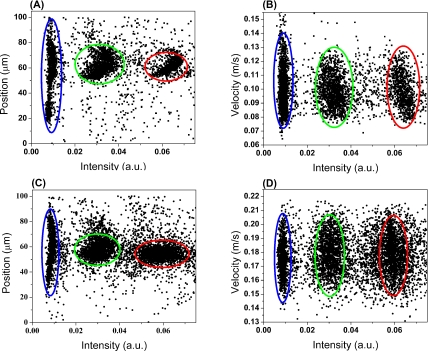
Figure 2 shows the scatter plots of particle position and velocity distribution along the x-axis versus intensity of forward scattering at a flow rate of 25 μL/min and 50 μL/min, respectively. The flow contains a mixture of 5μm, 10 μm, and 15 μm diameter particles. The approximately 5000 processed events exhibit three distinct populations, indicating particles with different size could be discriminated by their forward scattering intensity. The position of each particle along the x-axis is determined by the width ratio of the first peak (W1) to the second peak (W2) as well as the width ratio of the fourth peak (W4) to the third peak (W3). The velocity of each particle is obtained by dividing the pattern length, 450μm, with the overall duration of the signal.
Figure 2.
Scatter plots of particle position along x-axis versus forward scattering intensity, (a) and (c), and particle velocity versus intensity, (b) and (d), at flow rates of 25 μL/min and 50 μL/min, respectively. Red circle: 15 μm beads, Green circle: 10 μm beads, Blue circle: 5 μm beads.
Next we describe the method to obtain the particle position along channel depth (i.e. y-axis) from the particle velocity. In microchannels, a laminar flow is formed due to the low Re (Reynold number, Re=ρUfDh/μ, ρ: fluid density, Uf: average velocity of flow, Dh: hydraulic diameter of microchannels, and μ: fluid viscosity). As a result, at a given particle position along the width (x-direction) of the channel, the velocity profile along the out-of-plane (y-axis) direction obeys, to a good approximation, the parabolic characteristics:
| (1) |
where υ is the velocity at a specific position, υMax is the velocity at position x and the middle of the channel (i.e., at y=0), and h is the half-depth of the channel, 22.5 μm in this work. Therefore, as long as we obtain υMax at each position x from straightforward fluid dynamic simulation, we can obtain the position y of the particle from its velocity using Eq. 1.
RESULTS AND DISCUSSION
For our device, the microchannel cross-section is rectangular with Dh of 62.1μm and the measured average velocities are 0.09 and 0.18 m/s for the flow rates of 25 and 50 μL/min, resulting in Re of 5.59 and 11.18, respectively. The measured average velocities agree well with the values calculated from COMSOL simulations (Fig. 3) that yield the average velocities of 0.09 and 0.19 m/s. This justifies the use of the simulated υMax(x) to find the out-of-plane position of the particle, y, from Eq. 1.
Figure 3.
Simulated flow velocity profile on the x-y plane at a flow rate of (a) 25μL/min and (b) 50 μL/min.
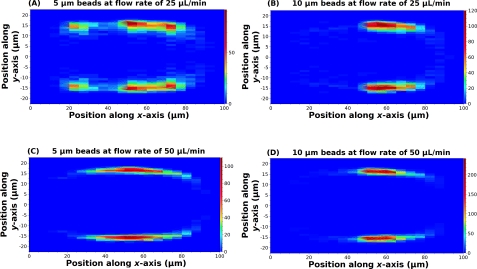
Figure 4 illustrates the contour plot of spatial distribution for 5 and 10 μm beads at flow rates of 25 and 50 μL/min, respectively. We omit plots for 15 μm beads to save space since under the current experimental condition the spatial distribution of 15 μm beads is very similar to that of 10 μm beads. Some key results are summarized next.
Figure 4.
Spatial distribution of particles within microfluidic channels. (a) and (b) are results for 5 and 10 μm beads at a flow rate of 25 μL/min. (c) and (d) are results for 5 and 10 μm beads at a flow rate of 50 μL/min. The color bar shows the frequency of microbeads population.
First of all, the results show that the stable positions for both 5 μm and 10 μm beads are 8.3 μm away from the channel wall (i.e. ±14 μm from center) under a flow rate of 25 μL/min and ∼6.8 μm away from the channel wall (i.e. ∼±16 μm from center) under a flow rate of 50 μL/min. These results indicate that particles migrate closer to the wall as Re increases;10 and under these experimental parameters, the lift force drives particles to positions that are ∼0.2 H away from the walls where H is the characteristic dimension (i.e. height of the microchannel for our device geometry).13 Secondly, along the x-axis, larger particles are more concentrated toward the center of the channel.
Such distinct phenomena in particle distributions along the x- (width) and y-axes (height) are consistent with the results predicted by the fluidic dynamic theory for inertial focusing. The lift force can be represented as FL=ρG2CLd4 where G is the fluid shear rate (G = 2 Uf/H), CL is the lift coefficient (which for microchannels remains constant), and d is the particle diameter.10 In our device geometry, the width to height ratio is larger than 2, resulting in a lift force in the y-direction four times greater than the force in the x-direction due to different shear rates. This effect causes particles to migrate toward the longer channel walls to find the equilibrium positions.14 Concerning the lift force in the x-direction, its magnitude depends on the size of particles to the 4th power so the lift force of 10 μm beads is 16 times of the lift force of 5 μm beads. The greater lift force leads larger beads to be farther away from the walls of shorter dimension and show a narrower distribution than the smaller beads, consistent with the results in Fig. 4.
To show the feasibility of our technique for cell detection, we performed preliminary experiment with fibroblast cells at a flow rate of 30 μL/min. About 1000 events were detected and processed, and the results are shown in Fig. 5. Fibroblasts have a typical size of around 15 μm, and the cell focusing effect is clearly demonstrated in Fig. 5b. Due to the depth and angle of tubing insertion to microfluidic devices, the particle distribution along the x-axis direction might show bias from the center of the channel; and our method can faithfully reveal such effects of interfacing the macro- and micro- fluidic environments. So far all the experiments have been performed at sample speeds between 5 cm/s and 20 cm/s, which are typical values for many applications (e.g. flow cytometer, cell counter, complete blood count, etc.). This method can be applied to higher sample speeds for high throughput applications because the Si photoreceiver has a large (>10 MHz) gain-bandwidth product. For special applications that require lower sample speeds, one would expect improved CVs than the reported values here provided the sample is properly diluted to reduce the probability of coincident events. Similar to conventional forward scattering measurements, our technique is subject to the laser intensity noise, amplifier thermal noise, and possibly speckle noise. Such noises may contribute to the increase in the CV values as well as the uncertainties in the sample position measurements.
Figure 5.
(a) Scatter plot of fibroblast position along x-axis versus forward scattering intensity and (b) Spatial distribution of fibroblast within the microfluidic channel at a flow rate of 30 μL/min.
CONCLUSIONS
To summarize, we have demonstrated, for the first time, an optical-coding technique to experimentally obtain the particle distributions in a microfluidic channel under different flow conditions. After processing the forward scattering signals encoded by a specially designed spatial mask, we obtain the position and velocity of each bead. The results provide insight of the behaviors of different particles in microfluidic channels. We also demonstrate the feasibility of the technique to mammalian cells and produce the spatial distribution of cells within the microfluidic channel. The technique can help us evaluate and design microfluidic lab-on-a-chip devices such as cell sorters and flow cytometers. The methodology will find wide applications in microfluidic biomedical devices.
ACKNOWLEDGMENTS
The authors acknowledge the technical support of the staff of UCSD Nano3 (Nanoscience, Nanoengineering, and Nanomedicine) Facility in Calit2. The work was supported by NIH grants R01HG004876 and R21RR024453. One of the authors, Zhe Mei, was supported by Chinese Scholarship Council and National Natural Science Foundation of China No.61001063.
References
- Toner M. and Irimia D., Annu. Rev. Biomed. Eng. 7, 77 (2005). 10.1146/annurev.bioeng.7.011205.135108 [DOI] [PMC free article] [PubMed] [Google Scholar]
- Yager P., Edwards T., Fu E., Helton K., Nelson K., Tam M. R. and Weigl B. H., Nature. 442, 412 (2006). 10.1038/nature05064 [DOI] [PubMed] [Google Scholar]
- Whitesides G. M., Nature. 442, 368 (2006). 10.1038/nature05058 [DOI] [PubMed] [Google Scholar]
- Cho S. H., Chen C. H., Tsai F. S., Godin J., Lo Y. H., Lab Chip. 10, 1567 (2010) 10.1039/c000136h [DOI] [PMC free article] [PubMed] [Google Scholar]
- Godin J., Chen C. H., Cho S. H., Qiao W., Tsai F. and Lo Y.-H., J. Biophotonics. 5, 355 (2008). 10.1002/jbio.200810018 [DOI] [PMC free article] [PubMed] [Google Scholar]
- Xuan X., Zhu J., Church C., Microfluid Nanofluid 9, 1 (2010). 10.1007/s10404-010-0602-7 [DOI] [Google Scholar]
- Watkins N., Venkatesan B. M., Toner M., Rodriguez W. and Bashir R.. Lab Chip 9, 3177 (2009). 10.1039/b912214a [DOI] [PMC free article] [PubMed] [Google Scholar]
- Cummings E. B. and Singh A. K.. Anal. Chem. 75, 4724 (2003). 10.1021/ac0340612 [DOI] [PubMed] [Google Scholar]
- Hawkes J. J., Barber R. W., Emerson D. R. and Coakley W. T., Lab Chip. 4, 446 (2004) 10.1039/b408045a [DOI] [PubMed] [Google Scholar]
- Di Carlo D., Irimia D., Tompkins R. G.. PNAS. 104, 18892 (2007). 10.1073/pnas.0704958104 [DOI] [PMC free article] [PubMed] [Google Scholar]
- Bhagat A. A. S., Kuntaegowdanahalli S. S. and Papautsky I.. Lab Chip. 8, 1906 (2008). 10.1039/b807107a [DOI] [PubMed] [Google Scholar]
- Zhu J., Tzeng T. J., Hu G. and Xuan X.. Microfluidics Nanofluidics. 7, 751 (2009) 10.1007/s10404-009-0432-7 [DOI] [Google Scholar]
- Chun B. and Ladd A.. Phys. Fluids 18, 031704 (2006) 10.1063/1.2176587 [DOI] [Google Scholar]
- Bhagat A. A. S., Kuntaegowdanahalli S. S. and Papautsky I.. Microfluid. Nanofluid. 7, 217 (2009) 10.1007/s10404-008-0377-2 [DOI] [Google Scholar]


