Abstract
A novel type of silica-based sulfonate-modified reversed phase (−SO3-HC-C8 ) has been synthesized; it is based on a newly developed acid stable “hyper-crosslinked” C8 derivatized reversed phase, denoted HC-C8. The −SO3-HC-C8 phases containing controlled amounts of sulfonyl groups were made by sulfonating the aromatic hyper-crosslinked network of the HC-C8 phase at different temperatures. The −SO3-HC-C8 phases are only slightly less hydrophobic than the parent HC-C8 phase. The added sulfonyl groups provide a unique strong cation-exchange selectivity to the hydrophobic hyper-crosslinked substrate as indicated by the very large C coefficient as shown by Snyder’s hydrophobic subtraction reversed-phase characterization method. This cation-exchange activity clearly distinguishes the sulfonated phase from all other reversed phases as confirmed by the extraordinary high values of Snyder’s column comparison function Fs. In addition, as was found in previous studies of silica-based and zirconia-based reversed phases, a strong correlation between the cation-exchange interaction and hydrophobic interaction was observed for these sulfonated phases in studies of the retention of cationic solutes. The overall chromatographic selectivity of these −SO3-HC-C8 phases is greatly enhanced by its high hydrophobicity through a “hydrophobically assisted” ion-exchange retention process.
Keywords: HPLC, Stationary phase, Reversed phase, Cation exchange, Selectivity, Basic analytes
1. Introduction
Cation-exchange chromatography is widely applied to the separation of different types of analytes including metal ions [1–3], basic drugs [4,5], proteins and peptides [6–9]. As one of the most important retention modes, cation exchange provides an intrinsically different retention mechanism and thus different selectivity from the most popular mode of chromatography, namely reversed-phase liquid chromatography (RPLC). The very different selectivities of cation exchangers and reversed-phase materials make them a very attractive pair of chromatographic systems for use in two-dimensional liquid chromatography, which is becoming more widely applied to the separation of very complex samples, such as the tryptic peptides encountered in proteomic studies [10–12]. More importantly for our current purposes, the introduction of a cation-exchange interaction into a predominantly reversed-phase material can greatly enhance the retention of highly hydrophilic cations, including bio-active amines [13,14], drugs of abuse [14], water-soluble vitamins [13] and anthocyanins [15], that are not well retained and thus are poorly separated in RPLC.
Furthermore, the importance of having both ion-exchange and hydrophobic contributions to selectivity was studied on both octadecylsilane-bonded silica (ODS) phases [16–18] and a polybutadiene-coated zirconia (PBD–ZrO2) phase [16,18]. The ion-exchange sites on silica-based ODS phases are ionized silanol groups. For PBD-ZrO2 phase, the ion-exchange results from the adsorption of phosphate ions when phosphate containing buffers are used. Regardless of the very different surface chemistry of silica-based and zirconia-bases phases, the same two types of interactions, namely pure reversed-phase interaction and ‘‘hydrophobically assisted ion exchange’’, were found on both types of stationary phases [17,18]. More importantly the much higher contribution from the ‘‘hydrophobically assisted ion-exchange’’ process on PBD-ZrO2 relative to the reversed-phase interaction gave it radically different selectivity for basic analytes compared to various silica-based ODS phases [16].
Despite the many advantages of cation-exchange chromatography, its further development to meet the requirements of modern separations [e.g. high efficiency and mass spectrometry (MS) compatibility] is greatly challenged by difficulties in synthesizing high-efficiency cation exchangers. Cation exchangers are predominantly polymer-based [19] because of their good pH stability and the relative ease of introducing cation-exchange sites. However, the crosslinked organic polymer backbone generally gives poor efficiency caused by the slow mass transfer through the chromatographic beads and mechanical instability due to the swelling and shrinking upon variation in eluent, pressure and temperature [20,21].
Silica has several inherent advantages compared to polymers which make it the most popular substrate for HPLC stationary phases. The synthesis and/or size classification of silica particles is easily done to provide monodisperse particles of the desired pore size [22–24]. In addition, a large variety of silanes are available to modify silica’s surface through silanization and make different bonded phases [25,26]. The high mechanic strength and the high efficiency ensured by the fast mass transfer characteristics of bonded phases are also major advantages of silica-based stationary phases over polymer-based stationary phases [27–29]. Nevertheless, the biggest limitation of silica-based phases is their poor chemical stability. The utility of traditional silica-based stationary phases at extreme pHs is seriously limited by 1) the accelerated hydrolysis of siloxane bonds and the subsequent removal of bonded stationary phase at pH less than about 2 [30] and 2) the greatly accelerated dissolution of the silica substrate at pH > 8–9 [31]. Recently several new reversed phases show a quite wide range in pH (2–11) over which they are stable at least at moderate temperatures [32,33]. Chemical instability at low pH is more serious for silica-based ion exchangers. However, extreme pHs are sometimes indispensable in ion-exchange separations. For example, in the cation-exchange separations of pyridines and anilines (especially those with electron-withdrawing groups on the aromatic ring), the separations must be done under quite acidic conditions to ensure that the amines with low pKa are completely protonated. In addition, their chemical instability also makes it difficult to synthesize silica-based cation exchangers, which usually takes place under very harsh conditions [34–36]. For instance, silica-based strong cation exchangers with sulfonyl groups as the ion-exchange site can be prepared by three methods. In the first method, the stationary phase is sulfonated after the surface is silanized to bond phenyl groups to it. [34]. Serious losses of the bonded ligands occur during sulfonation due to the use of the strongly acidic conditions, such as concentrated sulfuric or chlorosulfonic acid to add the sulfonyl groups. In the second method, bare silica is reacted with sulfonated silanes [34]. Ligand cleavage is avoided; but as the cation exchanger prepared by the first method, the phase is very hydrophilic and has poor acid stability. In the third approach, sulfonyl groups are introduced to the surface by using polymer coating techniques [37,38], which can easily cause pore blockage and slow mass transfer [39].
A novel type of acid stable silica-based reversed phase was recently developed in our laboratory [40–43]. Orthogonal polymer forming reactions are used to prepare a very thin layer of hyper-crosslinked (HC) aromatic network that is entirely confined to the silica surface. Outstanding acid stability has been achieved due to the formation of extensively networked polymers. The new HC phases are much more stable than the most acid stable commercial silica-based phase, namely the “sterically protected” type C18 phases. At the same time, the excellent efficiency of bonded phases is preserved and no adverse effects from crosslinking have been observed.
In this paper, a novel type of silica-based, sulfonate-modified, reversed phase based on the previous HC reversed phase (HC-C8) will be described. The hyper-crosslinked aromatic network of HC-C8 is sulfonated with chlorosulfonic acid. The sulfonation degree can be easily controlled by adjusting the reaction temperature and a convenient low sulfonyl group surface coverage has been achieved by reaction at a low temperature (−61 °C). Unlike the sulfonation of a conventional, that is monomeric, bonded phenyl phase, no significant loss of bonded phase was observed upon use of the strong acid. The new sulfonated reversed phase shows excellent efficiency and a mixed-mode retention mechanism with the presence of both cation-exchange sites and hydrophobic interaction sites. Interesting selectivity difference, especially towards cationic solutes, was observed in characterization studies using Snyder’s method [44] and linear solvation energy relationships (LSERs) [45,46].
2. Experimental
2.1. Chemicals
Reaction reagents: chlorosulfonic acid (99%) was obtained from Aldrich (Milwaukee, WI, USA).
Reaction solvents: dichloromethane was obtained from Mallinkrodt (HPLC grade, Phillipsburg, NJ, USA) and dried by MB-SPS (Solvent Purification System from MBRAUN, Stratham, NH, USA) before use. ACS grade tetrahydrofuran (THF), acetone and HPLC-grade isopropanol (IPA) were also obtained from Mallinkrodt (Phillipsburg, NJ, USA).
HPLC buffers and solvents: Trifluoroacetic acid (TFA, ReagentPlus, 99%), ACS grade lithium chloride and potassium chloride were obtained from Aldrich, 50% formic acid and triethylamine hydrochloride (TEA.HCl) are HPLC-grade reagents from Fluka (Allentown, PA, USA). HPLC acetonitrile (MeCN) was obtained from Sigma-Aldrich (St. Louis, MO, USA). HPLC water was prepared by purifying laboratory-deionized water with a Barnstead Nanopure II deionizing system with an organic-free cartridge and run through an “organic-free” cartridge followed by a 0.45 µm Mini Capsule filter from PALL (East Hills, NY, USA).
HPLC solutes: morphine, hydromorphone, cathinone, ephedrine, 3,4-methylenedioxyamphetamine and methamphetamine were purchased from Cerilliant (Round Rock, TX, USA) as 1 mg/mL solutions of drug in methanol. All other chromatographic solutes were obtained from Aldrich or Sigma.
Silica substrate: type-B Zorbax silica particles and SB C18 particles were gifts from Agilent Technologies (Wilmington, DE, USA). The particle diameter, surface area, and pore diameter of the particles are 5.0 µm, 180 m2/g, and 80 Å respectively. The 5.0 × 0.46 cm Primesep 200 (5 µm, 100 Å) column was purchased from SIELC Technologies (Prospect Heights, IL, USA).
2.2. Synthesis of HC-C8 phase
RPLC phase HC-C8 was prepared by a series of three SnCl4 catalyzed Friedel-Crafts alkylations on Type B Zorbax silica that has been silylated with dimethyl chloromethylphenylethylchlorosilane. The detailed reaction conditions can be found in our previous publications [40].
2.3. Sulfonation of HC-C8 phase
A 3-g amount of HC-C8 was put into a 250 mL one-neck round-bottom flask and dried at 80 °C in a vacuum oven overnight and then cooled to room temperature under argon prior to use. Then, 117 mL of dry dichloromethane were transferred into the flask containing HC-C8 under argon protection. After sonicated for 10 min, the HC-C8 slurry sealed in the argon protected flask was immersed into the appropriate low temperature bath (MeCN/dry ice for −41 °C and chloroform/dry ice for −61 °C [47]). 19.5 mL of 0.75 M chlorosufonic acid dichloromethane solution prepared in a glove bag under argon protection was injected into the sealed stirring HC-C8 slurry, which had been cooled to the bath temperature. After 30 min of sulfonation, the reaction was quenched by injecting a large amount of ethanol into the slurry. Then, the sulfonated particles, named −SO3-HC-C8, were washed sequentially with 350 mL of dichloromethane, THF, H2O, IPA and acetone before being air dried overnight at room temperature. The −SO3-HC-C8 phase prepared at −41 °C had a relatively higher degree of sulfonation was designated −SO3-HC-C8-H and the −SO3-HC-C8 phase prepared at −61 °C with relatively a lower sulfonation degree was designated −SO3-HC-C8-L.
2.4. Acid pretreatment
After synthesis, the hyper-crosslinked phase −SO3-HC-C8 was pre-conditioned by gradient acid washing at 150 °C as described in our previous publications [40]. The purpose of this aggressive gradient acid washing is to remove tin(IV) contamination introduced during the Friedel-Crafts reactions, to hydrolyze residual chloromethyl groups and the labile Si-O-Si bonds to prevent their slow hydrolysis over time during use, and to eliminate incompletely crosslinked organic surface moieties.
2.5. Elemental analysis
A small amount of stationary phases after each step was sent for carbon, hydrogen, and chlorine analysis conducted by Atlantic Microlabs (Norcross, GA, USA). Sulfur analysis was also done after the sulfonation step.
2.6. Column packing
HC particles were packed into a 5.0 × 0.46 cm column for further characterization. The particles were slurried in IPA (1.0 g/8.0 mL) and sonicated for 20 minutes prior to packing. Columns were packed by the downward slurry technique using He gas to drive the pump and push IPA through the column. The packing pressure was increased from 3000 psi to 6000 psi within the first 5 seconds and then kept at 6000 psi until about 90 mL of solvent were collected before the pressure was released.
2.7. Characterization of the cation-exchange capacity
To determine the cation-exchange capacities of the −SO3-HC-C8 phases under the chromatographic conditions, a large amount of 50/50 MeCN/H2O with 0.1% formic acid and 5mM potassium chloride was first passed through the −SO3-HC-C8 column to saturate the cation-exchange sites with potassium ions. The potassium ions were then eluted with 50/50 MeCN/H2O containing 0.1% formic acid and 5mM lithium chloride. The first 25 mL or 10 mL of eluent flushed out of the column were collected for the −SO3-HC-C8-H and −SO3-HC-C8-L phases respectively. The amount of potassium ions in each of the collected eluents was determined by quantitative cation chromatography, using a Dionex ICS-2000 system equipped with a CS16 analytical column and a CMMS III suppressor. In addition, to eliminate the amount of free potassium ions not associated with cation-exchange sites in the void volume, uracil was injected to measure the void volumes of the two columns.
In order to keep the conditions for the determination of the cation-exchange capacity consistent with the chromatographic conditions in the study of the retention of basic compounds, the concentrations of acetonitrile (50%) and formic acid (0.1%) in the eluents were kept the same. Additionally, the use of 0.1% formic acid significantly reduced the contribution from residual silanols to the cation-exchange capacity, which allowed us to determine the cation-exchange capacity due to only the sulfonyl groups.
2.8. Chromatographic conditions
All chromatographic experiments were carried out on a Hewlett-Packard 1090 chromatography system, equipped with a binary pump, an autosampler, a temperature controller and a diode array detector (Hewlett-Packard, Wilmington, DE, USA). Data were collected and processed using Hewlett-Packard Chemstation software. The solutes were prepared in ca. 1 mM 50/50 MeCN/H2O solutions and the injection volume was 0.5 µL.
3. Results and Discussion
3.1. Elemental analysis
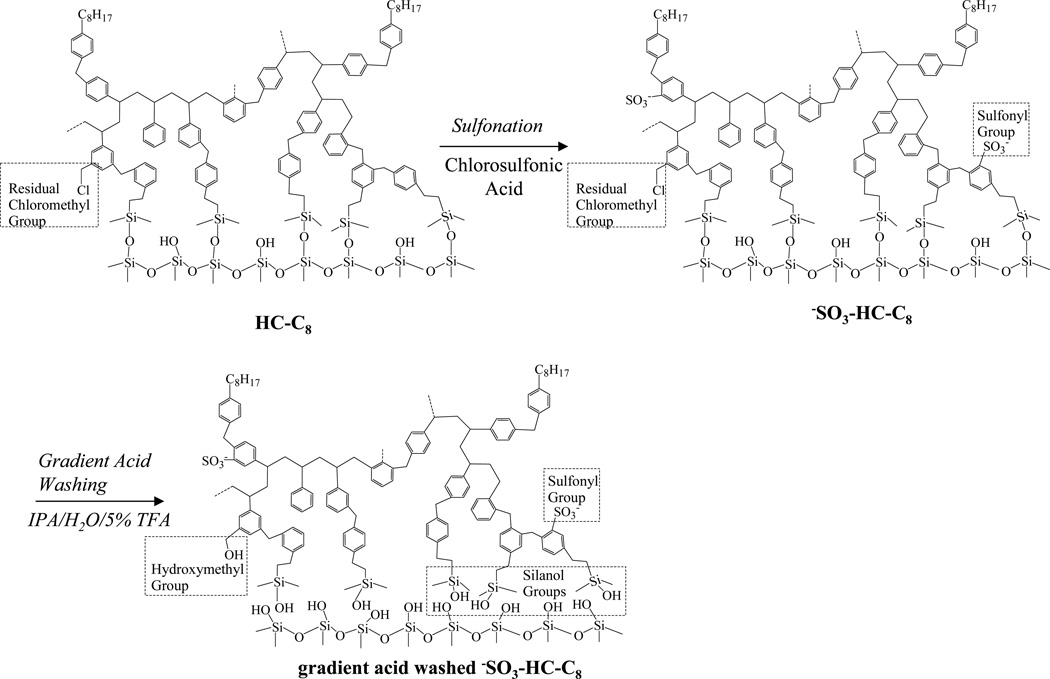
The synthesis scheme from the previously described [40] HC-C8 phase to the final −SO3-HC-C8 phase and the phase structure at each step are shown in Fig. 1. The product at each stage in the preparation was characterized by elemental analysis (see Table 1).
Fig. 1.
Synthesis scheme for the −SO3-HC-C8 phase
Table 1.
Summary of Elemental Analysis at Each Step in the Synthesis of the Various −SO3-HC-C8 Phases
| Step | Phase Designation | Elemental Analysis (wt/wt) | Surface Coverage (µmols/m2) |
||||
|---|---|---|---|---|---|---|---|
| %C | %Cl | %S | Octyl group |
Chloromethyl group |
Sulfonyl group |
||
| Starting Phase | HC-C8a | 11.48 | 0.63 | N/A | 0.9f | 1.1g | N/A |
| Sulfonation | −SO3-HC-C8-Hb | 10.99 | 0.53 | 0.53±0.3 | 0.9f | 0.9g | 1.1±0.6h |
| −SO3-HC-C8-Lc | 11.42* | 0.63 | <0.3e | 0.9f | 1.1g | NDi | |
| Gradient Acid Washing | −SO3-HC-C8-Lc after gradient acid washing | 11.13* | <0.25d | <0.3e | 0.9f | NDi | NDi |
HC-C8 phase prepared on Zorbax silica using SnCl4 as the Friedel-Crafts catalyst in the phase synthesis [38]
Phase with higher sulfonation degree obtained from sulfonating HC-C8 at −41 °C
Phase with lower sulfonation degree obtained from sulfonating HC-C8 at −61 °C
Detection limit is 0.25% (wt/wt)
Detection limit is 0.30% (wt/wt)
Surface coverage of octyl groups based on carbon analysis
Surface coverage of chloromethyl groups based on chlorine analysis
Surface coverage of sulfonyl groups based on sulfur analysis
Non-detectable
The weight %C decreases by only 3% after gradient acid washing. However, the retentions show significant decrease of 10% to 30% based on the k’ change of different solutes under various chromatographic conditions
As shown in Fig. 1, the HC-C8 phase has an extensive aromatic network completely confined to the particle surface; the network was generated by a series of two Friedel-Crafts reactions starting with silica that is silylated with dimethyl chloromethylphenylethylchlorosilane [40]. Approximately 0.9 ± 0.1 µmole/m2 of octyl groups are attached to the aromatic network through a third Friedel-Crafts alkylation [40]. In addition to the octyl groups, there are roughly 0.9–1.1 µmole/m2 of residual chloromethyl groups left in the aromatic network. These chloromethyl groups are ultimately converted to hydroxymethyl groups in the final phase pre-treatment step, gradient acid washing [40,48].
In sulfonating the HC-C8 phase, different amounts of sulfonyl groups could be introduced in the hydrophobic aromatic network by controlling the temperature at which sulfonation was carried out. At −41 °C, 1.1 ± 0.6 µmole/m2 of sulfonyl groups were added to the surface based on sulfur content analysis. The surface coverage of sulfonyl group can be significantly lowered by decreasing the sulfonation temperature. At −61 °C, the sulfonation degree becomes so low that the sulfur content is lower than the detection limit by elemental anaylsis. Given the large uncertainty and the high detection limit of the sulfur analysis, the cation-exchange capacities of −SO3-HC-C8 phases were determined by an ion-exchange approach and the results are discussed in section 3.2. After the synthesis was complete, the HC phases were extensively pretreated by “gradient” flushing (see the experimental section for details) at pH 0.5 and 150 °C to (1) remove tin(IV) that was left by the catalyst of the Friedel-Crafts reactions, SnCl4, (2) eliminate incompletely crosslinked organic surface moieties, (3) hydrolyze the siloxane bonds under the extensively crosslinked networks, and (4) convert residual chloromethyl groups to hydroxymethyl groups. We believe that these reactions happen slowly under normal chromatographic conditions and will cause gradual loss of some retention. These reactions must be driven to completion before the column is used. After the aggressive acid washing during the high temperature gradient pre-treatments, almost all the labile bonds and groups will be broken or reacted. Obviously this will greatly decrease the degree to which such processes can happen under normal separation conditions. Retention as measured by the k’ value decreased by 10% to 30% after gradient acid washing. In contradistinction, based on the change in the carbon content of the −SO3-HC-C8-L phase (see Table 1) there was only a minimal loss (3%) in the amount of bonded phase as a result of this very aggressive acidic washing procedure. This indicates that the decrease in retention is not due to a decrease in the phase ratio as it is for conventional, i.e. non-hyper-crosslinked phases, but is due to the modification of the stationary phase chemistry. Specifically, we believe it is primarily due to the hydrolysis of the siloxane bonds and chloromethyl groups. Similar trends have been observed with the HC-C8 phase [49]. This confirms the existence of hyper-crosslinked networks on silica surface [41]. Nearly all chlorine was removed after the high temperature acid treatment, which indicates that the chloromethyl groups were almost completely converted to hydroxymethyl groups during the treatment.
3.2. Characterization of cation-exchange capacity
The total amount of potassium ions eluted from the −SO3-HC-C8 columns and the column void volumes measured by uracil are listed in Table 2. The cation-exchange capacity Λ (µmole/m2) can be calculated through Eq. (1).
| (1) |
Table 2.
The Cation Exchange Capacity of the Various −SO3-HC-C8 Phases
Here NK and V0 are the amount of potassium ions eluted out of the column and the column void volume respectively. CK is the concentration of potassium ion in the void volume, which is equal to the concentration in the eluent (5 mM). The term A represents the specific surface area of the silica particles (180 m2/g) and w is the weight of the particles in the 5.0×0.46 cm column, which is assumed to be 0.5g.
As shown in Table 2, only very small numbers of ion-exchange sites were introduced into the HC-C8 phases upon sulfonation at the low temperatures. The cation-exchange capacity is no more than 0.5 µmole/m2 on the −SO3-HC-C8-H phase and is only approximately 0.1 µmole/m2 on the −SO3-HC-C8-L phase. The slight increase in cation-exchange capacity on −SO3-HC-C8-L phase after acid treatment (from 0.08 µmole/m2 to 0.11 µmole/m2) may be due to the additional silanol groups generated from siloxane bonds. It is of great importance to be able to control the ion-exchange capacity to a very low level (on the order of 1 µmole/m2 or less). Thus, the −SO3-HC-C8 phases are almost as hydrophobic as their parent phase HC-C8 and can be used and characterized as ordinary reversed phases.
3.3. Hydrophobic of the −SO3-HC-C8 phases
The hydrophobicity of a RPLC stationary phase is an important property which controls its overall retention in reversed-phase mode. A phase’s hydrophobicity can be evaluated based on the free energy of transfer of a methylene group from the stationary phase to the mobile phase [50]. A quantitative comparison of this free energy leads to a ranking of the hydrophobicities of different stationary phases. The free energy can be estimated via the following equation:
| (2) |
B is obtained by linear regression of log k’ against the number of CH2 groups in a homolog series by the use of the Martin equation:
| (3) |
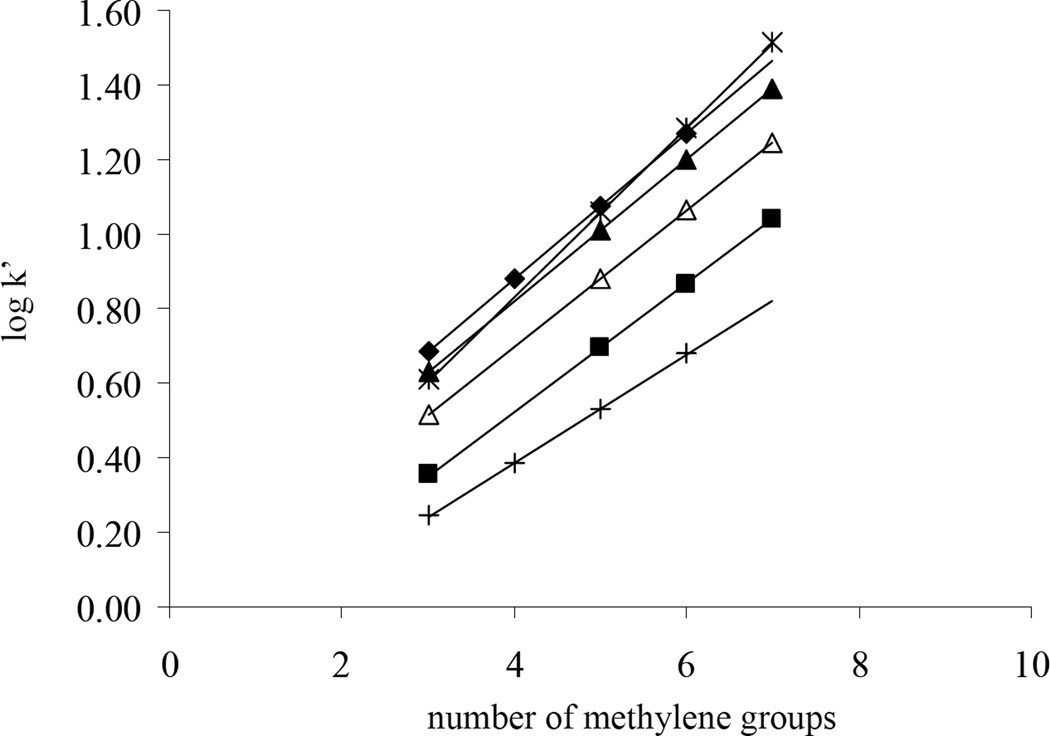
nCH2 is the number of methylene groups in a solute of a homolog series. The log k’ values were plotted against the nCH2 for alkylphenones on SB C18, Primesep 200 (a commercial silica-based mixed-mode phase), and different HC phases (see Fig. 2). The slopes, intercepts and free energies of transfer per methylene group for the various phases together with the correlation coefficients and standard errors of the regressions are listed in Table 3. Due to the presence of C18 chains, SB C18 shows a higher slope and thus a higher ΔG0CH2 than any of the HC phases. In addition, the HC phase’s hydrophobicity decreases upon the introduction of polar sulfonyl groups but it is only a very small change. With an additional 0.44 µmole/m2 of sulfonyl groups, the ΔG0CH2 of −SO3-HC-C8-H only decreases by approximately 12% compared to the HC-C8 phase; however, the −SO3-HC-C8-L phase with the much lower sulfonyl group surface coverage (~ 0.08 µmols/m2), shows an almost identical ΔG0CH2 to that of HC-C8. After gradient washing, the ΔG0CH2 of −SO3-HC-C8-L decreases a bit further as the result of the removal of isolated organic moieties and the hydrolysis of siloxane bonds and residual chloromethyl groups to more polar silanol and alcohol groups. After both sulfonation and gradient washing, −SO3-HC-C8-L still shows a rather high ΔG0CH2, which is around 80% of that of SB C18 and 94% of that of HC-C8. The retentions of the alkylphenone homolog solutes were also measured on a commercial mixed-mode phase, Primesep 200, which possesses both alkyl chains and negative charges on its surface. It is clearly shown in Fig. 2 and Table 3 that all of the −SO3-HC-C8 phases have higher ΔG0CH2 than Primesep 200 and therefore are more hydrophobic. As will be discussed in more detail subsequently, the high hydrophobicity of the −SO3-HC-C8 phases is very important for the separation of highly hydrophilic cations.
Fig. 2.
Plot of log k’ vs. number of methylene groups. Chromatographic conditions: 50/50 MeCN/H2O with 0.1% formic acid and 10mM TEA.HCl, 5.0×0.46 cm columns, T = 40 °C, F = 1.0 mL/min. Alkylphenone homolog solutes: butyrophenone, valerophenone, hexanophenone, heptanophenone and octanophenone. ∗: SB C18; ◆ HC-C8 before gradient washing; ▲ −SO3-HC-C8-L before gradient washing; △ −SO3-HC-C8-L after gradient washing; ■ −SO3-HC-C8-H before gradient washing; +: Primesep 200.
Table 3.
The Slopes and Intercepts of log k’ versus nCH2, and ΔG0CH2 Obtained on Different Stationary Phases
| Stationary phases | Gradient washing |
Slopea | Interceptb | R2c | S.E.d | ΔG0CH2e (cal·mol−1) |
|---|---|---|---|---|---|---|
| SB C18 | N/A | 0.226±0.0006 | −0.073±0.003 | 0.999985 | 0.0019 | −324±0.9 |
| HC-C8f | No | 0.195±0.0006 | 0.100±0.003 | 0.999980 | 0.0014 | −280±0.9 |
| −SO3-HC-C8-Hf | No | 0.172±0.0004 | −0.163±0.002 | 0.999991 | 0.0011 | −246±0.5 |
| −SO3-HC-C8-Lf | No | 0.189±0.0001 | 0.0638±0.0006 | 0.999999 | 0.00034 | −271±0.2 |
| −SO3-HC-C8-Lf | Yes | 0.183±0.0002 | −0.0327±0.001 | 0.999997 | 0.00070 | −262±0.3 |
| Primesep 200g | N/A | 0.145±0.0007 | −0.194±0.003 | 0.999952 | 0.0016 | −208±1.0 |
The slope of the linear regression of log k’ vs. nCH2 based on the data in Fig. 2.
The intercept of the linear regression of log k’ vs. nCH2 based on the data in Fig. 2.
The squared correlation coefficient of the linear regression of log k’ vs. nCH2 based on the data in Fig. 2.
The standard error of the linear regression of log k’ vs. nCH2 based on the data in Fig. 2.
The free energy of transfer per methylene group calculated from Eq. (2) using the corresponding slope given in Table 3.
Phase designation is the same as in Table 1.
A commercial mixed mode phase (SIELC Technologies, Prospect Heights, IL)
We next examine the intercept A of Eq. (3). The intercept of the plot depends upon the phase ratio and the extrapolated retention of the alkylphenones series at nCH sequals to zero. This is equivalent to the k’ of benzaldehyde. As shown in both Fig. 2 and Table 3, the intercept decreases upon sulfonation and the gradient washing. The most significant intercept decrease (from 0.100 to −0.163) was observed when 0.44 µmole/m2 of sulfonyl groups were introduced into the parent HC-C8 phase to make the −SO3-HC-C8-H phase. Since it is very unlikely that the phase ratio changes significantly after sulfonation or gradient washing, the most probably reason for the decrease of the intercept is the decrease in the retention of hypothetical species corresponding to the intercept, i.e. benzaldehyde, due to the introduction of polar groups into the aromatic HC networks by either sulfonation or gradient washing (silanol and benzylic hydroxyl groups).
3.4. Hydrophobically assisted cation exchange on −SO3-HC-C8 phases
According to the “three-site” model for a mixed-mode retention mechanism of basic compounds on RPLC [17,18,51–53], the total retention of a basic compound is the sum of the reversed-phase retention k’RP, pure ion-exchange retention k’Pure, IEX, and hydrophobically assisted ion-exchange retention k’RP, IEX as indicated in Eq. (4).
| (4) |
Based on the stoichiometric displacement model [1], for equally charged analyte and displacer, the ion-exchange retention is inversely proportional to the concentration of the displacer in the mobile phase. For a singly charged analyte and displacer, Eq. (4) can be extended to Eq. (5), where [C+]m represents the concentration of the displacer in the mobile phase.
| (5) |
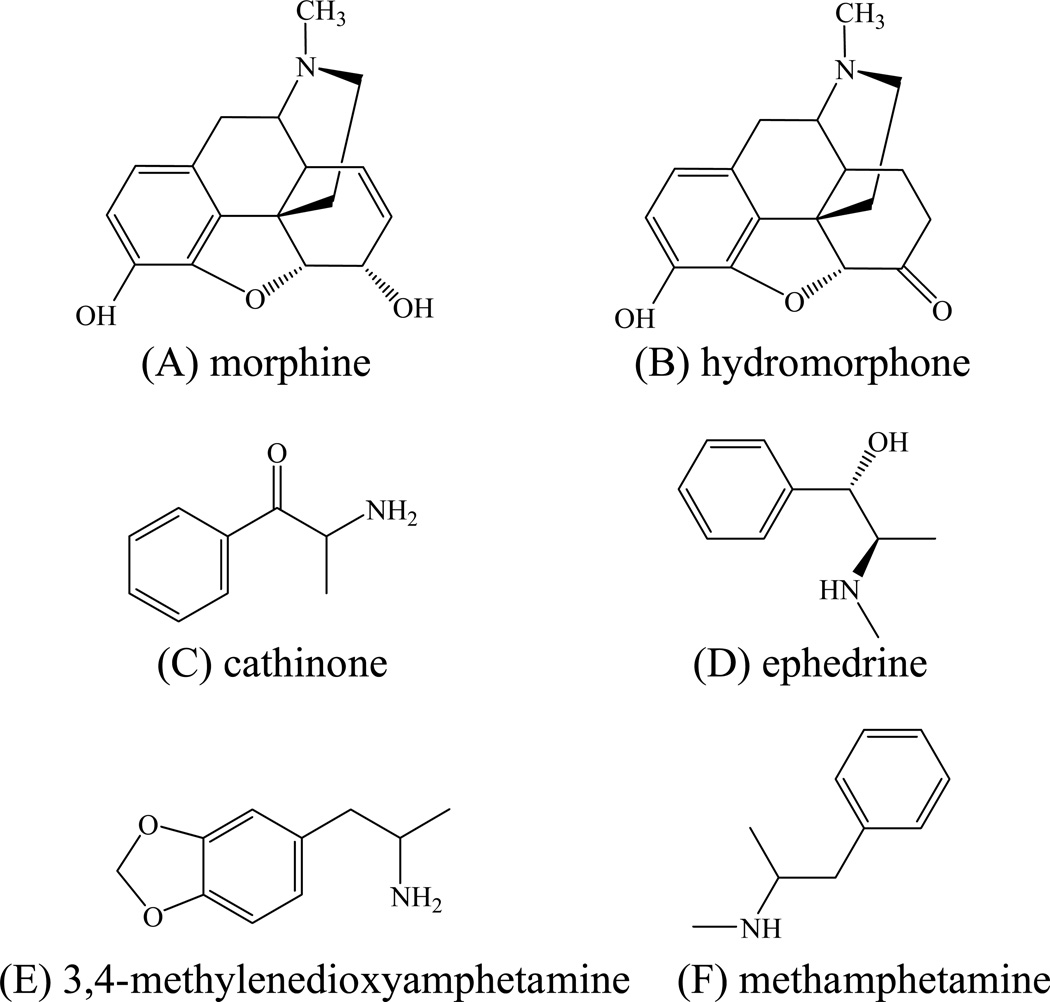
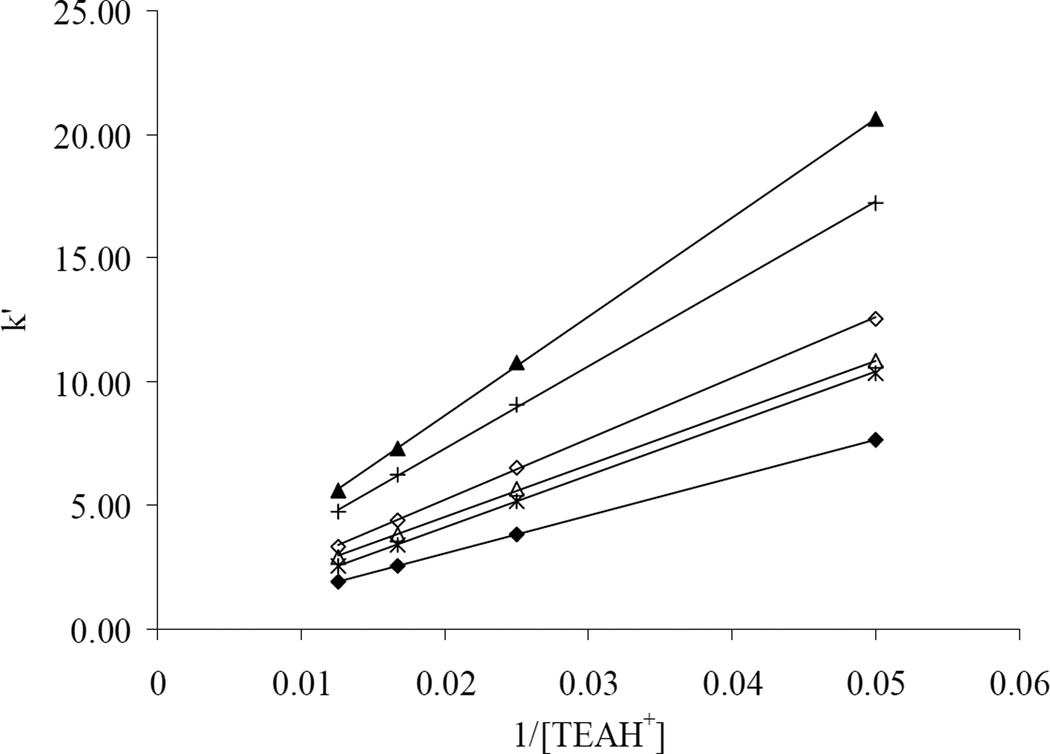
Here k’total is linearly related to 1/[C+]m. The intercept k’RP, is an “ion-exchange-free” contribution to retention since it corresponds to the k’ at infinite displacer concentration, and the slope BIEX, is proportional to the overall strength of the ion-exchange interaction including both pure ion exchange and hydrophobically assisted ion exchange. The linear relationship between the k’ of basic compounds (see Fig. 3 for the compound structures) and 1/[C+]m based on Eq. (5) as observed on −SO3-HC-C8 phases is shown in Fig. 4, where the protonated triethylamine (TEAH+) was used as the displacer and the data obtained on −SO3-HC-C8-H are shown as examples. Choosing TEAH+ as the displacement cation was originally based on its high volatility and strong cation-exchange ability to be used at low concentrations, which makes the mobile phase more LC-MS friendly. In addition, TEAH+ provided good peak shape for the basic compounds studied.
Fig. 3.
The structures of the basic solutes used in the ion-exchange study
Fig. 4.
Plot of k’ vs. 1/[TEAH+] on −SO3-HC-C8-H. Chromatographic conditions: 50/50 MeCN/H2O with 0.1% formic acid and 20, 40, 60 or 80 mM TEA.HCl, 5.0×0.46 cm column, T = 40 °C, F = 1.0 mL/min. Cationic solutes: ◆: morphine; ∗: hydromorphone; △: cathinone; ◇: ephedrine; +: 3,4-methylenedioxyamphetamine; ▲: methamphetamine.
The reversed-phase and ion-exchange contributions to the total retention at different displacer concentrations can be further separated using Eq. (5) by applying the BIEX and k’RP values obtained from the linear regression of k’ vs. 1/[TEAH+]. . The percent contributions of cation exchange to retention on the different phases as a function of the TEAH+ concentration are listed in Table 4. Over a very wide range of retentions on all three sulfonated phases, cation-exchange interactions predominate (> 80%) and play a more important role at lower displacer concentrations and for the more retained cations under the chromatographic conditions studied here.
Table 4.
The Total Retention and the Percent Cation Exchange Contribution on −SO3-HC-C8 Phases
| Stationary Phases |
Gradient Washing |
[TEAH+] (mM) |
Retention | Solutesc | |||||
|---|---|---|---|---|---|---|---|---|---|
| A | B | C | D | E | F | ||||
| −SO3-HC-C8-H | No | 120 | k’totala | 1.26 | 1.67 | 2.07 | 2.38 | 3.43 | 3.98 |
| %k’IEXb | 100d | 100d | 85 | 86 | 81 | 84 | |||
| 12 | k’totala | 12.82 | 17.35 | 17.87 | 20.75 | 28.36 | 33.94 | ||
| %k’IEXb | 100 | 100 | 98 | 98 | 98 | 98 | |||
| −SO3-HC-C8-L | No | 20 | k’totala | 1.29 | 1.91 | 2.04 | 2.38 | 3.17 | 3.92 |
| %k’IEXb | 91 | 87 | 83 | 83 | 80 | 81 | |||
| 2 | k’totala | 11.86 | 16.85 | 17.29 | 20.23 | 26.05 | 32.51 | ||
| %k’IEXb | 99 | 99 | 98 | 98 | 98 | 98 | |||
| −SO3-HC-C8-L | Yes | 20 | k’totala | 1.03 | 1.50 | 1.57 | 1.83 | 2.38 | 2.87 |
| %k’IEXb | 100d | 95 | 94 | 92 | 89 | 90 | |||
| 2 | k’totala | 10.51 | 14.33 | 14.81 | 17.03 | 21.51 | 26.10 | ||
| %k’IEXb | 100 | 100 | 99 | 99 | 99 | 99 | |||
The total retention at different [TEAH+ ] calculated from Eq. (5) using the BIEX and k’IEX obtained from the linear regression of k’ vs. 1/[TEAH+]
The percentage of cation exchange contribution to the total retention at different [TEAH+] calculated from Eq. (5) using the BIEX and k’IEX obtained from the linear regression of k’ vs. 1/[TEAH+]
Solutes: A: morphine; B: hydromorphone; C: cathinone; D: ephedrine; E: 3,4-methylenedioxyamphetamine; F: methamphetamine (see Fig. 3 for the compound structures)
A percentage slightly higher than 100% is obtained because k’RP is a small negative value, which could be caused by either the error of the linear regression or the very small retention of the dead time marker uracil.
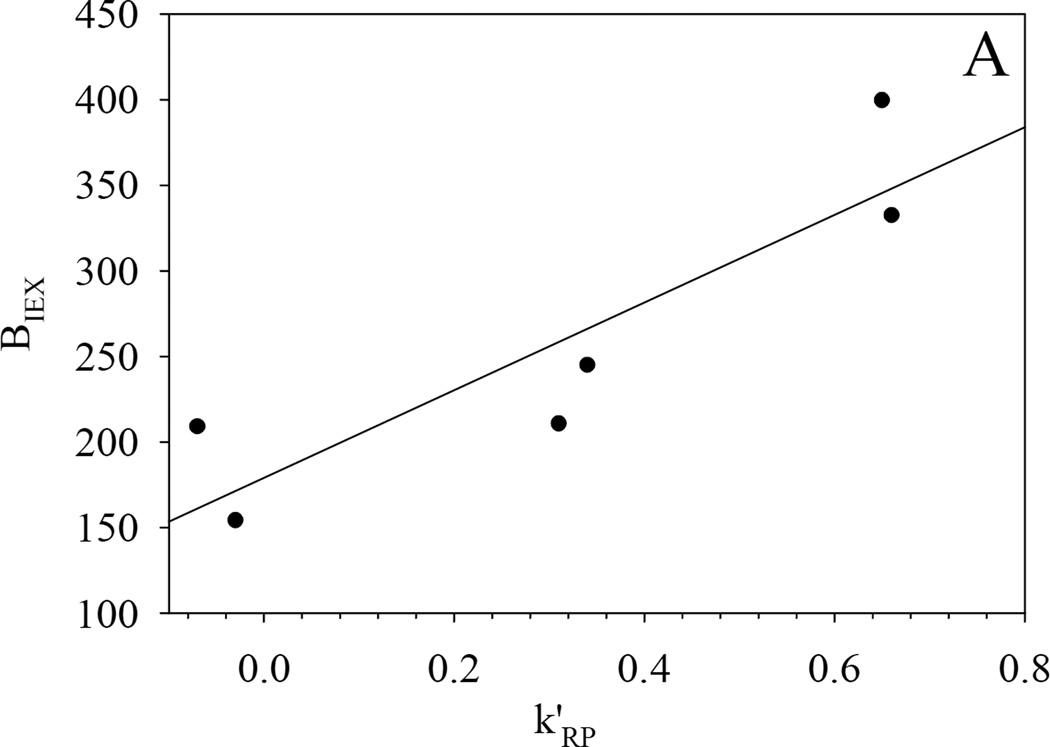
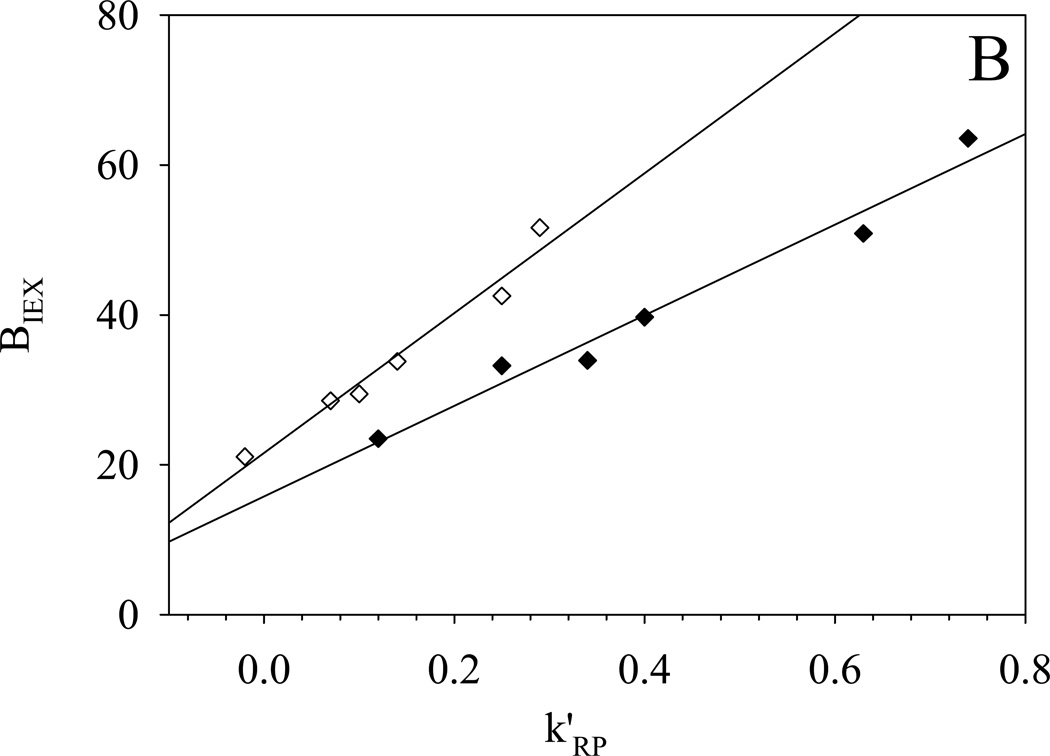
More importantly the hydrophobic assistance to ion exchange is clearly evident in the correlation between the two parameters k’RP and BIEX (see Fig. 5); this is very similar to what we observed previously on silica-based Alltima ODS and PBD-ZrO2 phases [18]. Ionized silanol groups and dynamically adsorbed phosphate groups on zirconia serve as the cation-exchange sites for Alltima ODS and PBD-ZrO2, respectively. Based on the three-site model developed in our lab [18], the slope and intercept of BIEX versus k’RP are proportional to the numbers of the hydrophobically assisted ion-exchange site and pure ion-exchange site respectively under the examined chromatographic conditions. For the Alltima ODS phase, the BIEX values at the intercepts of the plots were close to zero which implies that almost no “pure” ion-exchange site exits on the reversed phase. However, finite intercepts, i.e BIEX values, were observed on all three −SO3-HC-C8 phases (see Fig. 5). The highly sulfonated phase, −SO3-HC-C8-H gives an intercept as high as 180 and the low sulfonated phase, −SO3-HC-C8-L shows an almost equal intercept of 20 before and after gradient washing. This significant difference from the previously studied reversed phases suggests that −SO3-HC-C8 phases have much larger numbers of pure ion-exchange sites and consequently much higher retentions are expected for completely nonhydrophobic cations on these sulfonated phases. This is deemed very important as it will provide a reasonable amount of retention for even the most hydrophilic organic cations. In addition, both the intercept and the slope were found to be much higher on −SO3-HC-C8-H compared to −SO3-HC-C8-L, as should be the case given its higher level of sulfonation and therefore larger numbers of both hydrophobically assisted and pure ion-exchange sites.
Fig. 5.
-
●: −SO3-HC-C8-H phase before gradient washing (50% MeCN):
- BIEX=179±28+256±65Xk’RP R2=0.79 S.E. = 46 (n = 6)
-
◆: −SO3-HC-C8-L phase before gradient washing (50% MeCN):
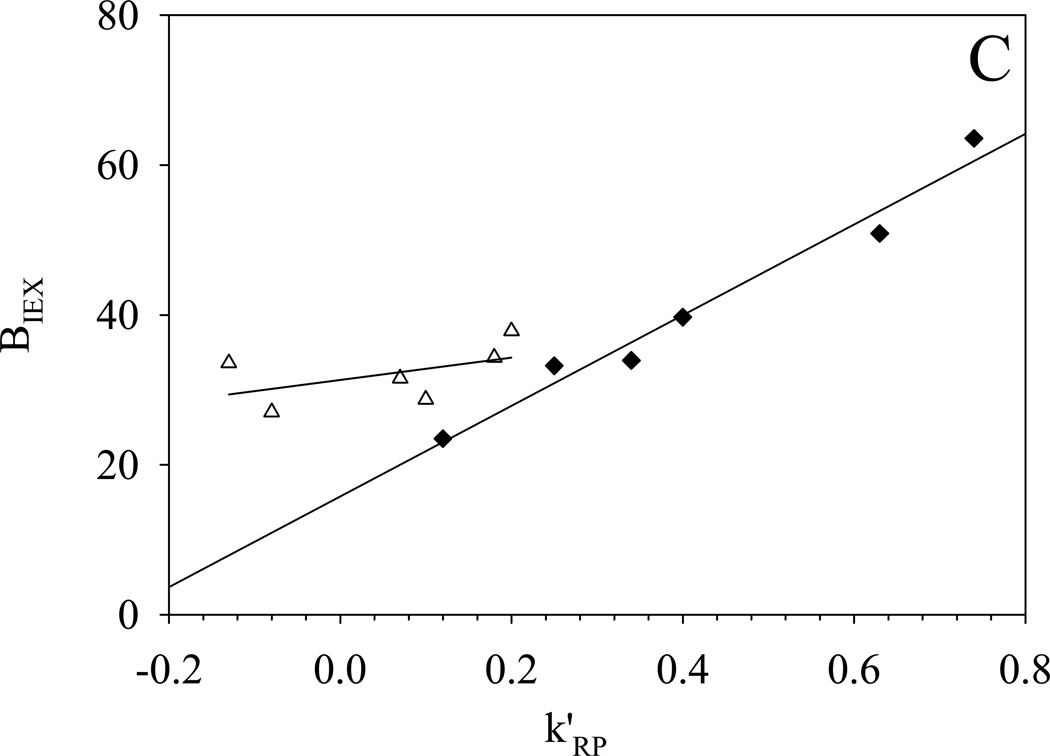
- BIEX=16±2+61±5Xk’RP R2=0.97 S.E. = 2.7 (n = 6)
-
◇: −SO3-HC-C8-L phase after gradient washing (50% MeCN):
- BIEX=22±2+93±9Xk’RP R2=0.97 S.E. = 2.2 (n = 6)
-
△: −SO3-HC-C8-L phase before gradient washing (80% MeCN):
- BIEX=31±2+15±12Xk’RP R2=0.26 S.E. = 3.8 (n = 6)
As shown in Fig. 5B, gradient washing of −SO3-HC-C8-L leads to a decrease in both BIEX and k’RP. The decrease can be explained by the hydrolysis reactions involved in the washing as discussed in sections 3.1 and 3.3, which can reduce hydrophobicity and thus the closely related BIEX and k’RP. At the same time, BIEX became more dependent on k’RP as indicated by the higher slope. This increased contribution of hydrophobically assisted ion exchange might result from an increase in the number of the silanol groups generated during gradient washing (see Table 2). Although the reason for this change in the dependence is not very clear, the separation selectivity of basic compounds in a retention mechanism dominated by ion exchange should be improved by the hydrophobic contribution to selectivity evident in the relationship between BIEX and k’RP.
The importance of hydrophobic assistance is clearly shown in Fig. 5C, where BIEX and k’RP measured at 50% and 80% acetonitrile are compared. For any compound, both k’RP and BIEX decreased as the acetonitrile concentration was increased resulting from the reduced hydrophobic interaction and reduced hydrophobic assistance respectively. The plot also shows that the range in k’RP and BIEX among the solutes is much smaller at 80% as compared to 50% acetontrile. Clearly, selectivity will be lower at 80% acetonitrile. In addition, we also noticed a small increase in the intercept of the plot of BIEX versus k’RP with the increase of acetonitrile composition. This could result from (1) an increase in the strength of the pure ion-exchange interaction or (2) some of the hydrophobically assisted ion-exchange sites became pure ion-exchange sites at the higher acetonitrile concentration. For equally charged solutes, the increase in pure ion-exchange retention can not improve the selectivity, but only contributes to the overall retention. As a conclusion, hydrophobic interaction superimposed on ion exchange is the key factor to provide high selectivity for different basic compounds on the −SO3-HC-C8 phases.
3.5. The Comparison of −SO3-HC-C8 Phases and Other RPLC Phases by Snyder’s Reversed-Phase Characterization Method
Snyder et al. developed the “hydrophobic subtraction method” to assess and compare the selectivity of RPLC stationary phases; it uses a set of 16 judiciously selected probe solutes [44,54–60]. In this method, the relative retention of a given solute k’/k’EB can be dissected into contributions from various types of intermolecular interactions as expressed in Eq. (6).
| (6) |
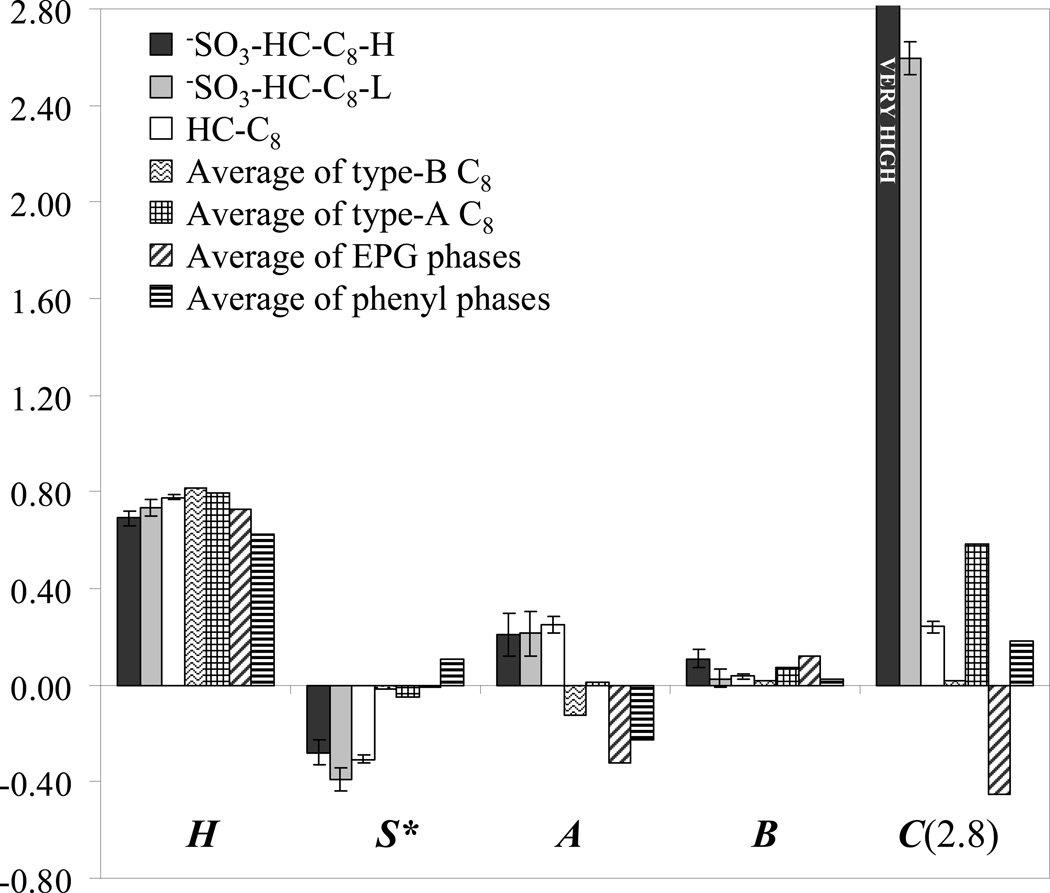
k’EB is the retention factor of the nonpolar reference solute ethylbenzene. (i)–(v) designates the major types of interaction attributed to the retention difference and they are hydrophobic interactions (i), steric resistance to insertion in the modified surface (ii), hydrogen bonding (iii)–(iv), and coulombic interaction (v). H, S*, A, B, and C are the column selectivity parameters which denote hydrophobicity, steric resistance to bulky molecules, hydrogen-bond acidity, hydrogen-bond basicity and coulombic interaction, respectively.η’, σ’, β’, α’ and κ’ are the corresponding solute properties. This method has been proved very useful in the characterization and classification of more than 300 reversed phases of different types. The new sulfonate-modified reversed-phase −SO3-HC-C8 phases and the parent HC-C8 phase were characterized by this method and the resulting column parameters together with the average data of a few relevant commercial phases are listed and compared in Fig. 6. As indicated by the regression results (see the caption of Fig. 6), the two −SO3-HC-C8 phases showed excellent fits using Synder’s reversed-phase characterization method. The squared correlation coefficients are very close to one and the corresponding standard errors are quite small.
Fig. 6.
| HC-C8 (after gradient washing) | R2 = 0.999; S.E. = 0.022 |
| −SO3-HC-C8-L (after gradient washing) | R2 = 0.995; S.E. = 0.060 |
| −SO3-HC-C8-H (before gradient washing) | R2 = 0.990; S.E. = 0.059 |
Chromatographic conditions: 50/50 MeCN/60mM phosphate buffer (pH = 2.8), T = 35 °C, F = 1.0 mL/min
We see from the results in Fig. 6, the hydrophobicity (represented by H) follows the order: phenyl phase < −SO3-HC-C8-H < EPG ~ −SO3-HC-C8-L < HC-C8 < type-A C8 < type-B C8. The phenyl phase shows the lowest H due to the absence of hydrophobic alkyl chains. The lower H of our HC phases compared to the average H of commercial C8 phases (on either type-A or type-B silica) results from the relatively lower C8 surface density: approximately 0.9 µmole/m2 versus the typical surface density of 2–3 µmole/m2 on commercial C8 phases. Comparing the H of the three HC phases, the hydrophobicity is reduced upon the introduction of polar sulfonyl groups, which is consistent with the results of section 3.2. More decrease in H is observed with the higher degree of sulfonation. −SO3-HC-C8-L exhibits a hydrophobicity close to the average hydrophobicity of the phases with embedded polar groups (EPG).
By comparing the steric resistance, i.e. the S* coefficients in Fig. 6, we see that all three of the HC phases show the most negative values. This means that the marker compounds for S* are more strongly retained on the HC phases than on conventional RPLC phases. According to Eq. (6), this result indicates that the HC phases have much lower steric resistance than all the other phases investigated by Snyder [44,54–60]. The very low steric resistance on our HC phase is probably caused by the rather low surface density of C8 chains (approximately 0.9 µmole/m2 versus a typical 2–3 µmole/m2). However, we also noticed that the two solutes which are major determinants of S*, cis-and trans-chalcone, have high aromaticity. From the phase structures shown in Fig. 1, we can see that our HC phases possess a large aromatic portion. Therefore, it is very possible that strong π-π interactions (not included in Eq. (6)) might also contribute significantly to the high retention of the two chalcones and consequently lead to the very negative S*.
After the post synthesis gradient washing there are two types of active hydrogen bond donors present, namely the silanol groups released upon siloxane bond breaking and hydroxymethyl groups generated from the hydrolysis of residual chloromethyl groups. Therefore, the gradient washed HC-C8 and −SO3-HC-C8-L phases show the highest hydrogen bond acidities of all phases tested (see the A coefficients in Fig. 6). In addition, the −SO3-HC-C8-H phase before gradient washing also exhibits high hydrogen bond acidity which is comparable to those of the above two gradient washed HC phases. This may be caused by the presence of hydroxymethyl groups that resulted after prolonged use from residual chloromethyl groups.
The hydrogen bond basicity (B coefficient) of HC-C8 and −SO3-HC-C8-L are similar to the average B values of commercial C8 and phenyl phases. However, the HC phase with a higher sulfonation degree, −SO3-HC-C8-H, shows a much higher B and it is even comparable to the average B of the EPG phases. According to Snyder, the B coefficient is postulated to be closely related to adsorbed water on the stationary phase [44,54–60]. Thus, the relatively high hydrogen bond basicity of −SO3-HC-C8-H may be caused by the sulfonyl groups themselves and the increased adsorption of water into the bonded phase resulting from the higher degree of sulfonation.
In Fig. 6, we see very high C coefficients for sulfonated phases even at a pH of 2.8. On −SO3-HC-C8-H, the two basic compounds (nortriptyline and amitriptyline) were so strongly retained that their retention could not be measured under Snyder’s experimental conditions. Due to the lack of the data of the two major C determinants, the C coefficient of −SO3-HC-C8-H could not be calculated. However, it should be a very high value because of the presence of about 0.44 µmole/m2 sulfonyl groups. Even for −SO3-HC-C8-L with a much lower surface coverage of sulfonyl groups, the C(2.8) is still as high as 2.6.
We further compared the selectivity of the −SO3-HC-C8-L phase with all the reversed phases studied by Snyder (more than 300 phases) using the column comparison function Fs [57]. Extraordinary high Fs values were found in all the comparisons. The average Fs is 558. −SO3-HC-C8-L shows the most different selectivity from phases that have very negative C(2.8), such as EC Nucleosil (C(2.8) = −3.2; Fs = 2840). Only three zirconia-based phases (ZirChrom-PBD, ZirChrom-PS and ZirChrom-EZ) and three type-A silica-based C18 phases (Apex II C18, Resolve C18 and Supelcosil LC-18) with C(2.8) higher than 1.5 show Fs values lower than 100. The high C coefficients of zirconia-based phases and type-A silica-based phases are due to the adsorption of phosphate under the testing chromatographic conditions and the ionization of highly acidic silanols on type-A silica substrate respectively. Even for the above phases showing the most similar selectivity to −SO3-HC-C8-L, the Fs values are still higher than 38, which means significant difference in selectivity exist between the −SO3-HC-C8-L phase and these other phases.
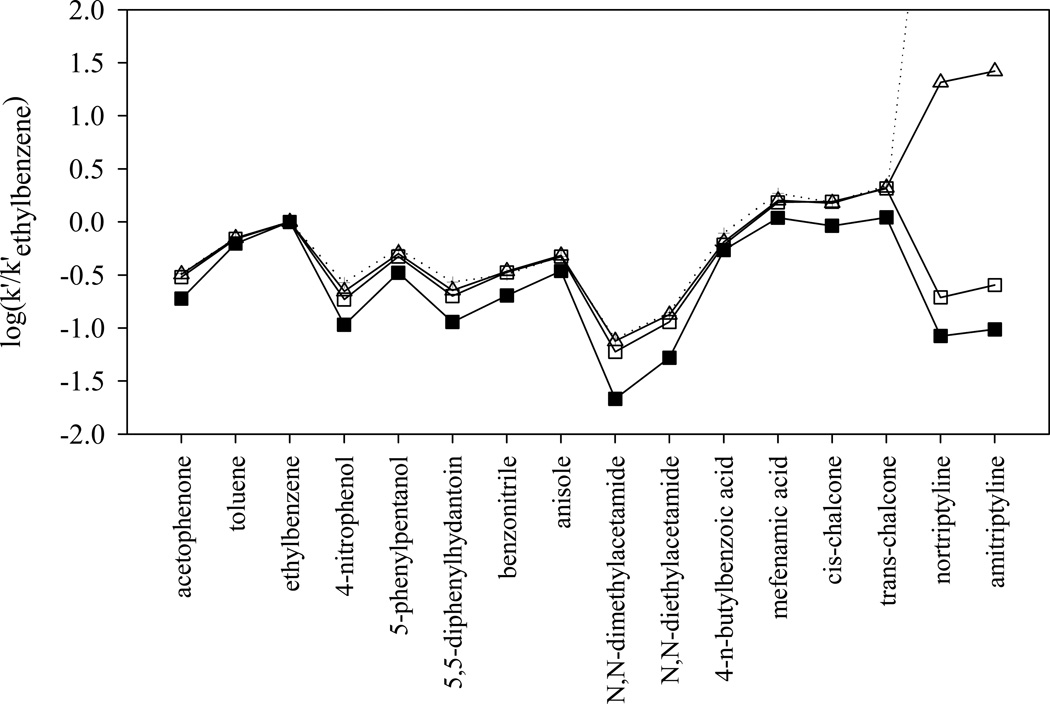
The very high cation-exchange activity of the sulfonated phase is also clearly shown in Fig. 7, where the logarithm of the normalized retentions (k’/k’EB) of SB C18 phase and the three HC phases are plotted. The first 14 solutes on the left of the plot are either non-electrolytes or acids that are almost completely protonated at pH 2.8. These uncharged solutes show very similar retention trend on the four columns tested. The three HC phases are almost overlapped due to the similarities in the reversed-phase properties that govern the retention of the 14 uncharged solutes. The most significant difference occurs in the retention of the two basic compounds: nortirptyline and amitriptyline. They are substantially more retained on the two sulfonated phases. This strong cation-exchange activity of −SO3-HC-C8 phases provides very different selectivity from other reversed phases especially toward complex mixtures of high diversity with charged species, which will be discussed in more details in our next paper.
Fig. 7.
The log (k’/k’ethylbenzene) of the 16 solutes in Snyder’s phase characterization method [58] on different phases. Chromatographic conditions are the same as in Fig. 6. ■: SB C18; □: HC-C8; △: −SO3-HC-C8-L after gradient acid washing; + and dotted line: −SO3-HC-C8-H before gradient acid washing (nortriptyline and amitriptyline are strongly retained and not eluted in a reasonable time).
3.6. The comparison of −SO3-HC-C8 phases and other RPLC phases in LSER study
The non-electrolyte selectivity of weakly sulfonated phase −SO3-HC-C8-L after gradient washing was further characterized by linear solvation energy relationship (LSER) [45,46,61–65]. In this method, the relationship between the free energy of retention and the various fundamental types of energy change involved in the solute distribution equilibrium between the stationary phase and mobile phase is expressed by the following equation.
| (7) |
In Eq. (7), V2, π2*, Σα2H, Σβ2H, and R2 are five molecular descriptors. V2 is the computed molecular volume [66]; π2* stands for solute dipolarity/polarizability; Σα2H and Σβ2H represent the solute’s overall hydrogen-bond acidity and basicity respectively; and R2 is its excess molar refraction. Twenty-two chromatographic solutes [61] were judiciously chosen from a much larger set of solutes [62] to characterize the chromatographic system by five coefficients, v, s, a, b, and r. The five coefficients of the chromatographic system are complimentary to the above five solute descriptors: v represents the systems cohesiveness/dispersiveness; s is determined by its dipolarity/polarizability; a and b represent the hydrogen bond acceptor basicities and hydrogen bond donor acidities respectively; r is related to the π- and n-electron interactions between the system and the solute [67]. The rR2 term is a “correction” term that accounts for the inadequacy of lumping dipolarity and polarizability into a single term sπ2* and the regression intercept log k’0 is associated with the phase ratio. The chemical meaning of these terms are very clearly and definitively elucidated in a recent review [64]. The five chromatographic system coefficients are determined by the corresponding property differences between the stationary phase and the mobile phase. For the same mobile phase, the properties of the stationary phases can be indicated by the five coefficients that are calculated from the multi-variable linear regression of Eq. (7) using the solute descriptors of the 22 compounds [61].
The coefficients of the different stationary phases of interest are listed in Table 5. Unlike the other RPLC phases characterized using unbuffered 50/50 MeCN/water in the LSER study, −SO3-HC-C8-L was tested in 50/50 MeCN/water with 0.02% (v/v) TFA to ensure that the charged surface is adequately buffered and all the sulfonyl groups are balanced by protons. The standard deviations for each regression coefficient, the standard error (S.E.) and the squared correlation coefficient R2 of the whole regression are comparable to the fitting results of the reversed phase HC-C8 and other commercial reversed phases, demonstrating the applicability of LSER theory on this special sulfonate-modified reversed phase.
Table 5.
LSER Coefficients on Different Stationary Phases in 50/50 MeCN/H2O
| Stationary Phase | log k’0a | LSER Coefficients | R2b | S.E. c | ||||
|---|---|---|---|---|---|---|---|---|
| v | s | a | b | r | ||||
| HC-C8d,e,f | −0.33 ±0.06 | 1.27 ±0.07 | −0.16 ±0.05 | −0.58 ±0.05 | −1.48 ±0.07 | 0.20 ±0.06 | 0.991 | 0.04 |
| −SO3-HC-C8-Ld,e,g | −0.47 ±0.05 | 1.22 ±0.06 | −0.14 ±0.04 | −0.55 ±0.04 | −1.42±0.06 | 0.20 ±0.06 | 0.991 | 0.04 |
| Zorbax C8f,h | −0.25 ±0.05 | 1.41 ±0.06 | −0.27 ±0.05 | −0.42 ±0.05 | −1.61 ±0.07 | 0.02 ±0.06 | 0.993 | 0.04 |
| PRPf,h | 0.03 ±0.07 | 1.35 ±0.08 | −0.39 ±0.06 | −0.94 ±0.06 | −1.89 ±0.08 | 0.48 ±0.07 | 0.994 | 0.05 |
| Phenylf,h | −0.22 ±0.06 | 0.83 ±0.07 | −0.15 ±0.05 | −0.34 ±0.05 | −0.99 ±0.07 | 0.09 ±0.07 | 0.980 | 0.04 |
The intercept of the regression of Eq. (7)
The squared correlation coefficient of the regression of Eq. (7)
The standard error of the regression of Eq. (7)
Phase designation is the same as in Table 1
HC phase after gradient washing
Chromatographic conditions: 50/50 MeCN/H2O, T = 30 °C, other chromatographic conditions see reference [61,65].
Chromatographic conditions: 50/50 MeCN/ H2O with 0.02% TFA, T = 30 °C, F = 1.0 mL/min.
The cohesiveness/dispersiveness coefficient ν combined with the molecular volume of the solute V2 (as shown in Eq. (7)) plays a dominant role in non-electrolyte retention. As shown in Table 5, the v coefficient follows the order of Phenyl < −SO3-HC-C8-L < HC-C8 < PRP < Zorbax C8, which agrees very well with the order of hydrophobicity coefficient H in Snyder’s method (see section 3.5).
For all the five stationary phases studied, the second most significant contributor to the non-electrolyte retention is the hydrogen bond acidity represented by the b coefficient. The b coefficient of −SO3-HC-C8-L is very close to that of HC-C8 and much more positive than those of Zorbax C8 and PRP. This higher hydrogen bond acidity on HC phases compared to Zorbax C8 and PRP is consistent with the results of Snyder’s method in section 3.5 and can be attributed to the relatively higher surface density of silanol groups and the presence of hydroxymethyl groups after gradient washing.
The increased importance of π-π interactions on our HC phases compared to conventional aliphatic phases (Zorbax C8, r = 0.02) and even aromatic phases (Phenyl, r = 0.09) is clearly demonstrated by the higher r coefficients (r = 0.20). The r coefficients of −SO3-HC-C8-L and HC-C8 are almost identical to each other considering the errors, and are only lower than the r coefficient of the highly aromatic PRP phase (r = 0.48). The rather high r coefficients of our HC phases result from the hyper-crosslinked aromatic network.
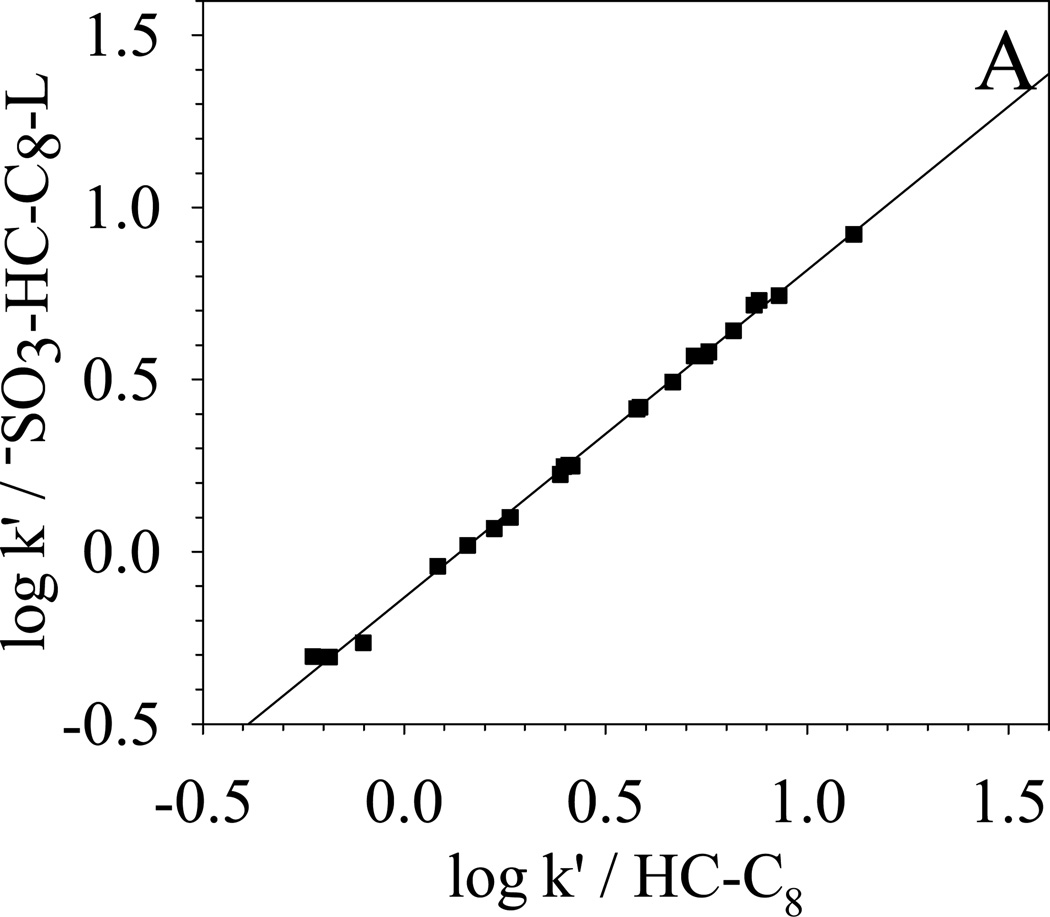
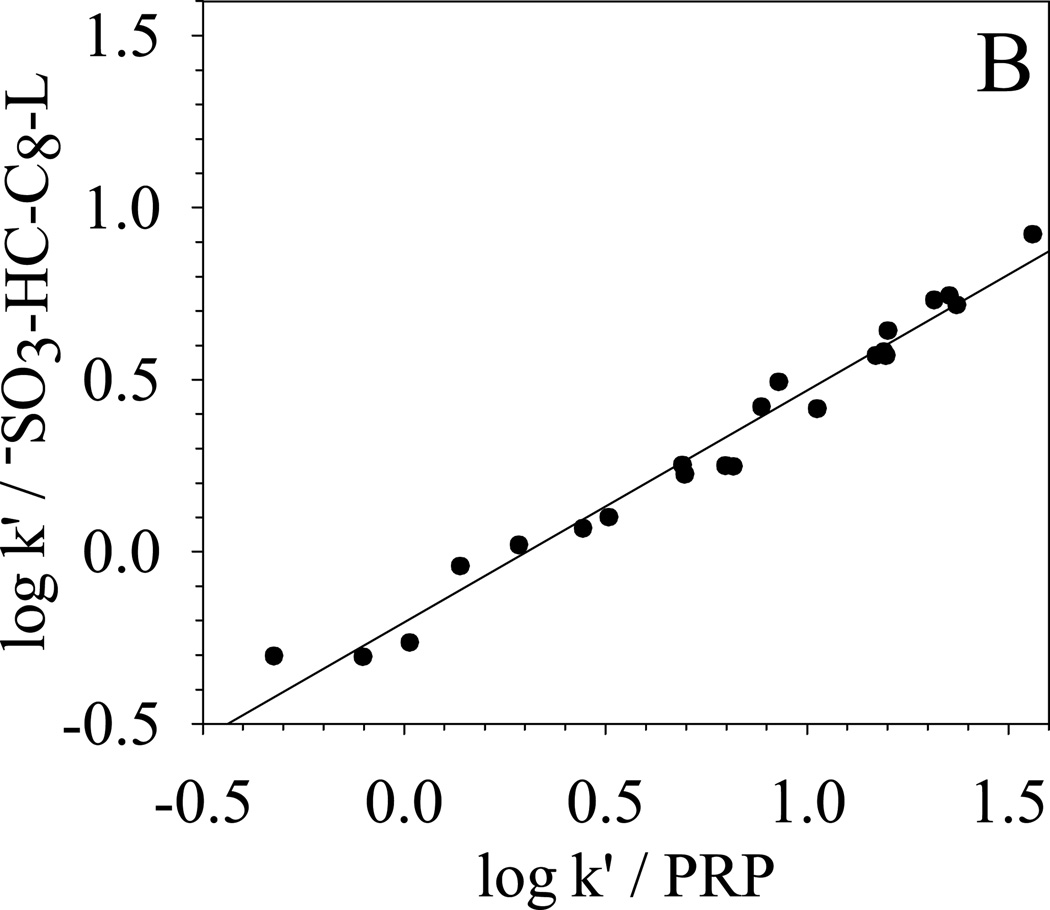
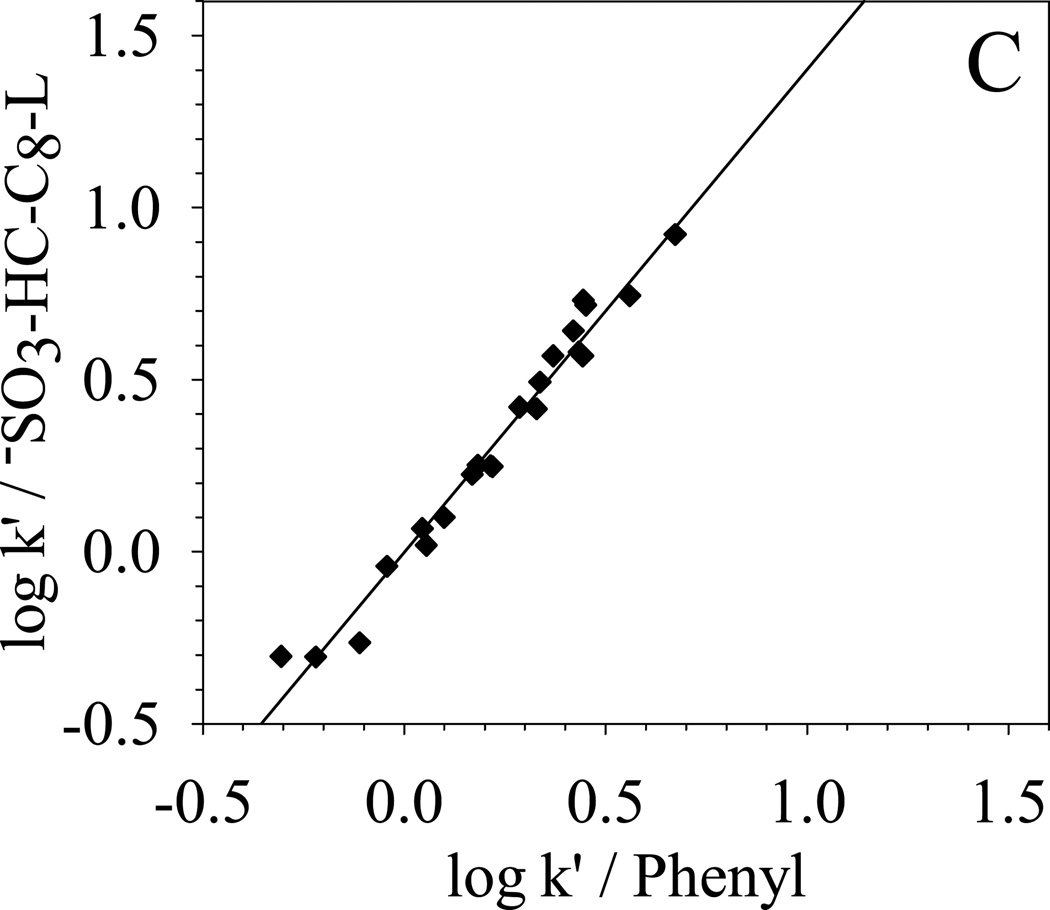
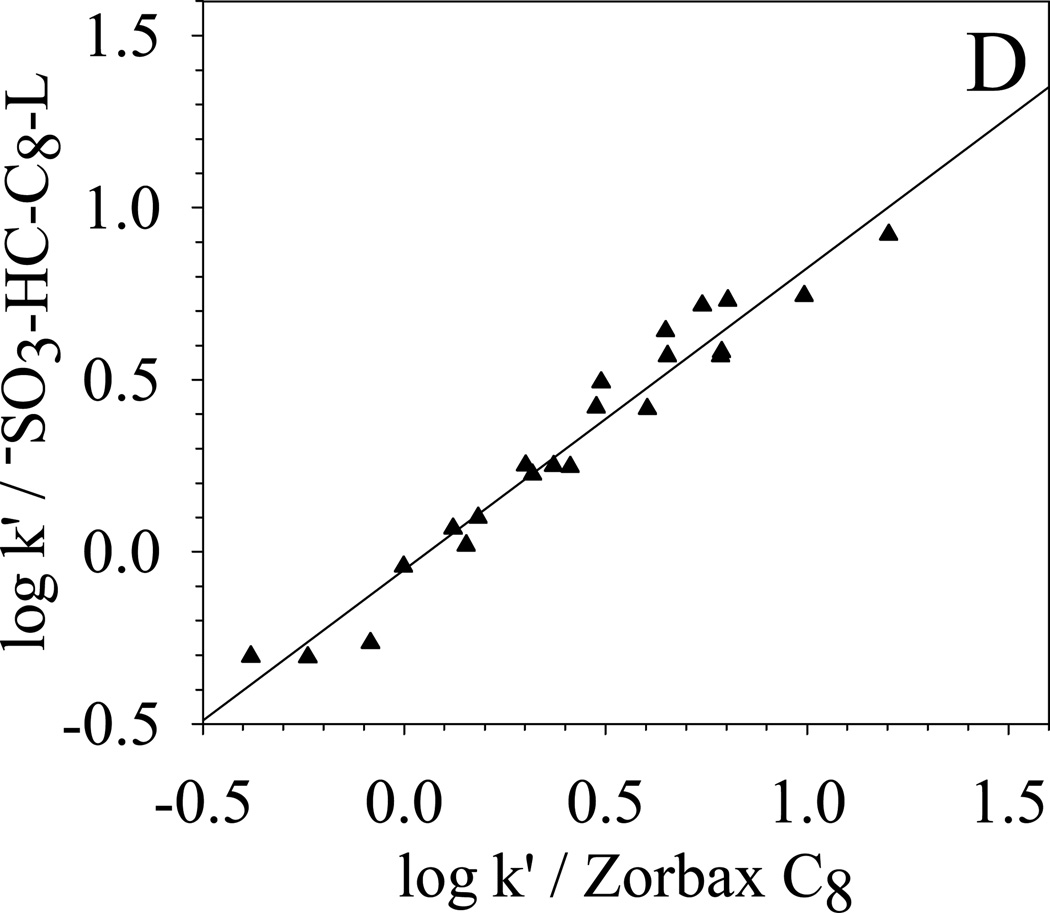
To further qualitatively determine the overall selectivity difference, κ-κ plots [68] based on the retention of the 22 solutes are generated and compared in Fig. 8. κ-κ plot is a plot of log k’ from one chromatographic system versus the log k’ from another chromatographic system. According to Horvath [68], a good linear correlation between the two sets of log k’ means that the retention mechanisms of the two chromatographic systems are similar. A slope close to unit indicates almost identical energetics of retention. On the other hand, a poor linear correlation of the κ-κ plot implies different selectivity. Under the same elution conditions, the difference between the two chromatographic systems reflects directly the difference between the two stationary phases.
Fig. 8.
Selectivity comparison of different phases via log k’ vs. log k’ plots based on the retention of the 22 LSER solutes.
| (A) −SO3-HC-C8-L vs. HC-C8 | R2 = 0.998; S.E. = 0.02; slope = 0.95±0.01 |
| (B) −SO3-HC-C8-L vs. PRP | R2 = 0.974; S.E. = 0.06; slope = 0.67±0.02 |
| (C) −SO3-HC-C8-L vs. Phenyl | R2 = 0.974; S.E. = 0.06; slope = 1.40±0.05 |
| (D) −SO3-HC-C8-L vs. Zorbax C8 | R2 = 0.957; S.E. = 0.08; slope = 0.88±0.04 |
In Fig. 8, the selectivity difference towards the 22 solutes between −SO3-HC-C8-L and other four phases are clearly shown in the κ-κ plots. The correlation coefficient R2, standard error (S.E.), and the slopes of the linear regression are also listed in the caption of Fig. 8. −SO3-HC-C8-L shows a very good correlation (R2 = 0.998) with its precursor HC-C8 and a slope of 0.95 is obtained, which means that the two phases are very similar in the separation of these non-ionic solutes. For the three commercial phases, −SO3-HC-C8-L exhibits the most different selectivity from the aliphatic phase Zorbax C8 and more closely resembles the two aromatic phases: Phenyl phase and PRP. The trend of selectivity similarity of −SO3-HC-C8-L to the three commercial phases is the same as HC-C8 phases [49]. The above results demonstrate that the weak sulfonation does not significantly change the surface non-ionic properties and the unique reversed-phase selectivity from the combination of aromatic networks and aliphatic C8 chains is preserved on the −SO3-HC-C8-L.
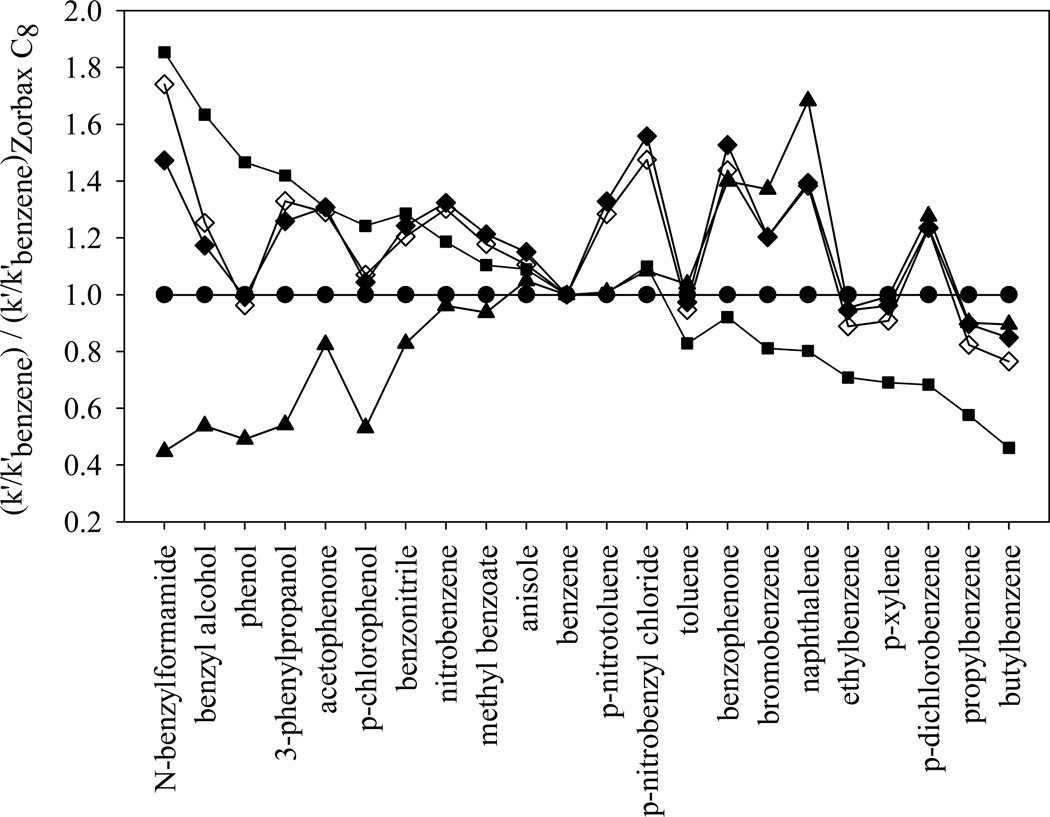
The difference in selectivity towards each solute on the various phases is clearly shown in Fig. 9. The retentions were first normalized to the retention of benzene on each phase. After that, the retention ratios of each solute on different phases were further normalized to the ratios on Zorbax C8. Then, the normalized k’ ratios for each solute on different phases were plotted in Fig. 9. The solutes were sorted from left to right in the ascending order of retention on Zorbax C8. Therefore, the solutes become more hydrophobic from left to right. For a phase that has very similar properties to Zorbax C8, we should expect a flat line at 1.00. However, we see different patterns and many fluctuations in Fig. 9, which clearly demonstrates the existence of differences in selectivity among these stationary phases. The HC phases are closer to Phenyl phase in the selectivity towards the more hydrophilic solutes and become more similar to PRP for the more hydrophobic compounds. Additionally, the two HC phases, with or without sulfonyl groups, behave very similarly to each other for all non-electrolytes.
Fig. 9.
Selectivity comparison of various phases based on the retentions of the 22 non-electrolyte LSER solutes via a plot of normalized k’ ratio. ●: Zorbax C8; ■: phenyl; ▲: PRP; ◆: HC-C8; ◇: −SO3-HC-C8-L. Chromatographic conditions are the same as in Table 5. Data on Zorbax C8, Phenyl and PRP phases are obtained from [65]
3.7. The efficiency of bases on −SO3-HC-C8 phases
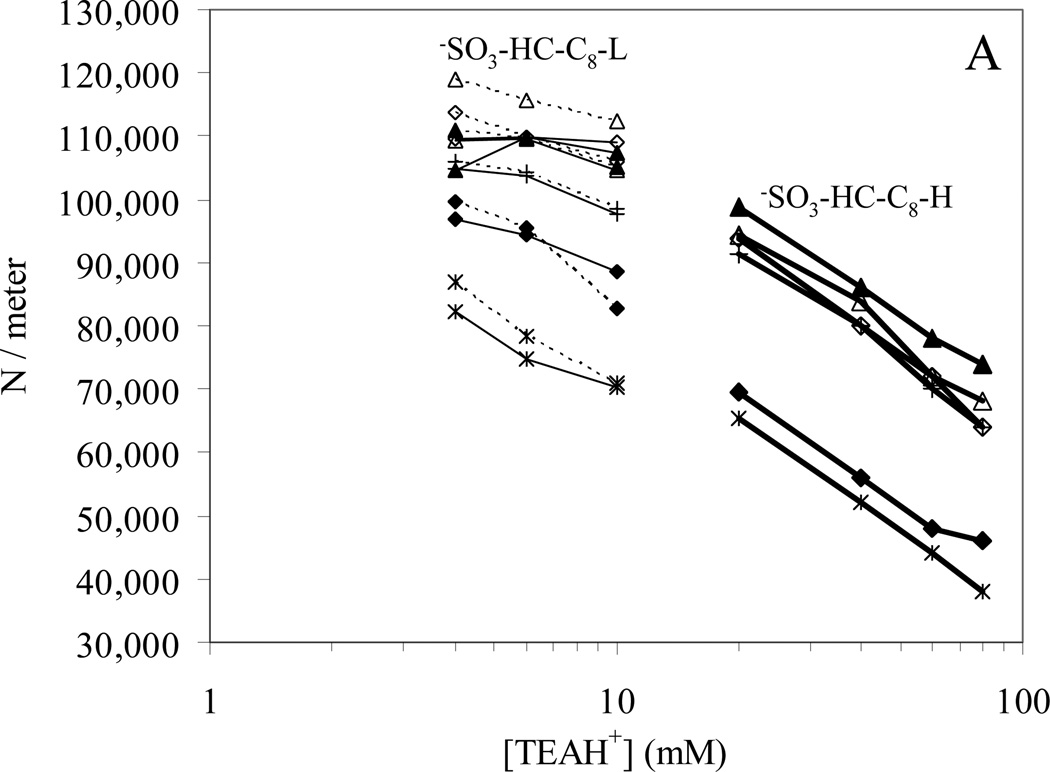
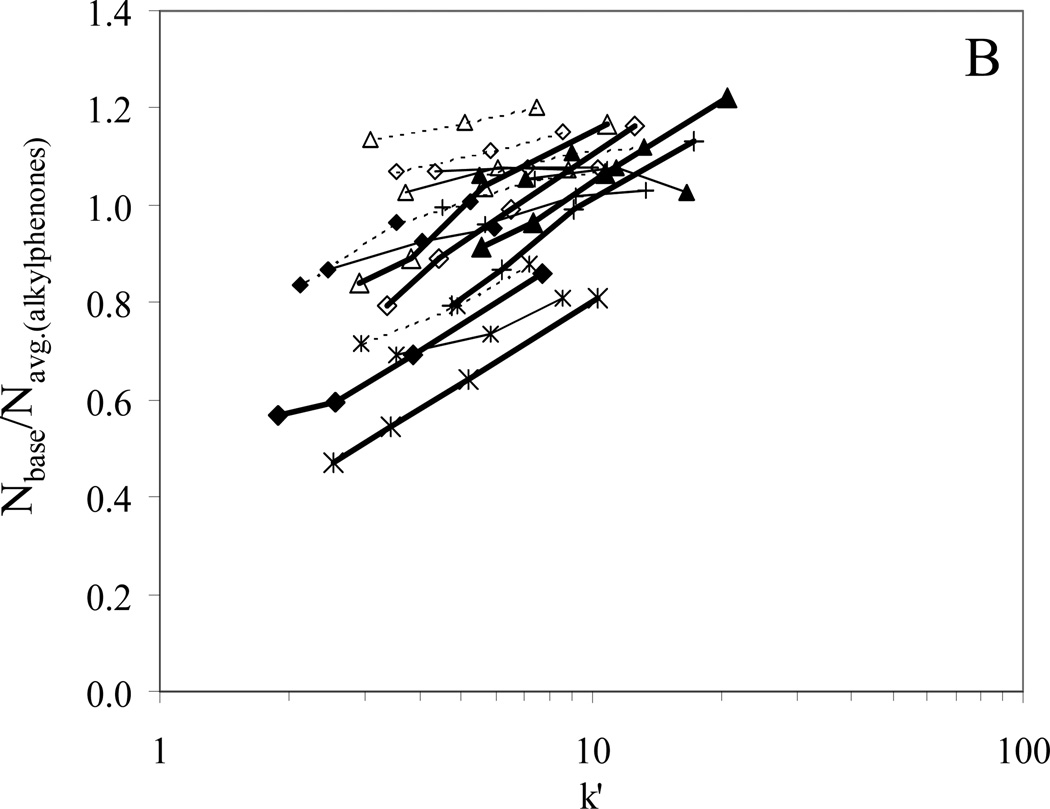
Column performance as represented by the plate count on −SO3-HC-C8-H prior to acid gradient washing, and −SO3-HC-C8-L both before and after acid gradient washing are shown in Fig. 10. It should be noted that the plate counts reported are exceptionally good compared to the vast majority of classical ion exchangers based on organic polymers. We believe that this results from the open pore structure of the silica framework and the fact that the synthetic procedure (“orthogonal polymerization” [41]) used to make the polymer leads to a polymer coating which does not plug any pores and thus a phase that has fast mass transfer. Keeping in mind that these are 5 micron diameter particles and the plate counts are in some cases over 120,000/meter. Some of these materials with certain solutes are showing better efficiency than the HC-C8 phase for non-polar solutes. Thus these seem to be extraordinarily efficient stationary phases.
Fig. 10.
The efficiency of bases on −SO3-HC-C8 phases. (A) Plate count versus [TEAH+]; (B) plate count normalized to the average plate count of alkylphenones versus k’. Solute symbols are the same as in Fig. 4.
Bold solid lines: −SO3-HC-C8-H before gradient washing, (N/meter)alkylphenones = 81,000; Thin solid lines: −SO3-HC-C8-L before gradient washing, (N/meter)alkylphenones = 102,000; Dotted lines: −SO3-HC-C8-L after gradient washing. (N/meter)alkylphenones = 100,000. Chromatographic conditions: 5.0×0.46 cm columns, T = 40 °C, F = 1.0 mL/min, 50/50 MeCN/H2O with 0.1% formic acid and TEA.HCl.
In Fig. 10A, the plate counts are plotted against the logarithm of the concentration of displacer (TEAH+). We see a clear trend of a decrease in plate count with increasing TEAH+ concentration and that the −SO3-HC-C8-H phase has an overall poorer performance than either of the −SO3-HC-C8-L phases. However, the retention of basic compounds changes with TEAH+ concentration and the efficiencies of the neutral alkylphenones are also much lower on the −SO3-HC-C8-H phase. Therefore, the plate counts of the basic compounds were normalized to the average plate count of the alkylphenones and plotted against the k’. As shown in Fig. 10B, the normalized plate counts are roughly the same for all three −SO3-HC-C8 phases. Thus, the lower efficiency on the −SO3-HC-C8-H phase is likely caused by its poorer packing quality. In addition, the efficiency of basic compounds relative to the alkylphenones clearly increases with retention. We believe this suggests that “kinetic resistance for eluite binding” [69] as described by Horvath contributes significantly to band broadening of the bases. According to Horvath and Lin, the slow association and dissociation processes between a solute and the stationary phase contribute to the plate height by Hkin. This term decreases with increased retention when k’ is greater than 1. When the association or dissociation processes are slow and Hkin becomes important to the total band broadening, we will see the efficiency increase with retention as shown in Fig. 10B.
More importantly, as shown in Fig. 10A, with a good packing quality (the average plate count of neutral compounds is around 100,000/meter), −SO3-HC-C8-L overall provides excellent efficiency for basic compounds.
4. Conclusions
A novel type of silica-based sulfonate-modifed reversed phase −SO3-HC-C8 has been synthesized by sulfonating the aromatic hyper-crosslinked networks of a previously developed acid stable material [40]. Different surface coverages of sulfonyl groups can be achieved by controlling the sulfonation temperature: approximately 0.44 and 0.1 µmole/m2of sulfonyl group were obtained at −41°C and −61°C respectively after 30 min of reaction. Based on the free energy of transfer per methylene unit ΔG0CH2, the H in Snyder’s characterization method, and the v coefficient in the LSER study, it is clear that most of the hydrophobicity of the HC-C8 phase has been preserved after sulfonation. The HC-C8 phase’s differential selectivity towards non-electrolyte solutes from conventional RPLC phases is also maintained. The special properties that provide the different selectivity from conventional RPLC phases include: the fairly strong π-interaction from the aromatic network indicated by the higher r- coefficient in LSER fits compared to conventional silica-based phenyl phases; and the rather high hydrogen bond acidity demonstrated by the quite large A coefficient in Snyder’s method and the less negative b-coefficient in the LSER analysis.
Much more importantly, these −SO3-HC-C8 phases offer unique high cation-exchange activity as shown by the extraordinarily large C coefficient as determined by Snyder’s method, which clearly distinguishes the sulfonated phase from all other RPLC phases. Additionally, the cation-exchange interaction between cationic solutes and −SO3-HC-C8 phase was found to be closely correlated with the hydrophobic interaction between the solutes and the stationary phase. The hydrophobically assisted cation exchange will greatly benefit the separation of highly hydrophilic basic compounds, which are very hard to separate by the most frequently used conventional RPLC phases. The successful application of our −SO3-HC-C8-L phase to the separation of catecholamines, serotonin and drug metabolites will be discussed in detail in our next paper. Very different selectivities from conventional ODS columns are found on our −SO3-HC-C8-L. High orthogonality is one of the prerequisites for successful two dimensional chromatographic separations. Excellent efficiency for both neutral and basic compounds is also demonstrated by the very high plate counts that are close to 100,000/meter.
Acknowledgements
We thank the National Institutes of Health for the financial support. We also thank Agilent Technologies Inc. (Wilmington, DE, USA) for the donation of Zorbax silica and SB C18 phases.
Footnotes
Publisher's Disclaimer: This is a PDF file of an unedited manuscript that has been accepted for publication.As a service to our customers we are providing this early version of the manuscript. The manuscript will undergo copyediting, typesetting, and review of the resulting proof before it is published in its final citable form. Please note that during the production process errors may be discovered which could affect the content, and all legal disclaimers that apply to the journal pertain
References
- 1.Fritz JS, Gjerde DT. Ion Chromatography. 3rd ed. New York: Wiley; 2000. [Google Scholar]
- 2.Fritz JS. J. Chromatogr. A. 2004;1039:3. doi: 10.1016/j.chroma.2003.12.068. [DOI] [PubMed] [Google Scholar]
- 3.Fritz JS. LC Mag. 1984;2:446. [Google Scholar]
- 4.Bidlingmeyer BA, Del Rios JK, Korpi J. Anal. Chem. 1982;54:442. [Google Scholar]
- 5.Croes K, McCarthy PT, Flanagan RJ. J. Chromatogr. A. 1995;693:289. [Google Scholar]
- 6.Mant CT, Litowski JR, Hodges RS. J. Chromatogr. A. 1998;816:65. doi: 10.1016/s0021-9673(98)00507-x. [DOI] [PubMed] [Google Scholar]
- 7.Crimmins DL. Anal. Chim. Acta. 1997;352:21. [Google Scholar]
- 8.Alpert AJ. J. Chromatogr. 1990;499:177. doi: 10.1016/s0021-9673(00)96972-3. [DOI] [PubMed] [Google Scholar]
- 9.Yoshida T. J. Biochem. Biophys. Methods. 2004;60:265. doi: 10.1016/j.jbbm.2004.01.006. [DOI] [PubMed] [Google Scholar]
- 10.Blonder J, Rodriguez-Galan MC, Chan KC, Lucas DA, Yu L-R, Conrads TP, Issaq HJ, Young HA, Veenstra TD. J. Proteome Res. 2004;3:862. doi: 10.1021/pr049927e. [DOI] [PubMed] [Google Scholar]
- 11.Fujii K, Nakano T, Kawamura T, Usui F, Bando Y, Wang R, Nishimura T. J. Proteome Res. 2003;3:712. doi: 10.1021/pr030007q. [DOI] [PubMed] [Google Scholar]
- 12.Saito H, Oda Y, Sato T, Kuromitsu J, Ishihama Y. J. Proteome Res. 2006;5:1803. doi: 10.1021/pr0601178. [DOI] [PubMed] [Google Scholar]
- 13.Primesep Columns, Methods, Applications, SIELC. 2004. [Google Scholar]
- 14.Luo H, Ma L, Paek C, Carr PW. in preparation. [Google Scholar]
- 15.McCalluma JL, Yangb R, Youngb JC, Strommera JN, Tsao R. J.Chromatogr. A. 2007 in press. [Google Scholar]
- 16.Dai J, Yang X, Carr PW. J. Chromatogr. A. 2003;1005:63. doi: 10.1016/s0021-9673(03)00929-4. [DOI] [PubMed] [Google Scholar]
- 17.Neue UD, Tran K, Mendez A, Carr PW. J. Chromatogr. A. 2005;1063:35. doi: 10.1016/j.chroma.2004.11.096. [DOI] [PubMed] [Google Scholar]
- 18.Yang X, Dai J, Carr PW. J. Chromatogr. A. 2003;996:13. doi: 10.1016/s0021-9673(03)00537-5. [DOI] [PubMed] [Google Scholar]
- 19.Paull B, Nesterenko PN. Analyst (CambridgeUnited Kingdom) 2005;130:134. doi: 10.1039/b406355b. [DOI] [PubMed] [Google Scholar]
- 20.Klingenberg A, Seubert A. J. Chromatogr. A. 2002;946:91. doi: 10.1016/s0021-9673(01)01538-2. [DOI] [PubMed] [Google Scholar]
- 21.Klingenberg A, Seubert A. J. Chromatogr. 1993;640:167. [Google Scholar]
- 22.Iler RK. The Chemistry of Silica: Solubility, Polymerization, Colloid and Surface Properties and Biochemistry. New York: Wiley; 1979. [Google Scholar]
- 23.Unger K, Schick-Kalb J, Krebs KF. J. Chromatogr. 1973;83:5. [Google Scholar]
- 24.Unger KK. Porous Silica, Its Properties and Use as Support in Column Liquid Chromatography (Journal of Chromatography Library. Vol. 16. Amsterdam, New York: Elsevier; 1979. [Google Scholar]
- 25.Eimer T, Unger KK, Tsuda T. Fresenius’ J. Anal. Chem. 1995;352:649. [Google Scholar]
- 26.Engelhardt H, Ahr G. Chromatographia. 1981;14:227. [Google Scholar]
- 27.Berthod A. J. Chromatogr. 1991;549:1. [Google Scholar]
- 28.Anderson DJ. Anal. Chem. 1995;67:475R. [Google Scholar]
- 29.Sander LC, Wise SA. Crit. Rev. Anal. Chem. 1987;18:299. doi: 10.1021/ac00145a020. [DOI] [PubMed] [Google Scholar]
- 30.Ma L, Carr Peter W. Anal. Chem. in press. [Google Scholar]
- 31.Claessens HA, van Straten MA. J. Chromatogr. A. 2004;1060:23. [PubMed] [Google Scholar]
- 32.Wyndham KD, O'Gara JE, Walter TH, Glose KH, Lawrence NL, Alden BA, Izzo GS, Hudalla CJ, Iraneta PC. Anal. Chem. 2003;75:6781. doi: 10.1021/ac034767w. [DOI] [PubMed] [Google Scholar]
- 33.6 686 035 B2 US Pat.
- 34.Crowther JB, Griffiths P, Fazio SD, Magram J, Hartwick RA. J. Chromatogr. Sci. 1984;22:221. [Google Scholar]
- 35.Chambers TK, Fritz JS. J. Chromatogr. A. 1998;797:139. [Google Scholar]
- 36.Asmus PA, Low C-E, Novotny M. J. Chromatogr. 1976;123:109. [Google Scholar]
- 37.Ohkubo A, Kanda T, Ohtsu Y, Yamaguchi M. J. Chromatogr. A. 1997;779:113. [Google Scholar]
- 38.Huhn G, Mueller H. J. Chromatogr. 1993;640:57. [Google Scholar]
- 39.Neimark AV, Hanson M, Unger KK. J. Phys. Chem. 1993;97:6011. [Google Scholar]
- 40.Ma L, Luo H, Dai J, Carr Peter W. J. Chromatogr. A. 2006;1114:21. doi: 10.1016/j.chroma.2006.02.017. [DOI] [PubMed] [Google Scholar]
- 41.Trammell BC, Ma L, Luo H, Hillmyer MA, Carr PW. J. Am. Chem. Soc. 2003;125:10504. doi: 10.1021/ja036339d. [DOI] [PubMed] [Google Scholar]
- 42.Trammell BC, Ma L, Luo H, Hillmyer MA, Carr PW. J. Chromatogr. A. 2004;1060:61. [PubMed] [Google Scholar]
- 43.Trammell BC, Ma L, Luo H, Jin D, Hillmyer MA, Carr PW. Anal. Chem. 2002;74:4634. doi: 10.1021/ac020206d. [DOI] [PubMed] [Google Scholar]
- 44.Wilson NS, Nelson MD, Dolan JW, Snyder LR, Wolcott RG, Carr PW. J. Chromatogr. A. 2002;961:171. doi: 10.1016/s0021-9673(02)00659-3. [DOI] [PubMed] [Google Scholar]
- 45.Kamlet MJ, Taft RW. J. Am. Chem. Soc. 1976;98:377. [Google Scholar]
- 46.Kamlet MJ, Taft RW. Acta Chem. Scand. B. 1985;B39:611. [Google Scholar]
- 47.Gordon AJ, Ford RA. A Chemist's Companion - A Handbook of Practical Data, Techniques, and References. New York: Wiley; 1972. [Google Scholar]
- 48.Tanabe K, Sano T. J. Res. Inst. Catal. 1962;10:173. [Google Scholar]
- 49.Ma L, Dai J, Luo H, Carr PW. in preparation. [Google Scholar]
- 50.Snyder LR, Kirkland JJ, Glajch JL. Practical HPLC Method Development. 2nd ed. New York: Wiley; 1997. [Google Scholar]
- 51.Sokolowski A, Wahlund KG. J. Chromatogr. 1980;189:299. [Google Scholar]
- 52.Bij KE, Horvath C, Melander WR, Nahum A. J. Chromatogr. 1981;203:65. [Google Scholar]
- 53.Nahum A, Horvath C. J. Chromatogr. 1981;203:53. [Google Scholar]
- 54.Wilson NS, Nelson MD, Dolan JW, Snyder LR, Carr PW. J. Chromatogr. A. 2002;961:195. doi: 10.1016/s0021-9673(02)00660-x. [DOI] [PubMed] [Google Scholar]
- 55.Wilson NS, Gilroy J, Dolan JW, Snyder LR. J. Chromatogr. A. 2004;1026:91. doi: 10.1016/j.chroma.2003.11.041. [DOI] [PubMed] [Google Scholar]
- 56.Wilson NS, Dolan JW, Snyder LR, Carr PW, Sander LC. J. Chromatogr. A. 2002;961:217. doi: 10.1016/s0021-9673(02)00658-1. [DOI] [PubMed] [Google Scholar]
- 57.Gilroy JJ, Dolan JW, Snyder LR. J. Chromatogr. A. 2003;1000:757. doi: 10.1016/s0021-9673(03)00512-0. [DOI] [PubMed] [Google Scholar]
- 58.Gilroy JJ, Dolan JW, Carr PW, Snyder LR. J. Chromatogr. A. 2004;1026:77. doi: 10.1016/j.chroma.2003.11.043. [DOI] [PubMed] [Google Scholar]
- 59.Marchand DH, Croes K, Dolan JW, Snyder LR. J. Chromatogr. A. 2005;1062:57. doi: 10.1016/j.chroma.2004.11.015. [DOI] [PubMed] [Google Scholar]
- 60.Marchand DH, Croes K, Dolan JW, Snyder LR, Henry RA, Kallury KMR, Waite S, Carr PW. J. Chromatogr. A. 2005;1062:65. doi: 10.1016/j.chroma.2004.11.014. [DOI] [PubMed] [Google Scholar]
- 61.Zhao J, Carr PW. Anal. Chem. 1998;70:3619. doi: 10.1021/ac980173v. [DOI] [PubMed] [Google Scholar]
- 62.Tan LC, Carr PW, Abraham MH. J. Chromatogr. A. 1996;752:1. [Google Scholar]
- 63.Sadek PC, Carr PW, Doherty RM, Kamlet MJ, Taft RW, Abraham MH. Anal. Chem. 1985;57:2971. doi: 10.1021/ac00291a049. [DOI] [PubMed] [Google Scholar]
- 64.Vitha M, Carr PW. J. Chromatogr. A. 2006;1126:143. doi: 10.1016/j.chroma.2006.06.074. [DOI] [PubMed] [Google Scholar]
- 65.Zhao J. Ph.D. Thesis. University of Minnesota; 1999. [Google Scholar]
- 66.McGowan JC. J. Chem. Technol. Biotechnol. 1984;34A:38. [Google Scholar]
- 67.Abraham MH. Chem. Soc. Rev. 1993;22:73. [Google Scholar]
- 68.Melander W, Stoveken J, Horvath C. J. Chromatogr. 1980;199:35. [Google Scholar]
- 69.Horvath C, Lin HJ. J. Chromatogr. 1978;149:43. [Google Scholar]


