Abstract
The BioRID P3 (Biofidelic Rear Impact Dummy) and the Hybrid III were evaluated in pendulum impacts to the back and compared to data from previous cadaver tests. The test setup impacting seated cadavers was reproduced with a pendulum impacting seated dummies at the level of T6 (6th thoracic vertebra). The pendulum mass was 23 kg and the impact velocity 4.6 m/s. The results showed that the BioRID P3 was more biofidelic than the Hybrid III in terms of the peak responses and the temporal window of the head and head relative to T1 horizontal, vertical, and angular displacement. This study is an evaluation of both the BioRID P3 and the Hybrid III against a recently available set of human subject data. The study meets the need for validation of the BioRID P3 at a higher impact severity than has been previously accomplished.
Low velocity impacts causing soft tissue neck injuries are frequent and increasing both in total number and in relative frequency [van Kampen, 1993; Ono and Kanno, 1993; von Kock et al., 1994; Morris et al., 1996; Ono and Kaneoka, 1997; Krafft, 1998]. For rear end impacts these injuries occur at low velocity changes, typically between 10–25 km/h [Hell et al., 1998; Eischberger et al., 1996]. Rear end impacts crashes are increasing, as reported by Watanabe et al. [2000]. To assess neck injury protection in cars, human-like crash test dummies are needed. The crash test dummy BioRID, was developed with focus on head and head relative to torso kinematics in low velocity rear end impacts.
The BioRID has been evaluated against data obtained from volunteer tests [Davidsson et al., 1998; Linder et al., 1998; Davidsson et al., 1999a; Linder et al., 1999]. Within the literature, there is a limited amount of human cadaver data describing detailed kinematics of the head and torso during low velocity rear end impacts. So far, only one set of detailed head and head relative to torso human cadaver data from previously run human cadaver have been available for evaluation of the BioRID [Eichberger et al., 2000]. The acceleration pulse used in these human cadaver tests, however, could not be sufficiently reproduced when attempts were made to evaluate the BioRID against these data [Linder et al., 1999]. Therefore, a need for an evaluation of the BioRID at higher impact severity than what could be used in volunteer tests still remained.
A set of human cadaver data at a severity above human volunteer test and with detailed head and torso kinematics has recently become available. This data set was obtained from low velocity pendulum impacts to the back of seated human cadavers. The aim of this study was thus to evaluate the BioRID P3 and the Hybrid III against these data.
MATERIALS AND METHODS
The BioRID P3 and the Hybrid III were evaluated in pendulum impacts to the back and compared to data from cadaver tests conducted at Wayne State University in 1993–1994. The cadavers were seated on the edge of a horizontal plane and impacted at the 6th thoracic vertebra (T6). The conditions of the human cadaver tests were reproduced at Autoliv Safety Centre, Sweden, with a pendulum impacting seated dummies at the back with the top of the interface at T6.
DUMMY TESTS
Dummies and test setup
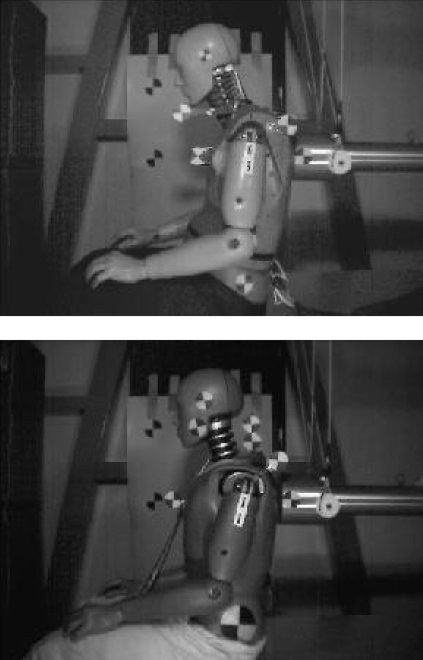
The BioRID P3 [Davidsson et al., 1999b] and a Hybrid III 50th percentile male were used in the tests. The test setup consisted of a pendulum used for chest calibration of the Hybrid III dummy. The pendulum had a mass of 23.4 kg and an impact velocity of 4.6 m/s. The pendulum surface was a smooth, flat, 25.3 cm diameter circular disc with rounded edges. The top of the impactor was at the approximate level of T6 on the BioRID P3 and at the same level on the Hybrid III. The dummies were seated upright on the edge of a horizontal surface. The surface that the dummies were seated on was of a polished steel/aluminium plate. Both dummies were dressed with low friction, synthetic fibre pants. The dummies were positioned as shown in Figure 1. The BioRID P3 impacted three times to investigate the repeatability of the test procedure.
Figure 1.
Initial dummy position and film marker position for the BioRID P3 (top) and Hybrid III (bottom).
Data acquisition
A digital high-speed video camera recorded the tests at 1000 fps. The dummies were marked with film markers placed on the head, T1, thorax, and pelvis. Linear accelerometers were placed at the centre of gravity of the head, T1 and pelvis. The transducer data was sampled at 10,000 Hz and filtered according to the SAE J211 recommendations. Camera and data acquisition, were triggered at the same time.
Film analysis
The video films were analysed using the computer software TrackEye. Head (CG) and T1 linear displacement, and head angular displacement, and pelvis linear displacement were derived from the video. The T1 displacement of the BioRID P3 was obtained from two markers placed on a stick. The stick was attached to the T1 vertebra. For the Hybrid III, two film markers on the upper torso were analysed to obtain the T1 level displacement data. Two film markers on the head were traced and the data was recalculated to the centre of gravity of the head.
CADAVER TESTS
The cadaver test data used in this study is part of a larger series of cadaver tests by Viano et al. (2000).
Specimen Selection and Handling
Eight unembalmed cadavers were tested. They had an average age of 61.5 ± 11.8 years and body mass of 69.2 ± 16.8 kg. The specimens were selected on an age, condition and, cause of death criteria, which limited age to approximately 75 years unless the specimens were in good skeletal condition. Further, the specimen should not have had a long period of bed rest or debilitating disease prior to death, or an infectious disease. Each specimen was examined radiologically to exclude any pre-existing fractures or anomalities that would influence experimental responses. All cadavers were tested after rigor mortis had passed. Prior to testing the specimens were stored in a refrigerator at 35°F until testing, where they were exposed to room temperature for several hours during instrumentation and preparation.
Instrumentation and Preparation
The cadavers were instrumented with an array of accelerometers attached to the spine and pelvis. A triaxial accelerometer package was attached to C7 and T12 and a similar triaxial accelerometer package attached to the pelvic region at the third sacral vertebra. Targets were attached to the triaxial clusters for photographic coverage and film analysis. A triaxial accelerometer was attached to the sternum and had a photo target attached. The WSU 9-accelerometer package in a 3-2-2-2 array was used to determine the rotational and translational acceleration of the head following the method of Padgaonkar et al. (1975).
Necropsy
After testing, x-rays were taken, instrumentation removed from the specimen, and the cadaver was returned to cold storage. Autopsy was performed by a board certified pathologists. No damages to the cadavers were found after the low-severity impact tests described below.
Data acquisitions
High speed movie was taken at 2000 frames per second from a lateral close-up view and three additional movies were taken at 1000 frames per second from a lateral overall-view. The acceleration channels were processed according to a Society of Automotive Engineers (1987) channel class or a finite impulse response filter.
The impact
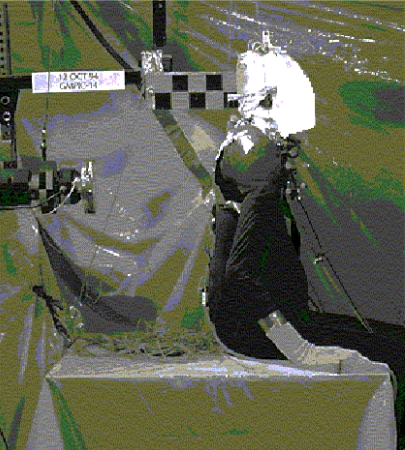
Multiple tests were conducted on each specimen to increase biomechanical response data. This included a low-severity impact at T1, T6 and on the occiput, followed by a high-speed impact at T1. For each cadaver the low severity impact were run first stating with an impact on T1 followed by the T6 test and finally an impact on the occiput. The low-severity tests were at 4.4 m/s and the high-severity tests at 6.6 m/s. The specimens were palpated and checked by x-ray between tests to assess potential injury. If none was observed, the testing continued to the high-severity rear impact. The cadavers were seated upright on the edge of a horizontal plane (Figure 2). A suspension system released the arms and head at impact, and approximated a free head and torso response to impact. A net system was placed on the far side of impact to gradually support the free body response.
Figure 2.
Setup for cadaver tests for impact on T6 (from Viano et al. 2000 with permission).
The tests were conducted with a power-assisted pendulum. The 23.4 kg pendulum was freely suspended by guide wires and accelerated to impact speed by a pneumatically charged cylinder with thrust piston. The forward motion of the pendulum was stopped after 20 cm of contact by a force-limiting cable tether. The cadavers were suspended upright with hands and arms forward. The top of the impactor’s face was aligned with T6 and T1. The pendulum interface was a smooth, flat, 15 cm diameter circular disc with the edges rounded. A suspension system released the arms and head at impact, and approximated a free head and torso response to impact.
Displacement and accelerometer data
Displacement information obtained from the tests included: Head (CG) linear displacement and head angular displacement calculated from a fixed length on the head, T1 linear displacement, and head relative T1 linear displacement and angular displacement. The T1 displacement was achieved by tracking points on the upper torso of the cadavers. The displacement data was displayed as an average of seven tests and a corridor. The displacement corridors for the low-severity T6 tests contained data from seven cadavers. One test was not recorded by film. The typical cadaver response falls within the corridor. The corridors were calculated by overlaying all of the similar test results and selecting points that bounded the responses. This approach has previously been used for side impact cadaver corridors [Viano, 1989]. Acceleration data was displayed as peak and mean values for the eight cadavers. For the impact force the time history plot with the corridor covering the response of the eight cadavers were available.
To quantify the differences in the position of the impactor on the cadaver and the dummies the proportion of the distance from the top of the impactor to the top of the torso relative to the distance from the table to the top of the torso was calculated. Estimated from the pictures the top of impactor on the cadaver was 14.6 % from the top of the torso relative the distance from the table to the top of the torso. For the BioRID the comparable figure was 14.1 % and for the Hybrid III 13.8%. The difference between the level of impact between the dummies and the cadavers was thus less than 1%.
RESULTS
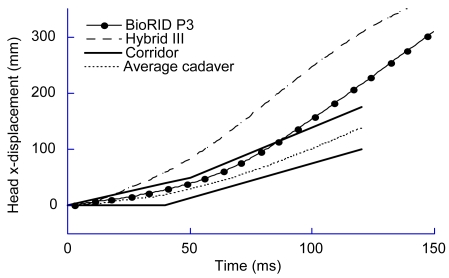
Figure 3 shows that the head x-displacement of the BioRID P3 falls within the corridor of the cadavers for a longer time than that of the Hybrid III. The response of the Hybrid III leaves the corridor at about 20 ms where-as the response of BioRID P3 stays within the corridor until about 80 ms after the time of impact.
Figure 3.
Head horizontal displacement of the corridor of the seven cadavers, Hybrid III and BioRID P3.
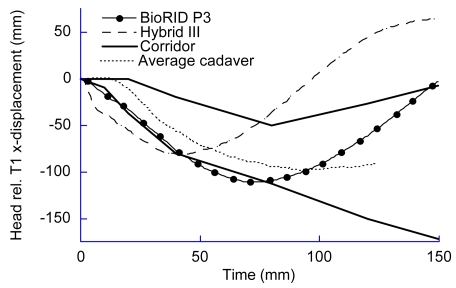
Figure 4 shows the head relative to T1 x-displacement. The response of the BioRID P3 is positioned almost entirely within the corridor of the cadavers. The response of the Hybrid III passes through the corridor instead of following the shape of the corridor. The response of the Hybrid III both decreases and increases faster than that of the cadavers.
Figure 4.
Head relative to T1 horizontal displacement of the corridor of the seven cadavers, Hybrid III and BioRID P3.
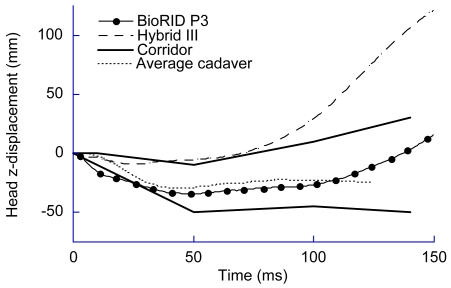
Figure 5 shows head z-displacement. The response of the BioRID P3 falls within the corridor for almost the whole time of measurement. The response of the Hybrid III is close to one side of the corridor for the first 80 ms, after that the response of the Hybrid III differs increasingly from the corridor.
Figure 5.
Head vertical displacement of the corridor of the seven cadavers, Hybrid III and BioRID P3.
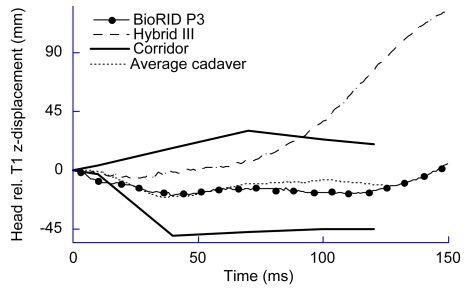
Figure 6 shows head relative to T1 z-displacement. It shows that the response of BioRID P3 is positioned within the corridor for the cadavers for almost the whole time of measurement. The response of Hybrid III falls within the corridor for the first 92 ms, after that the Hybrid III differs increasingly from the corridor.
Figure 6.
Head relative to T1 vertical displacement of the corridor of the seven cadavers, Hybrid III and BioRID P3.
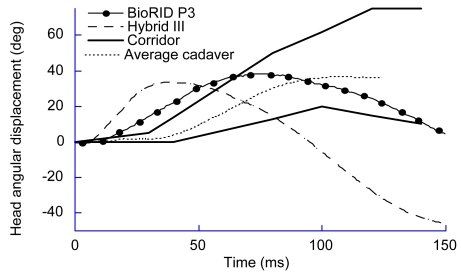
Figure 7 shows head angular displacement. It shows that the response of the BioRID P3 was within or close to the corridor for the cadavers for the whole time of measurement. The response of the Hybrid III differs from the corridor. The response of the Hybrid III both increases and decreases faster than that of the cadavers.
Figure 7.
Head angular displacement of the corridor of the seven cadavers, Hybrid III and BioRID P3.
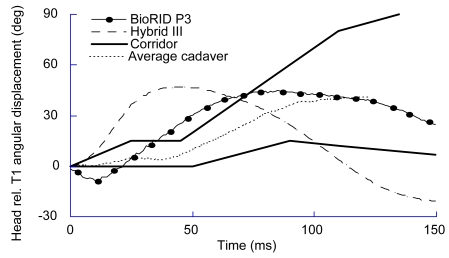
Figure 8 shows head relative to T1 angular displacement. The response of the BioRID P3 was closer to that of the corridor than was the Hybrid III. The time for the positive peak value of the head relative to T1 angular displacement differs between the Hybrid III and the BioRID P3. The peak value for the BioRID P3 fell within the corridor of the cadavers whereas the peak value for the Hybrid III occurs earlier than in the cadaver tests. The peak value occurs at 47 ms for the Hybrid III and at 85 ms for the BioRID P3.
Figure 8.
Head relative to T1 angular displacement of the corridor of the seven cadavers, Hybrid III and BioRID P3.
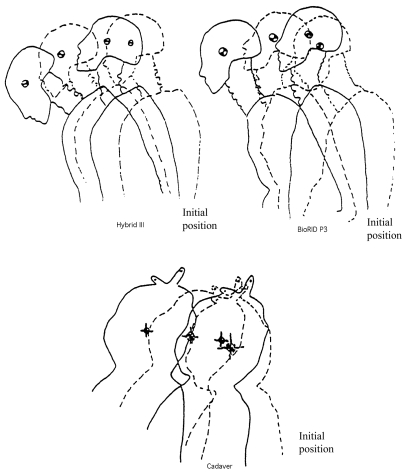
Figure 9 shows a schematic drawing of the motion after the impact for the Hybrid III, the BioRID P3 and a cadaver. The head CG is marked with a film marker. The response of the cadavers falls within the corridors in Figure 3–8.
Figure 9.
Schematic drawing from the high-speed video films of the motion for the Hybrid III (top right), the BioRID P3 (top left) and a cadaver (bottom). The drawings are from the time of impact, at 50 ms, 100 ms, and 150 ms after impact.
The drawings are from the time of impact, at 50 ms, 100 ms, and 150 ms after impact. From initial position until 50 ms after the impact an upward head motion occurred for the cadaver and the BioRID P3. This motion was not present for the Hybrid III.
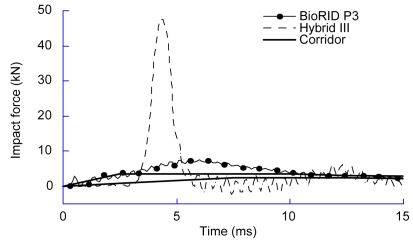
Figure 10 shows the pendulum impact force for the corridor of the seven cadavers, Hybrid III, and BioRID P3. The Hybrid III produced a force with higher peak value and shorter duration than the BIORID P3 did. The BioRID P3 was closer to the corridor than was the Hybrid III.
Figure 10.
Pendulum impact force for the corridor of the seven cadavers, Hybrid III and BioRID P3.
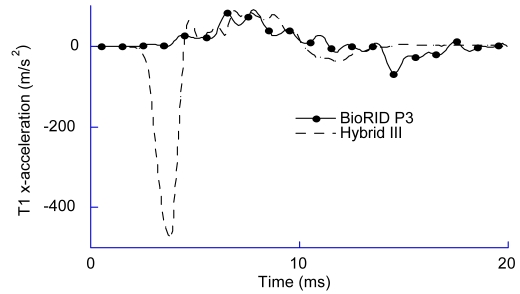
Figure 11 shows the T1 x-acceleration for the Hybrid III and the BioRID P3. The Hybrid III produced a high negative peak value that was not found in BioRID P3. The positive peak T1 acceleration was similar for both dummies.
Figure 11.
The T1 horizontal acceleration of the Hybrid III and BioRID P3.
For the T1 angular displacement the BioRID P3 produced a rotation backward (positive values) that was not found in the Hybrid III. The T1 angular displacement was not available as a function of time from the cadaver tests. However, the peak value of the average cadaver was 9.0 (sd 7.5) degrees (Table 1). Table 1 summarises key peak responses and the time of the peak values of the average cadaver, the BioRID P3, and the Hybrid III. The time of the peak values were obtained from the graphs (Figure 3, 5 and 7)
Table 1.
Summary of peak responses and time for the average cadaver, BioRID P3, and Hybrid III.
| Test object | Peak head disp. deg | ang.disp time (ms) | Peak T1 ang. disp. (deg) | Peak head disp. (mm) | z-disp. time (ms) |
|---|---|---|---|---|---|
| Average cadaver | 45.9 (sd 23.2) | 106 | 9.0 (sd 7.5) | −29.8 (sd 20.3) | 43 |
| BioRID P3 | 38.5 | 75 | 9.5 | −34.2 | 48 |
| Hybrid III | 37.5 | 38 | No positive values | −9.2 | 27 |
The repeatability of the test method was examined by impacting the BioRID P3 three times under identical conditions. The impact velocity was 4.61 ± 0.1 m/s. The repetability was calculated as the difference in the peak of one test to the average peak value of the tests. The peak head x-acceleration differed from the average peak value less than ± 4 %. Film analysis data showed less than ± 6 % difference between individual tests and the average value for the peak value of the head relative to T1 angular displacement and x-displacement.
DISCUSSION
The head and head relative to T1 motion of the BioRID P3 was within the corridor of the cadavers for the major part of the first 150 ms after impact. The kinematic response of BioRID P3 was closer to that of a human cadaver than was the Hybrid III in terms of head and head relative to T1 horizontal, vertical, and angular displacement. This was found for both peak values and for the temporal window. All peak displacements were reached earlier by the Hybrid III than by the BioRID P3. The cadavers reached their peak value later than the dummies (Figure 3–8).
How should the dummy head and head relative to T1 displacement response be compared to the cadavers, when the dummies are expected to represent a living human? Are the cadavers’ responses expected to have a larger or a smaller peak value that a living human would produce? To evaluate this comparable tests between volunteers and cadavers are needed. No studies in the literature have been found on this issue for rear end impacts. For frontal flexion Wismans et al. [1987] found that human cadavers produced a higher head angular displacement than the volunteers in comparable tests. If a simular relation is expected to be the case for extension motion the head angular peak displacement (which is the maximum extension motion in this study) values for the dummy should not exceed the maximum value of the corridor. Both the dummies fulfilled this requirement.
Figure 3–8 shows that the peak displacements occur earlier for the Hybrid III than for the BioRID P3 and the cadavers. The response of the BioRID P3 was closer to that of the cadavers than was that of the Hybrid III. Similarly, the BioRID P3 had previously been found to compare better to volunteers [Davidsson et al., 1999a; Linder et al., 1999]. The BioRID P3 is thus more biofidelic in terms of head and head relative to torso motion when used at low velocity impacts than the Hybrid III due to a flexible construction of the spine of the BioRID P3 compared to the more rigid structure of the Hybrid III.
The cadaver data was chosen from a larger test series [Viano et al. 2000], which also contains test data from impacts on the level of T1 and tests at higher impact velocities than 4.4 m/s2. The reason for choosing the T6, 4.4 m/s2 test was because it was the test that was most representative of a typical rear end collision generating AIS 1 soft tissue neck injuries. For the higher impact velocity, the risk of braking the acetal vertebrae in the BioRID P3 was judged to be high, since the impact is a hard impact on a small surface. The impact at T1 would have required a modified test set-up for both the Hybrid III and the BioRID P3. A small part the lower edge of the impactor would have impacted the dummies, if they had been positioned in an upright sitting position. To be able to impact the dummies on the level of T1 either a different seating position or a different surface on the impactor would have to be used.
What kind of rear impact collision did the pendulum impact of 4.6 m/s represent? When comparing the peak head relative to T1 angular displacement the impact represented a somewhat more severe impact than a sled test in a rigid seat without head restraint exposed to a Δv of 9.4 km/h and a peak acceleration of 33.4 m/s2 [Davidsson et al., 1999a]. In Davidsson et al. (1999a) the peak value was 41 degrees and in the present study the peak value was 45 degrees (Figure 8) for the BioRID P3. The peak T1 x-acceleration (Figure 10) was approximately twice as high in the present study than for the BioRID P3 tested in a rigid seat [Davidsson et al. 1999a].
The BioRID was developed with focus on head and head relative to torso kinematics in low velocity rear end impacts. A set of human cadaver data at a severity above human volunteer tests and with detailed head and torso kinematics recently became available. This data set was obtained from low velocity pendulum impacts to the back of seated human cadavers. When the BioRID and Hybrid III was evaluated against these data, the BioRID was found to produce a more humanlike head and head relative to torso motion than the Hybrid III.
CONCLUSIONS
The BioRID P3 has a more biofidelic head and head relative to torso response than the Hybrid III when evaluated in a test where a pendulum impacts to the back at an impact velocity of 4.6 m/s. This study involves a more severe impact situation than was used for the previous evaluations of the BioRID P3. This study thus indicates that the BioRID P3 has a higher degree of biofidelity in terms of head and head torso motion as compared to the Hybrid III at both higher rear impact severities and lower impact severities.
ACKNOWLEDGEMENTS
The dummy tests were supported and carried out in co-operation with Autoliv AB Research, Volvo Car Corporation and Saab Automobile AB. These dummy tests were part of a project in the Swedish Vehicle Research Program and were administered by NUTEK. We thank Anders Flogård and Rikard Fredriksson for an excellent job in arranging the test set-up and running the dummy tests. We also thank those that made the human cadaver data available for this study.
REFERENCES
- Davidsson J, Svensson MY, Flogård A, Håland Y, Jakobsson L, Linder A, Lövsund P, Wiklund K. BioRID - A New Biofidelic Rear Impact Dummy. Proc. of IRCOBI Conference on Biomechanics of Impacts; Göteborg, Sweden. 1998. pp. 377–390. [Google Scholar]
- Davidsson J, Lövsund P, Ono K, Svensson MY. A Comparison between Volunteer, BioRID P3 and Hybrid III performance in Rear-End Sled Collisions Impacts. Proc. IRCOBI International Conference on the Biomechanics of Impacts; Barcelona, Spain. 1999a. pp. 165–178. [Google Scholar]
- Davidsson J, Flogård A, Lövsund P, Svensson MY. A New Version of the Biofidelic Rear Impact Dummy Design and Validation of the BioRID P3. 43rd STAPP Car Conference; San Diego, USA. 1999b. pp. 253–265. [Google Scholar]
- Eichberger A, Steffan H, Geigl B, Svensson MY, Boström O, Leinzinger PE, Darok M. Evaluation of the Applicability of the Neck Injury Criterion (NIC) in Rear End Impacts on the Basis of Human Subject Tests. Proc. IRCOBI International Conference on the Biomechanics of Impacts; Göteborg, Sweden. 1998. pp. 321–333. [Google Scholar]
- Eichberger A, Darok M, Steffan H, Lienzinger PE, Boström O, Svensson MY. Pressure measurements in the spinal canal of post-mortem human subjects during rear-end impact and correlation of results to the neck injury criterion (NIC) Accident Analysis and prevention. 2000;32:251–260. doi: 10.1016/s0001-4575(99)00097-4. [DOI] [PubMed] [Google Scholar]
- Hell W, Langeweider K, Waltz F. Reported soft tissue injuries after rear-end collisions. Proc. IRCOBI International Conference on the Biomechanics of Impacts; Göteborg, Sweden. 1998. pp. 261–274. [Google Scholar]
- van Kampen LTB. Availability and (Proper) Adjustment of Head Restraint in the Netherlands. Proc IRCOBI International Conference on the Biomechanics of Impacts; Eindhoven, The Netherlands. 1993. pp. 367–377. [Google Scholar]
- von Kock M, Nygren Å, Tingvall C. Impairment Pattern in Passenger Car Crashes, a Follow-up of Injuries Resulting in Long Term Consequences. Paper No. 94-S5-O-02. Proc. 14th ESV conference; Munich, Germany. 1994. pp. 776–781. [Google Scholar]
- Krafft M. Non-fatal injuries to car occupants – Injury assessment and analysis of impact causing short- and long-term consequences with special reference to neck injuries; PhD Thesis; Stockholm: Karolinska Institute; 1998. ISBN 91-628-3196-8. [Google Scholar]
- Linder A, Svensson MY, Davidsson J, Flogård A, Håland Y, Jakobsson L, Lövsund P, Wiklund K. The New Neck Design for the Rear-End Impact Dummy, BioRID I. Proc of 42th Annual AAAM Conference; USA. 1998. pp. 179–192. [Google Scholar]
- Linder A, Lövsund P, Steffan H. Validation of the BioRID P3 against Volunteers and PMHS Data and Comparison to the Hybrid III in Low-Velocity Rear-End Impacts. The 43th Annual AAAM Conference; Barcelona, Spain. 1999. pp. 367–381. [Google Scholar]
- Morris AP, Thomas P. A Study of Soft Tissue Neck Injuries in the UK. Proc ESV Conference Melbourne; Australia. 1996. Paper no. 96-S9-O-08. [Google Scholar]
- Ono K, Kanno M. Influence of the Physical Parameters on the Risk to Neck Injuries in Low Impact Speed Rear-end Collisions. Proc IRCOBI International Conference on the Biomechanics of Impacts; Eindhoven, The Netherlands. 1993. pp. 201–212. [Google Scholar]
- Ono K, Kaneoka K. Motion Analysis of Human Cervical Vertebrae During Low Speed Rear Impacts by the Simulated Sled. Proc. IRCOBI International Conference on the Biomechanics of Impacts; Hannover, Germany. 1997. pp. 223–237. [Google Scholar]
- Padgaonkar AJ, Krieger KW, King AI. Measurement of angular acceleration of a rigid body using linear accelerometers. J Appl Mech. 1975;42:552–556. [Google Scholar]
- Viano DC. Biomechanical Responses and Injuries in Blunt Lateral Impact.” SAE Transactions Vol. 98, 1989. Proceedings of the 33rd Stapp Car Crash Conference (P-227); SAE Technical Paper #892432, Society of Automotive Engineers, Warrendale, PA. 1989. pp. 113–142. [Google Scholar]
- Viano DC, Hardy WN, King AI. Response of the Head, Neck and Torso to Pendulum Impacts on the Back. Paper # 00-S038. 44st Stapp Car Crash Conference.2000. [Google Scholar]
- Watanabe Y, Ichikawa H, Kayama O, Ono K, Kaneoka K, Inami S. SAE 1999-01-0635, Society of Automotive Engineers; Warrendale, PA. 1999. [Google Scholar]
- Wismans J, Philippens M, van Oorschot E, Kallieris D, Mattern R. Comparison of Human Volunteer and Cadaver Head-Neck Response in Frontal Flexion. Proceedings of the 31st Stapp Car Crash Conference (P-202); SAE Technical Paper #872194, Society of Automotive Engineers, Warrendale, PA. 1987. pp. 1–13. [Google Scholar]


