Abstract
The purpose of this study was to evaluate the effectiveness of frontal restraint systems in reducing the potential for head injuries, specifically brain injuries and skull fractures. The US DOT NASS database files from 1991–1998 were evaluated for drivers and right front seat occupants in frontal crashes. Of the total driver and right front seat occupants in this data set, 3.83% sustained a brain injury without skull fracture, 0.05% sustained a skull fracture without a brain injury, and 0.16% sustained both brain injury and skull fracture. The incidence of head injury was lowest among occupants who were restrained by belt alone (2.76%) and by both airbag and belt systems (3.51%). The unrestrained population had a 10.39% incidence of at least one type of head injury. In general, for maximum AIS≥2 head injuries, airbag effectiveness was greatest between 16–45 kph crash ΔV. For the more severe maximum AIS≥3 head injuries, the airbag restraint had its greatest effect up to 35 kph. It can be concluded that brain injury in frontal crashes is substantially reduced with the presence of a restraint system and the use of both airbag and belt restraint offers the greatest protection across all AV categories. Restraint system effectiveness for the non-head-injured occupant is variable but, generally, the belted occupant sustained the lowest percentage of injuries. Skull fractures in frontal impact were relatively rare and the incidence appeared to be unaffected by the presence of a restraint system.
Motor vehicle crashes continue to remain one of the highest sources of head trauma [Gennarelli et al., 1994]. Frontal airbag systems are intended to provide maximum protection to front seat occupants in full frontal vehicle collisions. The head, neck, and chest body regions have been considered the most vulnerable to severe trauma in frontal impact. Despite the common notions by clinicians and many automotive trauma researchers, the effectiveness of airbag restraint systems in mitigating head injury has not been well documented in the scientific literature. The last report to the US Congress on this topic used the 1987–1995 databases wherein there were only limited airbag data [NHTSA, 1996]. With the fleet increasing in numbers of airbag-equipped vehicles, cases of frontal vehicle collisions have reached a level wherein restraint effectiveness can be better quantified. The purpose of this paper, therefore, was to evaluate the effectiveness of frontal airbag systems in reducing the potential for head injuries, specifically brain injuries and skull fractures. Also, how is restraint effectiveness altered by crash delta-V (ΔV)? A national vehicle crash database was queried to determine results.
METHODOLOGY
The US Department of Transportation (DOT) National Highway Traffic Safety Administration (NHTSA) National Automotive Sampling System (NASS) database files were queried for brain injuries and skull fractures occurring to drivers and right front seat passengers in frontal crashes. The crashes included a principal direction of force limited to 10 o’clock to 2 o’clock, non-rollovers, non-ejections, and exclusion of sport utility vehicles. Adult occupants over the age of 16 were included in the analysis. The inclusive years of study were 1991–1998. For occupants sustaining head injuries, the maximum head abbreviated injury scale (MHAIS) was used to evaluate injury severity. In other words, regardless of other bodily injuries, the worst injury to the head for each occupant was used for the analysis and compared to the total number of occupants. Scalp and facial injuries were excluded from the MHAIS analysis although occupants that sustained multiple head injuries including scalp and facial injuries were counted. For the injured occupant who did not sustain any type of head injury, the maximum body AIS (MAIS) was used in the analysis. Occupants without head injuries were evaluated to identify potential adverse affects of protecting the head. In other words, occupants without head injuries can be thought of as receiving head protection in some way, but were other bodily injuries adversely affected by this head protection?
Facial injuries and scalp lacerations were intentionally omitted from the analysis. Facial fractures such as those affecting the mandible and maxillary bones, as well as orbital and temporomandibular joints, were excluded. Scalp abrasions, contusions, and lacerations were all omitted from the inquiry due to the confounding influence these may have on the results. The intent was to extract a database that was more relevant to current protective measures founded on the head injury criteria (HIC) in use to design safer vehicles. Brain injuries included intracranial vascular injuries, cranial nerve injuries, brainstem, cerebellum, and cerebrum injuries. The skull fracture injuries included only basilar skull fractures and cranial vault fractures including occipital, parietal, sphenoid, temporal, and frontal bones. Injuries that were coded with loss of consciousness were also included in the study. This data set, therefore, separated occupants with only brain injuries, occupants with only skull fractures, and occupants with both brain injury and skull fracture.
Data were categorized into unrestrained, airbag only, belt only, and airbag with belt restraint cases. The belted cases refer to a three-point belt restraint only. Data were also categorized by crash ΔV ranges including 0–15, 16–25, 26–35, 36–45, and 46+ kilometers per hour (kph). National estimates (weighted data) were analyzed on the basis of the total number of occupants in a particular category to compare occupants sustaining head injuries, and injured occupants with no head injury.
NASS DATABASE DESCRIPTION
The National Automotive Sampling System was created in 1979 to produce a national crash database for the evaluation of old, and the development of new highway vehicle safety standards and to identify highway safety needs. The system consists of 24 teams of crash researchers situated throughout the country. At each Primary Sampling Unit (PSU) site, the crash research team investigates a probability sample of police-reported crashes involving passenger cars, light trucks, and vans which, according to the police report, were towed from the scene due to damage. Established Zone Centers provide quality control of the data collected and technical management of the teams within that zone. Quality control in the areas of sampling, completeness of data, reliability, and validity of data is carried out through Zone Center site visits to the PSUs and through the review of crash case report materials received at the Zone Center. Because the restraint information primarily comes from the police reports, the use of belts may be somewhat overstated. Although the primary source of this information originates from the police officer questioning the occupants and their personal observations, the NASS crash investigators use a variety of additional data sources to make a final decision for the restraint code. Since there has been no definitive study on how much the belt restraint use may be overstated, the present investigation did not make any adjustments for this potential error in the data set.
Motor vehicle crashes that qualify for inclusion in the database must meet the following criteria. A crash incident must be reported on state or local crash forms, signed by a police officer, and the report should be available through police agency files. The incident must be reported to the state crash statistics office and must involve a harmful event. A harmful event is defined as property damage and/or personal injury, and must occur directly as a result of the crash. Other intervening circumstances such as disease, deliberate intent, legal intervention, or cataclysm are ruled out. Finally, the incident must involve a motor vehicle that is in transport and on a trafficway. Crashes occurring at sites such as parking lots and driveways are excluded.
When a crash incident qualifies according to the above criteria, it is “listed” at the PSU for possible sampling into the NASS database. Criteria for a crash incident to be sampled depend on unique guidelines established for each PSU. The first sampling filter examines type and model year of vehicle, tow status of vehicle, severity of police-reported injuries, and disposition of injured persons. Only vehicle types that were not medium/heavy trucks and late-model (current production year and previous three years) vehicles were sampled. Crashes involving victims who were among the most severely injured (including fatal injuries) and were transported directly from the scene to a facility for treatment were also a priority in the sample. The second filter gives priority to crashes that had at least one victim who was hospitalized overnight.
Because the sampling process is only a representation of all national data, weighted data are needed to obtain national estimates. The US was divided into 1,195 PSUs out of which 24 were sampled. If every crash in every PSU was investigated, the national estimate could be obtained by weighting each crash by the inverse of the probability of selecting the PSU. Because only 24 were sampled, and only a select number of crashes were investigated, the weighting factors have three levels. The first stage of weighting is the PSU Inflation Factor. Within each PSU are several police jurisdictions. The PSU Inflation Factor is equal to the product of the inverse of the probability of selecting a particular crash from other crashes, and the inverse of the probability of selecting the police jurisdiction in which the crash occurred from all police jurisdictions within the PSU. The second stage of weighting is the National Inflation Factor that is equal to the product of the PSU Inflation Factor and the inverse of the probability of selecting the given PSU from all PSUs. The third stage of weighting is the Ratio Inflation Factor and is equal to the product of the National Inflation Factor and rate which adjusts for differences between actual and estimated crash totals. Thus, each crash is counted but not necessarily investigated for inclusion in the NASS database. Ratios are formed by dividing the total crash counts under a given scenario by the estimated counts determined using the National Inflation Factors. The final weight assigned to each crash is, therefore, the product of the three inflation factors and can be in the range of 1.2 to 40,000. However, <1% of the crashes are weighted >5,000.
RESULTS
From the weighted data set for all ΔVs, there were 12.2 million driver and right front seat occupants, out of which 467,246 (3.83%) sustained a brain injury alone, 6,070 (0.05%) sustained a skull fracture alone, and 19,813 (0.16%) sustained both brain injury and skull fracture. There were 1,853,451 unrestrained occupants, out of which 10.39% had one of the above three head injuries. The population restrained by airbag alone had substantially less numbers with 120,002 occupants, out of which 6.30% had at least one type of head injury. The population restrained by belt alone was by far the highest with 8,819,166 occupants, out of which 2.76% sustained a head injury. 1,406,535 occupants with both airbag and belt restraint sustained 3.51% head injuries (Table 1).
Table 1.
Weighted Counts of Drivers and Right Front Seat Passengers for all Crash ΔVs. NASS Data 1991–1998.
| Total Occupants | Occupants with Head Injury | % Occupants with Head Injury | Occupants without Head Injury | % Occupants without Head Injury | |
|---|---|---|---|---|---|
| Unrestrained | 1,853,451 | 192,517 | 10.39 | 903,618 | 48.75 |
| Airbag | 120,002 | 7,555 | 6.30 | 80,234 | 66.86 |
| Belt | 8,819,166 | 243,643 | 2.76 | 3,309,731 | 37.53 |
| Airbag and Belt | 1,406,535 | 49,414 | 3.51 | 858,901 | 61.07 |
| All Occupants | 12,199,154 | 493,129 | 4.04 | 5,152,484 | 42.24 |
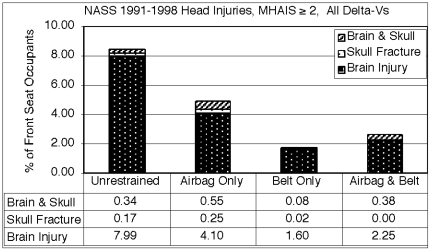
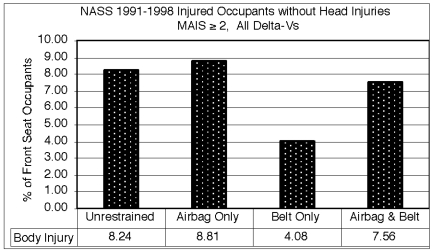
The current data set for head-injured occupants contains only a small number of AIS=1 injuries because the Abbreviated Injury Scale code describes only one kind of AIS=1 brain injury corresponding to occupants who had headache and/or dizziness with no loss of consciousness but known to be the result of a head injury. There are no AIS=1 skull fracture codes in the AIS manual. Since the more severe head injuries were of interest to the current study, the brain and skull injuries for AIS≥2, AIS≥3, and AIS≥4 were analyzed. The percentage of total brain and skull injuries of MHAIS≥2 decreased from the unrestrained occupant (8.50%), to airbag only restrained occupants (4.90%), to airbag and belt restrained occupants (2.64%), to belt only restrained occupants (1.71%) (Figure 1). In contrast, the same trend was not apparent for injured occupants without head injuries (Figure 2). The total numbers (all ΔVs) for injured occupants without head trauma were: 903,618 unrestrained occupants, 80,234 airbag only restrained occupants, 3,309,731 belt only restrained occupants, and 858,901 airbag and belt restrained occupants. A predominant amount of these non-head-injured occupants sustained AIS level one injury. For example, the occupants who were restrained by airbag alone had MAIS≥2 injuries of only 10,577.
Fig. 1.
Bar graph representation of MHAIS≥2 injuries by restraint system. Numbers reflect percentage of driver and right front seat passenger occupants who sustained head injuries under each restraint type.
Fig. 2.
Bar graph representation of MAIS≥2 body injury by restraint system. Numbers reflect percentage of driver and right front seat passenger occupants for each restraint type who sustained injuries other than head injuries, i.e., the head-protected occupant.
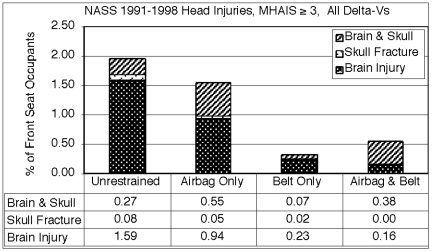
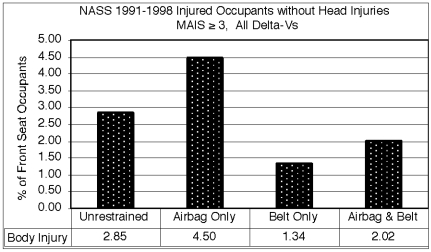
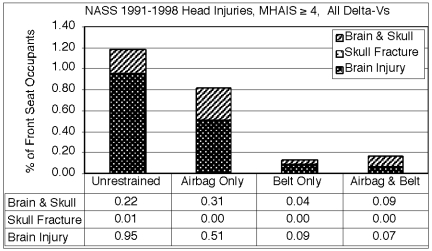
For MHAIS≥3 injuries, the belt alone and airbag and belt restrained occupants saw the least percentages of total head trauma, however the airbag and belt combination produced the least percentage of brain injuries (Figure 3). For the non-head-injured occupants, the least percentage of MAIS≥3 injuries was realized by the belt only restraint population (Figure 4). For the most severe injuries, MHAIS≥4, the belt restraint condition with or without airbags produced very low percentages of head-injured occupants compared to the unrestrained population (Figure 5).
Fig. 3.
Bar graph representation of MHAIS≥3 injuries by restraint system. Numbers reflect percentage of driver and right front seat passenger occupants who sustained head injuries under each restraint type.
Fig. 4.
Bar graph representation of MAIS≥3 body injury by restraint system. Numbers reflect percentage of driver and right front seat passenger occupants for each restraint type who sustained injuries other than head injuries, i.e., the head-protected occupant.
Fig. 5.
Bar graph representation of MHAIS≥4 injuries by restraint system. Numbers reflect percentage of driver and right front seat passenger occupants who sustained head injuries under each restraint type.
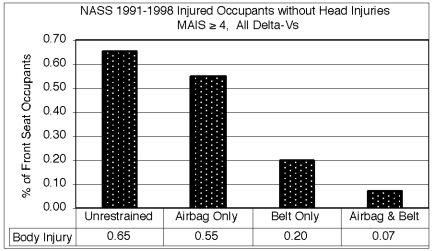
For MAIS≥4 injuries for non-head-injured occupants, the airbag and belt restrained condition produced the least percentage of injuries (Figure 6). Thus, the airbag and belt combination produces the lowest incidence of either head or bodily injuries for the most severe injuries.
Fig. 6.
Bar graph representation of MAIS≥4 body injuries by restraint system. Numbers reflect percentage of driver and right front seat passenger occupants for each restraint type who sustained injuries other than head injuries, i.e., the head-protected occupant.
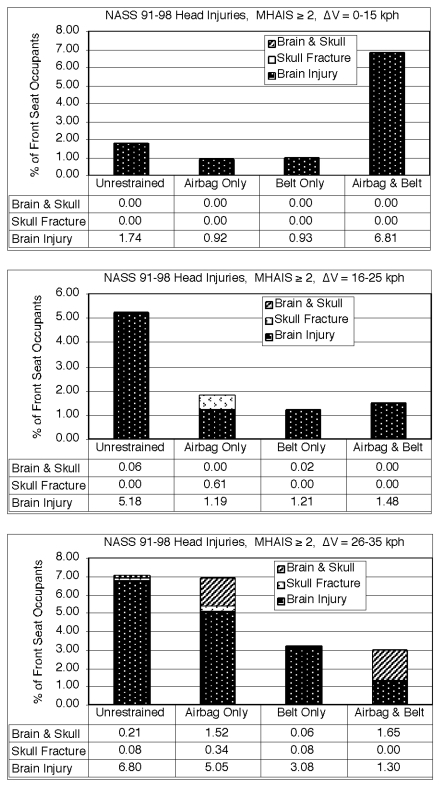
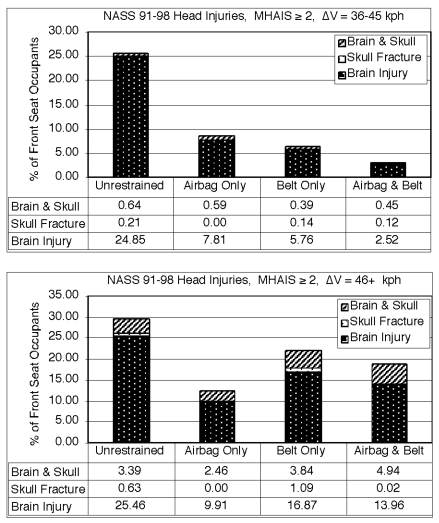
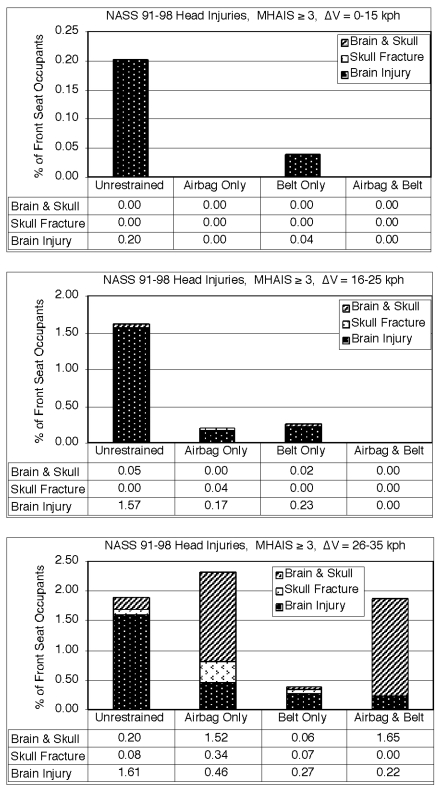
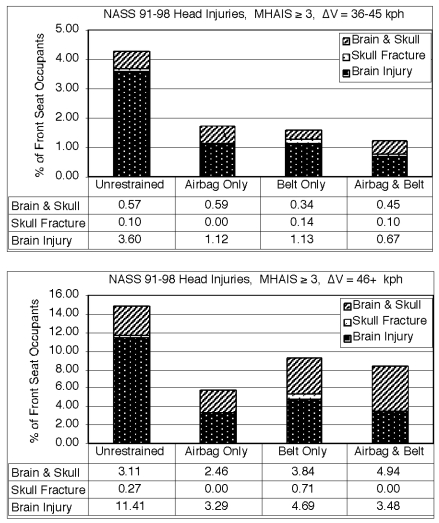
When the injuries were separated into the various ΔV categories, the number of cases in select categories dropped appreciably. Because of unknown or missing ΔV information, the total number of counted occupants for these delineations is also reduced (Table 2). Tables 3, 4, and 5 provide national estimates-weighted data as well as raw data for occupants with only brain injury, only skull fracture, and both brain injury and skull fracture. It could be observed from these tables that there was a far higher percentage of brain-injured occupants without skull fracture compared to the categories with skull fracture. In general, for MHAIS≥2, airbag effectiveness was greatest between 16–45 kph ΔV (Figure 7), and particularly for brain injuries. For the more severe MHAIS≥3 head injuries, the airbag restraint had its greatest effect on brain injuries from 16 kph and higher (Figure 8). For the 26–35 kph category, the weighted numbers for occupants who sustained both brain injury and skull fracture were high. However, these numbers are represented by only one raw case for the airbag only restraint and two raw cases for the airbag and belt restraint group (see Table 3). In general, there were very few motor vehicle occupants who sustained skull fracture. The highest numbers were recorded at crash ΔVs above 35. On a percentage basis, there did not appear to be substantial differences between restraint conditions, although the numbers were all quite small.
Table 2.
Total Occupant Counts for Weighted National Estimates and Raw Data by Crash ΔV. NASS Data Years 1991–1998.
| Unrestrained All Occupants | Airbag Only All Occupants | Belt Only All Occupants | Airbag and Belt All Occupants | ||
|---|---|---|---|---|---|
| ΔV (kph) | Data Type | ||||
| 0–15 | weighted | 182609 | 11014 | 1713004 | 193947 |
| 0–15 | raw | 376 | 31 | 2023 | 356 |
| 16–25 | weighted | 465045 | 28521 | 2289112 | 484725 |
| 16–25 | raw | 1239 | 90 | 4515 | 1019 |
| 26–35 | weighted | 314674 | 13710 | 779170 | 238394 |
| 26–35 | raw | 1227 | 109 | 2626 | 603 |
| 36–45 | weighted | 95294 | 7571 | 206229 | 41536 |
| 36–45 | raw | 693 | 64 | 1028 | 279 |
| 46+ | weighted | 53688 | 4684 | 73389 | 17065 |
| 46+ | raw | 652 | 63 | 729 | 210 |
| Total | weighted | 1111310 | 65500 | 5060904 | 975667 |
| Total | raw | 4187 | 357 | 10921 | 2467 |
Table 3.
Occupants with Only Brain Injury. Number of Occupants with MHAIS≥2 and MHAIS≥3 Head Injuries. NASS Data Years 1991–1998.
| Unrestrained | Airbag Only | Belt Only | Airbag and Belt | ||||||
|---|---|---|---|---|---|---|---|---|---|
| ΔV (kph) | Data Type | MHAIS≥2 | MHAIS≥3 | MHAIS≥2 | MHAIS≥3 | MHAIS≥2 | MHAIS≥3 | MHAIS≥2 | MHAIS≥3 |
| 0–15 | weighted | 3179 | 367 | 101 | 0 | 15958 | 674 | 13215 | 0 |
| 0–15 | raw | 26 | 3 | 2 | 0 | 24 | 3 | 5 | 0 |
| 16–25 | weighted | 24089 | 7306 | 338 | 48 | 27770 | 5187 | 7175 | 19 |
| 16–25 | raw | 116 | 26 | 8 | 1 | 150 | 22 | 27 | 1 |
| 26–35 | weighted | 21385 | 5065 | 693 | 63 | 24003 | 2085 | 3100 | 534 |
| 26–35 | raw | 237 | 58 | 14 | 2 | 184 | 37 | 31 | 8 |
| 36–45 | weighted | 23678 | 3433 | 591 | 85 | 11883 | 2321 | 1046 | 278 |
| 36–45 | raw | 168 | 42 | 9 | 4 | 125 | 45 | 24 | 9 |
| 46+ | weighted | 13668 | 6126 | 464 | 154 | 12381 | 3443 | 2383 | 594 |
| 46+ | raw | 198 | 95 | 11 | 4 | 156 | 61 | 32 | 10 |
Table 4.
Occupants with Only Skull Fracture. Number of Occupants with MHAIS≥2 and MHAIS≥3 Head Injuries. NASS Data Years 1991–1998.
| Unrestrained | Airbag Only | Belt Only | Airbag and Belt | ||||||
|---|---|---|---|---|---|---|---|---|---|
| ΔV (kph) | Data Type | MHAIS≥2 | MHAIS≥3 | MHAIS≥2 | MHAIS≥3 | MHAIS≥2 | MHAIS≥3 | MHAIS≥2 | MHAIS≥3 |
| 0–15 | weighted | 0 | 0 | 0 | 0 | 0 | 0 | 0 | 0 |
| 0–15 | raw | 0 | 0 | 0 | 0 | 0 | 0 | 0 | 0 |
| 16–25 | weighted | 10 | 0 | 174 | 11 | 27 | 0 | 0 | 0 |
| 16–25 | raw | 1 | 0 | 2 | 1 | 1 | 0 | 0 | 0 |
| 26–35 | weighted | 261 | 248 | 47 | 47 | 600 | 532 | 0 | 0 |
| 26–35 | raw | 3 | 2 | 1 | 1 | 5 | 4 | 0 | 0 |
| 36–45 | weighted | 202 | 92 | 0 | 0 | 284 | 284 | 48 | 41 |
| 36–45 | raw | 8 | 2 | 0 | 0 | 2 | 2 | 2 | 1 |
| 46+ | weighted | 338 | 143 | 0 | 0 | 800 | 522 | 4 | 0 |
| 46+ | raw | 8 | 6 | 0 | 0 | 13 | 9 | 1 | 0 |
Table 5.
Occupants with Both Brain Injury and Skull Fracture. Number of Occupants with MHAIS≥2 and MHAIS≥3 Head Injuries. ASS Data Years 1991–1998.
| Unrestrained | Airbag Only | Belt Only | Airbag and Belt | ||||||
|---|---|---|---|---|---|---|---|---|---|
| ΔV (kph) | Data Type | MHAIS≥2 | MHAIS≥3 | MHAIS≥2 | MHAIS≥3 | MHAIS≥2 | MHAIS≥3 | MHAIS≥2 | MHAIS≥3 |
| 0–15 | weighted | 0 | 0 | 0 | 0 | 0 | 0 | 0 | 0 |
| 0–15 | raw | 0 | 0 | 0 | 0 | 0 | 0 | 0 | 0 |
| 16–25 | weighted | 274 | 246 | 0 | 0 | 453 | 453 | 22 | 22 |
| 16–25 | raw | 6 | 5 | 0 | 0 | 5 | 5 | 2 | 2 |
| 26–35 | weighted | 661 | 631 | 209 | 209 | 480 | 433 | 3942 | 3942 |
| 26–35 | raw | 13 | 12 | 1 | 1 | 12 | 11 | 2 | 2 |
| 36–45 | weighted | 610 | 546 | 45 | 45 | 798 | 6709 | 186 | 186 |
| 36–45 | raw | 17 | 16 | 1 | 1 | 20 | 19 | 5 | 5 |
| 46+ | weighted | 1819 | 1669 | 115 | 115 | 2818 | 2818 | 843 | 843 |
| 46+ | raw | 41 | 39 | 3 | 3 | 38 | 37 | 5 | 5 |
Fig. 7.
Bar graph representation of MHAIS≥2 head-injured occupants by restraint type and by crash ΔV. Numbers represent percentage of driver and right front seat passengers under each restraint category for the specific ΔV stated in the plot box.
Fig. 8.
Bar graph representation of MHAIS≥3 head-injured occupants by restraint type and by crash ΔV. Numbers represent percentage of driver and right front seat passengers under each restraint category for the specific ΔV stated in the plot box.
DISCUSSION
The current US DOT NASS database inquiry emphasized the efficacy of restraint systems against brain injury and skull fracture. The data set included both driver and right front seat occupants who experienced a frontal impact in the direction of force ranging from 10 o’clock to 2 o’clock. Initial attempts were made to separate passenger occupants from driver occupants; however, the data set for passenger occupants with head injuries was quite small. The number of right front passenger occupants with head injuries was 39,390 which represents 21% of the total head-injured front seat occupant population. Because of the further breakdown of the data set into occupants with brain injury or skull fracture, as well as by crash ΔV, this passenger population was considered too small to analyze separately. Previous studies evaluating injuries in airbag-equipped vehicles limited analysis to only drivers [Blower et al., 1994; Crandall et al., 1994; Augenstein et al., 1998]. The present study, therefore, appears to be the first analysis that includes the right front seat passenger in the database.
The trends between the head-injured occupant and the injured occupant who was not head-injured were not similar by restraint system. For the head-injured occupant at all injury severity levels (Figures 1, 3, and 5), the belt restrained and airbag- and belt restrained occupant demonstrated consistently less than half the percentage of injuries compared to the unrestrained population. The occupant population restrained by both airbag and belt, in particular, had very low percentages of brain injury. The population of occupants who sustained injuries other than head trauma was examined to study the potential adverse affects of protecting the head. This population of occupants can be considered as those whose head was protected in some way (i.e., no head injury) but who sustained other injuries. For this occupant, belt restraint systems, with or without airbags, demonstrated the lowest percentage of injuries. The airbag and belt combination had its greatest effect at MAIS≥4 injuries (Figure 6). Thus, it may be questionable whether the additional protection provided by the airbag to the head of the occupant is making the same difference toward injury reduction to other body areas. More detailed evaluations of other body regions will need to be conducted to fully answer this question.
For this non-head-injured population, occupants restrained with airbag alone did not demonstrate appreciable differences in percentage of injury compared to the unrestrained population. Blower and Campbell (1994) reported similar findings when evaluating driver injuries for all body regions with NASS data from 1988–1992. They concluded that AIS2+ injury rates for drivers restrained with an airbag alone were similar to rates for unrestrained drivers; the airbag reduced the rate of contact with the steering assembly and pillars/rails in comparison to the unrestrained driver, but saw higher AIS2+ contact rates with glazing and other interior components [Blower et al., 1994]. In another study, Crandall et al. (1994), using 1991 and 1992 NASS data, found a significantly higher probability of injury from windshield contact for the airbag only restraint group compared to the belt only restraint group, although they did not compare their data to the unrestrained population. In NHTSA’s third report to congress (1996) on the effectiveness of occupant protection systems, it was stated that the occupants restrained by airbags alone did not indicate statistically significant differences in injury risk compared to unrestrained occupants. Augenstein et al. (1998), in a study comparing 1988–1996 NASS data to their Trauma Center data, also indicated that airbag-protected drivers show a larger reduction in head injuries compared to the reduction for other bodily injuries. This study, however, did not further quantify the airbag effectiveness for head injuries, as its focus was more on chest injury severity.
The above analysis of crashes without regard to crash ΔV (Figures 1–6) provides more generalized information and additional data points because of the inclusion of unknown or missing ΔV data. When evaluating the numbers under each restraint category, however, there exists a hidden bias against those crashes where an airbag deployed. In general, an airbag does not deploy for crash ΔVs below about 18 kph, whereas a belt system can be used under any crash. This means there is automatically a higher percentage of airbag-deployed crashes that shift toward the higher ΔVs. Therefore, the results for graphs with all ΔVs lumped together could depict lower restraint effectiveness for airbags compared to other restraint categories.
For the analysis of restraint systems by crash ΔV, there was an extremely low number of airbag deployments between zero and 16 kph. Crandall et al. (1994) defined the threshold for airbag deployments at 19 kph to include only those incidents in which “the airbag deployed properly.” In the present data set, there were no reported skull fractures below 16 kph crash ΔV. The very few cases of brain injury for the airbag restrained population at these crash ΔVs were AIS1 and AIS2 level injuries. Dalmotas et al. (1995), in analyzing real-world crash data from Canada, concluded that the crash ΔV threshold for airbag deployment is set too low for the belted occupant. These authors concluded that because of the over 90% belt usage in Canada, the airbag deployment threshold could be raised to reduce the number of injuries caused by the airbag system itself. For crash ΔVs below 26 kph, any restraint system substantially reduced the percentage of head injuries for front seat occupants. In fact, the airbag with belt restraint produced no incidence of MHAIS≥3 brain injury or skull fracture below 26 kph crash ΔV.
The incidence of occupants who sustained skull fracture with or without brain injury was low. The vast majority of these cases occurred under the higher ΔVs (>35 kph). For the relatively rare occurrence of skull fracture in these populations, the presence of a restraint system did not seem to influence the results. Although the causal agents for these skull fractures were not specifically examined, it is well known that the head must strike an object to produce these types of skull fractures. It follows that the relatively severe blows to the head that produce skull fracture can occur with or without the presence of a restraint system an equal percentage of the time. Because this is the first study of which we are aware that evaluated restraint system performance for brain injuries and skull fractures separately, it is difficult to compare to other investigations. In evaluating facial fractures, however, the Crandall et al. (1994) study found no significant trends in the data between restraint system performance.
It can be concluded that brain injury in frontal crashes is substantially reduced with the presence of a restraint system, and that the use of both airbag and belt restraint offers the greatest protection across all ΔV categories. Restraint system effectiveness for the non-head-injured occupant is variable but, generally, the belted occupant sustains the fewest percentage of injury. Skull fractures in frontal impact are relatively rare and the incidence appears to be unaffected by the presence of a restraint system.
(Presenter: Frank Pintar)
Sue Ferguson: You were looking at non-head injury, looking at belt versus airbag plus belt. In the Third Report to Congress, not as much in the Fourth Report, what you really see is a pattern of arm injuries. The AIS 3 arm injuries really heavily weight those data and what you see is that people with airbag deployments are more often getting arm injuries. That’s I think where that comes from and certainly when you took out the AIS 3 injuries, it was gone. So I think that’s what’s causing your effect.
F. Pintar: The arm injuries?
S. Ferguson: Yes, arm injuries. Certainly the earlier airbags caused pretty severe arm injuries to a lot of people. And when you look in NASS, you see much higher percentages of arm injuries to belted people who have airbags than to those who do not have them.
F. Pintar: Yes, I think that population has to be now broken down. I didn’t expect that result, and now that we’re looking at it, we have to break that down to look at some of those other types of injuries that are occurring.
Jeff Crandall: If I saw correctly on your AIS 2+ brain injuries, the 0 to 15 category was higher and then there was a drop down afterwards. I wondered whether you looked at airbag equipped vehicles in those crashes or crashes in which the airbag actually deployed.
F. Pintar: Crashes in which the airbag actually deployed. It is kind of disturbing to have a 0–15 kph airbag deployment, but I didn’t know what to do with that data. It’s very little data, and as you can see from the raw data, it drops down but it’s in the data set.
Mary Pat McKay: Did you apply any statistical analysis to this? I think you presented some very interesting frequency data, but I’m not convinced there’s actually a benefit to airbags plus belts compared to belts alone based on the data you presented.
F. Pintar: I did not do statistical analysis and as far as I’m concerned, I would like to understand better how to do statistical analysis on this type of weighted data. There is a very complex weighting scheme in here and I think the statistics also tend to be very complex. And because I don’t understand it, I didn’t want to stand up here and try to explain it to you. Right now, I looked at both weighted and unweighted data and let that speak for itself. In the future, I agree we have to do some statistical analysis to see if groups are different from each other and by how much.
S. Ferguson: I just wanted to comment again on the head injury. I guess if it is deployments you’re talking about, if you’re comparing vehicles with airbags and vehicles without airbags, and in the one group you’re looking at deployments, then I’m going to guess that the delta V is probably going to be a little higher in that group on average. Did you look at that?
F. Pintar: Yes, when you group all the vehicles together, the airbag deployment group, because they only deploy generally above a certain delta V, are weighted toward that side, that is correct.
S. Ferguson: But certainly in the lowest speed category, I would expect that to be the same also.
F. Pintar: That is correct.
S. Ferguson: The other comment I wanted to make is that when you look at the NHTS A analyses that have been done – the NASS analyses – the only group that they tend to find any statistical effects in is looking at the belt plus airbag versus unrestrained. Again, the NHTSA analyses, when you look at them year to year, there are huge differences and I think we’re still suffering from small sample sizes to be able to look at any of this in NASS. So I really caution anybody trying to look at statistics with this data set. You try to break it down and from year to year, they can have huge variations, and you can have differences of 50–60% in looking at one group or another and there’s no statistical difference because sample sizes are just too small. The take away message is that you can’t do a whole lot with these data.
F. Pintar: I think we’re waiting for more and more data. As I showed in one of the slide the number of airbag equipped vehicles in the fleet has been on the rise and will continue to be on the rise so I think we need to continue to revisit this topic to get enough data to really delineate airbag effectiveness.
ACKNOWLEDGMENT
This study was supported in part by the Department of Veterans Affairs Medical Research. The assistance of William P. Drobac is gratefully acknowledged.
REFERENCES
- Augenstein J, Perdeck E, et al. Injury patterns among airbag-equipped vehicles. 16th International Technical Conference on Enhanced Safety of Vehicles; Windsor, Ontario. 1998. DOT-NHTSA. [Google Scholar]
- Blower D, Campbell K. Comparison of occupant restraints based on injury-producing contact rates. 38th Stapp Car Crash Conference; SAE. 1994. [Google Scholar]
- Crandall J, Kuhlmann T, et al. Differing patterns of head and facial injury with airbag and/or belt restrained drivers in frontal collisions. Advances in Occupant Restraint Technologies: Joint AAAM-IRCOBI Special Session; Lyon, France. 1994. AAAM-IRCOBI. [Google Scholar]
- Dalmotas D, German A, et al. Airbag deployments: Canadian experience. J Trauma. 1995;38(4):476–481. doi: 10.1097/00005373-199504000-00002. [DOI] [PubMed] [Google Scholar]
- Gennarelli T, Champion H, et al. Comparison of mortality, morbidity, and severity of 59,713 head-injured patients with 114,447 patients with extracranial injuries. J Trauma. 1994;37(6):962–968. doi: 10.1097/00005373-199412000-00016. [DOI] [PubMed] [Google Scholar]
- NHTSA. Third Report to Congress: Effectiveness of Occupant Restraint Systems and Their Use. Washington, DC: US Government; 1996. p. 60. [Google Scholar]


