Abstract
An approach to costing of road crash injury has been developed using data from a ‘Willingness-to-pay’ survey mapped to injuries listed in the Abbreviated Injury Scale 1998 Revision. The costs derived have been applied to a database of real-world crash injuries that have been collected as part of the UK Cooperative Crash Injury Study (CCIS). The approach has been developed in order to determine future research priorities in vehicle passive safety. When all injuries in all crash-types are examined, the results highlight the cost of ‘Whiplash’ in the UK. When more serious injuries are considered, specifically those at AIS 2+, the cost of head injuries becomes evident in both frontal and side impacts.
BACKGROUND
The costing of road casualties is a complex and diverse subject since it is necessary to establish ‘what’ costs are being calculated and ‘how’ they have been derived and furthermore ‘what type’ of, if any, economic evaluation they are being used for. The background to the current procedure for calculating the costs of road accidents in Great Britain is described in Hopkin and Simpson (1995).
CASUALTY COSTS
‘Slight’, ‘Serious’ and ‘Fatal’ road crash casualties in the UK are calculated using a consistent approach known as ‘Willingness to Pay’ (Hopkin and O’Reilly, 1993). The underlying theory of the ‘willingness to pay’ approach is that it takes into account what people would be ‘willing to pay’ to reduce the risk of being killed in a road accident. Initially, this approach only took into account ‘Fatal’ injuries (Department of Transport, 1988) but subsequent modifications were made such that a valuation could also be placed upon ‘Slight’ and ‘Serious’ casualties. Casualty costs are calculated by taking into account a number of individual cost elements including the following;
Lost output due to injury calculated as the ‘present’ value of the expected loss of earnings plus any non-wage payments (NI contributions) paid by the employer;Medical costs including ambulance costs and hospital treatment costs;
Human costs based on Willingness to Pay values representing pain, grief and suffering to the casualty, relatives and friends and for fatal casualties, the intrinsic loss of enjoyment of life over and above the consumption of goods and services.
The individual cost per casualty for each of these elements (for 2003) can be seen in table 1 below.
Table 1.
Summary of UK Casualty Costs; 2003
| Casualty related costs (per casualty) | ||||
|---|---|---|---|---|
| Casualty severity | Lost output | Humans costs | Medical and support costs | Total costs |
| Fatal | £451,110 | £860,380 | £770 | £1,312,260 |
| Serious | £17,380 | £119,550 | £10,530 | £147,460 |
| Slight | £1,220 | £8,750 | £780 | £11,370 |
| Average over all casualties | £9,060 | £31,880 | £1,910 | £42,850 |
The UK’s road casualty costs can be derived by multiplying the number of casualties in each category, according to national accident statistics, by the cost for each category (table 2).
Table 2.
Costs of Road Casualties in the UK - 2003
| Casualty Severity | N | Cost (£) | Total cost (£) |
|---|---|---|---|
| Fatal | 3,508 | 1,312,260 | 4,603408,080 |
| Serious | 33,707 | 147,460 | 4,970,434,220 |
| Slight | 253,392 | 11,370 | 2,881,067,040 |
| Total | 290,607 | - | 12,454,909,340 |
The total cost for ‘Fatal’ casualties for 2003 was £4.6 billion, with £4.9 billion for ‘Serious’ casualties and £2.9 billion for ‘Slight’ casualties giving a total cost for road casualties of £12.4 billion.
Whilst this approach is useful in many respects, it is limited in that it is not possible to study the costs of individual injury types and therefore the full evaluations of injury countermeasures are somewhat difficult.
COSTING OF INDIVIDUAL INJURIES
Given that evaluating the economic consequences of road accidents by itself is a multifaceted task, costing of individual injuries adds an extra layer of complexity. The ‘Harm’ approach (Miller, Pindus, Leon and Douglas, 1990; Zaloshnja, Miller, Council and Persaud 2004) does allow some assessment of the cost of individual injuries and this approach has been extensively used by researchers in the US and Australia to assess the likely cost benefits of injury countermeasures. An example of this approach can be found in Morris, Barnes, Fildes, Bentivegna and Seyer (2001) where injury analysis demonstrated that the introduction of an Australian Frontal Impact Regulation (Australian Design Rule ADR/69) decreased injury costs in frontal impacts involving passenger cars by an average of $15,600 (AUD) per driver, largely due to airbag deployments and improved restraint systems. However, for the UK, economic costing of road casualties (fatal, serious, and slight) is based on a ‘Willingness-to-pay’ approach whereas Harm is not. For this reason the Harm tool itself could not be used in its traditional form and an alternative approach to costing of injuries is required.
AIMS AND OBJECTIVES
The objective of this study was to develop a tool similar (although not identical to Harm) that could be used for the purposes of establishing injury prevention priorities in the UK as determined by injury costs in passenger vehicle crashes.
METHODOLOGY
A method for studying the cost of a number of serious injury states is also described in Hopkin and Simpson (1995). In their study, a number of Injury State Descriptors were determined to cover a spectrum of serious injuries ranging from a fractured finger to those involving permanent disability or death more than 30 days after the accident. The descriptors covered different aspects of the consequences of injuries including extent and duration of pain, period of treatment (in hospital or as an out-patient), recovery period and social and professional consequences. These injury state descriptors are shown in table 3.
Table 3.
Injury States as used in UK DfT Injury Costing (Hopkin and Simpson, 1995).
| Injury Code | Injury State Description | Summary Description | % of casualties |
|---|---|---|---|
| F | No overnight stay in hospital (seen as an out-patient); experience slight to moderate pain for 2–7 days followed by some pain/discomfort for several weeks; some restrictions to work/leisure activities for several weeks/months, return to normal health with no permanent disability. | Recover 3–4 months (Out-patient) | 19 |
| W | In hospital 2–7 days in slight to moderate pain; after hospital, some pain/discomfort for several weeks; some restrictions to work and/or leisure activities for several weeks/months; after 3–4 months, return to normal health with no permanent disability. | Recover 3–4 months (In patient) | 13 |
| X | In hospital 1–4 weeks in slight to moderate pain; after hospital, some pain/discomfort, gradually reducing; some restrictions to work and leisure activities, steadily improving, after 1–3 years, return to normal health with no permanent disability. | Recover 1–3 years | 36 |
| V | No overnight stay in hospital (seen as out-patient) moderate to severe pain for 1–4 weeks; thereafter, some pain gradually reducing but may recur when you take part in some activities; some permanent restrictions to leisure and possible some work activities. | Mild permanent disability (Out patient) | 5 |
| S | In hospital 1–4 weeks in moderate to severe pain gradually reducing, but may recur when taking part in some activities; some permanent restrictions to leisure and possibly some work activities. | Mild permanent disability (In patient) | 12 |
| R | In hospital several weeks, possibly several months in moderate to severe pain; after hospital, continuing permanent pain, possibly requiring frequent medication; substantial and permanent restrictions to work and leisure activities; possibly some permanent scaring, | Some permanent disability with scarring. | 13 |
| N | In hospital several weeks, possibly several months; loss of use of legs and possibly other limbs due to paralysis and/or amputation; after hospital, permanently confined to a wheelchair and dependant on others for many physical needs, including dressing and toileting. | Paraplegia/quadriplegia | 2 |
| L | In hospital several weeks, possibly several months due to head injuries resulting in severe brain damage; after hospital, mental and physical abilities greatly reduced permanently; dependant on others for many physical needs, including feeding and toileting. | Severe head injuries | 2 |
In order to derive the monetary value of the injury states, it was then necessary to quantify the value of avoidance of each. Hopkin and Simpson’s approach involved deriving this by calculating a value for each state relative to the injury state of ‘fatality’. A ‘fatality’ state was the maximum state and a monetary value was available for this state which was in part based on the human cost element (over and above the consumption of goods and services) in the derivation given in table 1. Additionally, in order to relate the human costs of non-fatal casualties to the human costs of fatal casualties, a ‘consumption’ component is included above the pure human cost. Consumption is included when drawing comparisons with non-fatally injured casualties since the ability to consume goods and services is seen as part of the enjoyment of life and would therefore be taken into account by respondents in a willingness to pay survey. Thus, the cost associated with the ‘fatality’ state for 2003 was calculated as £860,380 (human costs as in table 1) + £366,261 (estimated consumption costs) = £1,226,641.
Hopkin and Simpson carried out a survey on a limited sample of healthy individuals in which the respondents were asked to provide an estimate of the value of the different serious injury states as a percentage of the injury state of ‘fatality’. The results from this survey were used to apply a value for each injury state relative to the value of death. These figures are as shown in table 4.
Table 4.
Estimates of Relative Value of ‘Serious’ Injury As At 2003 Prices (Hopkin and Simpson, 1995)
| Injury State | % value of death | Value (2003 prices) |
|---|---|---|
| Recover 3–4 months (Out-patient): F | 2.0 | £24,533 |
| Recover 3–4 months (In patient): W | 2.0 | £24,533 |
| Recover 1–3 years (in-patient): X | 5.5 | £67,465 |
| Mild permanent disability (Out patient): V | 5.5 | £67,465 |
| Mild permanent disability (In patient): S | 15.1 | £185,223 |
| Some permanent disability with scarring: R | 23.3 | £285,807 |
| Paraplegia/quadriplegia: N | 100 | £1,226,641 |
| Severe head injuries: L | 100 | £1,226,641 |
| ‘Whiplash’ | £43,604 | |
| Slight injuries | £8,693 |
It was also necessary to determine costs specifically for injuries that were not judged as ‘Serious’ and therefore not covered by one of the injury states (i.e. ‘Slight’ including cuts and bruises and also ‘Whiplash’). These were derived by Hopkin and Simpson (1995) as £8,693 for ‘Slight’ injuries (at 2003 prices) and £43,604 for ‘Whiplash’. These values are as shown in table 4.
However, although a value for these injury states can be calculated, the cost of an individual injury type (for example a skull fracture or a ruptured spleen) cannot be calculated according to this model. Therefore, for the purposes of the current study, it was deemed necessary to map individual trauma injuries to the injury states. The trauma injuries that were mapped to the injury states were those listed in the Abbreviated Injury Scale 1998 revision (AAAM, 1998). The mapping was undertaken by 2 independent groups of Medical Researchers who determined an appropriate injury state for each of the injuries that were sustained by survivors of car crashes between 1998 and 2005. It is acknowledged that this method is somewhat limited since it does not take into account occupant characteristics or variations in medical treatment and emergency response times etc.
The results were calibrated between the two groups of researchers. Data for these injuries were gathered as part of the UK Co-operative Crash Injury Study (CCIS). The CCIS data use a stratified sampling criterion to identify crashes to be investigated. 100% of ‘Fatal’, 80% of ‘Serious’ and 10–15% of ‘Slight’ injury crashes (according to the UK Government’s accident classification) that occur within specified geographical regions throughout the UK are investigated. The sampling criteria also specify that injury must have occurred in at least one car that was at most 7 years old at the time of the accident. The CCIS data can be weighted in order to address the sampling bias towards ‘Serious’ injury outcome so that they were deemed representative of the population of all injury crashes involving cars 7 years old or younger in the United Kingdom.
In total, some 300 individual injuries (rated from AIS 1 to 5) were mapped to one of the injury states. All AIS 1 injuries (with the exception of cervical, thoracic and lumbar spine strains which were classified as ‘Whiplash’) were valued as ‘Slight’ injuries.
Therefore, each of the AIS injuries that were subjected to the mapping process was allocated an injury cost depending on the determined injury state. An analysis of the data was then undertaken to establish injury costs for different body regions in order to ascertain which injury types among those received by car occupants in traffic crashes are most costly.
DATA WEIGHTING
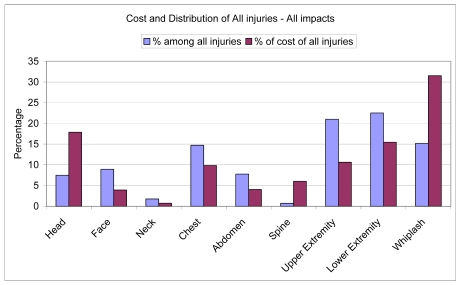
The sampling bias within the data has implications within the analysis and subsequent results. When all injury severities are considered (Figure 1) a weighted data set has been used in order to address the bias towards ‘Serious’ injury outcome in the CCIS data so that the data represent the true proportions of ‘Slight’/’Serious’/’Fatal’ accidents occurring within a given time frame. Weighting factors are calculated as: “The number of accidents of a given severity in a sample region during a quarter of a year notified to the CCIS investigating teams divided by the number of these accidents sampled within the CCIS database”.
Figure 1.
Records of the number of notifications are only available for two of the CCIS sampling regions and so the weighting factors have only been calculated for these regions. This analysis uses a reduced sample of the CCIS data but reflects the true accident severity ratio within these regions. Under the assumption that the accident situation within these two regions is indicative of the UK national accident population, then these results could be seen as nationally representative.
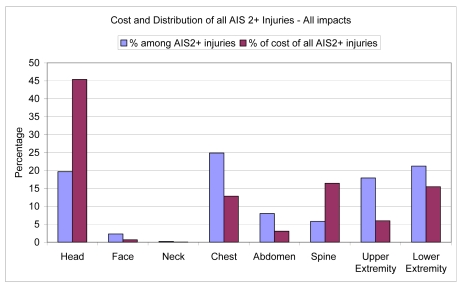
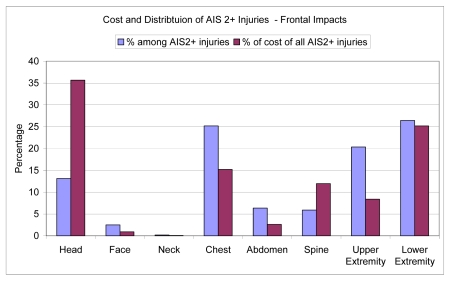
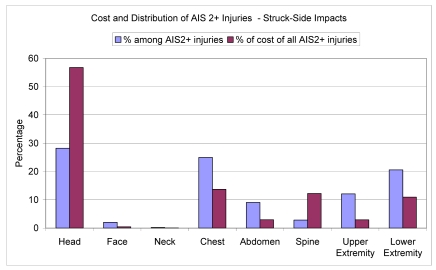
When AIS 2+ injuries only are considered (Figures 2, 3 and 4) un-weighted data is used in order to retain the diversity of injury types within the data. An analysis of more severe injuries does not suffer from the same sampling bias issues as an analysis of all injury severities.
Figure 2.
Figure 3.
Figure 4.
RESULTS
The data are presented so as to illustrate both the frequency (as a proportion of all injuries) and the cost (as a proportion of the total cost) of injuries to each body region.
Another important aspect of the data is that only information on ‘newer’ model cars was used is the study. CCIS crash-data are available back to 1983 when the study first began but as one of the main objectives of this study was to develop a tool with which to prioritise future secondary safety research, it was considered that only information on cars manufactured after 1998 would be of importance in determining current design problems.
Figure 1 shows the results when all crash modes and all injury severities are considered. As can be seen from the figure, ‘Whiplash’ is by far the most costly injury involving 31% of the total cost though accounting for only a little over 15% of all injuries. It should be noted that the underlying assumptions associated with the derivation of the cost for an individual ‘Whiplash’ injury (Hopkin et al 1995) may have resulted in an over-inflated cost for this injury type. Injuries to the upper and lower extremities together account for 26% of the total cost but 43% of the injuries sustained.
Figure 2 shows a revised analysis of costs where ‘Slight’ injuries and ‘Whiplash’ have been discounted. Thus only more severe injuries (AIS2+) are considered. Injuries to the extremities (upper and lower combined) are the most common followed by those to the chest then those to the head. However, when costs are considered, it is clear that head injuries are by far the most costly.
Figure 3 shows the analysis for AIS 2+ injuries to front occupants in frontal impacts. Again, ‘Whiplash’ and ‘Slight’ injuries are excluded from the analysis so that the proportional representation of ‘Serious’ injuries to the various body regions among the total cost of ‘Serious’ injuries can be determined. In the case of frontal impacts, it can be seen that lower extremity injuries followed by chest injuries form the largest proportions of AIS 2+ injuries.
Figure 4 shows a comparable analysis to that presented in Figure 3 only this time struck-side impacts are considered. As can be seen from the figure, whilst both head and chest injuries are comparable in frequency, head injuries are by far the most costly.
DISCUSSION
The methodology presented in this paper has demonstrated the application of a cost model based on the UK preferred ‘Willingness to Pay’ model. The model facilitates the ability to cost individual injury types according to the AIS coding scale. Unlike HARM, these derived costs are more directly applicable to accidents within the UK since the values assigned to injury states are based upon UK economic and societal costs. Previously much analysis related to injury/accident costs within the UK has been limited to the UK government’s calculated cost of an overall ‘Slight’/’Serious’/’Fatal’ injury outcome. The derivation of individual injury costs using Hopkin and Simpson’s Injury State derivations allows more developed analysis to be carried out on specific injury types in specific crashes involving specific vehicles though the benefit and application to many other research areas can be seen.
Though a working method has been developed, some limitations were apparent as the work progressed. The initial study carried out by Hopkin and Simpson was based on responses from a relatively small sample and the survey could be repeated on a larger scale, enhancing the robustness of the results. Also, having been through the process of assigning injury types to the defined injury states, a finer categorisation including a broader spread of injury states and additional descriptors would prove useful. The limited number of injury states also limits the sensitivity of the derived estimates for the purposes of injury countermeasure evaluation. Finally, the cost associated to an individual ‘Whiplash’ injury seems relatively high among ‘Slight’ injuries and in the light of much current research in this area, this could be revisited.
These limitations aside, an analysis of the CCIS database highlights the financial burden of ‘Whiplash’ injuries in the UK. When these are removed from the analysis and AIS2+ only injuries are considered, injuries to the head are the most costly in both frontal and side impacts. However, the high costs of head injuries (compared to the relative frequency of such injuries) are observed since in many cases, those afflicted require long-term or permanent health-care and are left with severe irreversible brain damage and are therefore costed equivalent to fatality (Table 2). The same applies for severe injuries to the spine especially where partial or full transection of the cord occurs.
Lower extremity injuries are the third most costly of all AIS 2+ injuries. Whilst severe head and spine injuries are associated with a high mortality rate this is not the case for lower extremity injuries. Road trauma survivors who suffer a severe leg injury are likely to have long term consequences and a loss of quality of life. Long term implications of extremity (particularly lower limb) injuries should not be underestimated particularly as more occupants begin to survive high energy crashes; consequences extend beyond the physical impairment with frequently associated psychological problems and drastic but necessary changes in quality of life (Dischinger 2004, Barnes 2006). This personal cost together with the societal financial burden indicates a real need to consider further the nature and cause of such extremity injuries together with measures for injury mitigation.
Future work is clearly indicated as a result of this study. First of all, there would be clear benefit from improving the method of mapping individual AIS injuries to the injury states, This by itself is twofold; first of all, there is a need for an increased number of injury states since the 8 categories limit the accuracy of the mapping process. Secondly, the procedures for mapping could be improved to include greater medical expertise and inclusion within the model of a capability to take into account individual characteristics such as age, weight and gender etc.
CONCLUSIONS
The conclusions of this study are as follows;
An injury cost model has been developed that can be used for determining road crash injury prevention priorities;
The model uses information from the Abbreviated Injury Scale (1998 Revision) mapped onto a number of injury states of differing severity;
The injury states could be expanded somewhat to allow further classification of injury and therefore cost;
When all crashes and injuries of all severities are considered, this study highlights the importance (in terms of cost) of ‘Whiplash’;
When only AIS2+ injuries are considered in frontal and side impacts, head and lower extremity injuries are important subsets of injuries.
ACKNOWLEDGEMENTS
The authors would like to acknowledge the financial support of the Department for Transport.
This paper uses accident data from the United Kingdom Co-operative Crash Injury Study. CCIS is funded by the Department for Transport (Transport Technology and Standards Division), Autoliv, Daimler-Chrysler, Ford Motor Company, Nissan Motor Europe, and Toyota Motor Europe.
Further information on CCIS can be found at http://www.ukccis.com/
REFERENCES
- Association for the Advancement of Automotive Medicine. The Abbreviated Injury Scale. 1998 1998 Revision. [Google Scholar]
- Barnes JS. Faculty of Science. Loughborough University; Loughborough, UK: 2006. An Exploratory Study of Road Crash Survivors: Injury Outcomes and Quality of Life PhD Thesis. [Google Scholar]
- Department of Transport. Valuation of Road Accident Fatalities. Department of Transport; London: 1988. [Google Scholar]
- Department for Transport. Road Casualties Great Britain 2003: Annual Report. Department for Transport; London: 2003. [Google Scholar]
- Dischinger PC, Read KM, Kufera JA, Kerns TJ, Burch CA, Jawed N, Ho SM. Consequences and Costs of Lower Extremity Injuries. Proceedings of the 48th Annual Conference, Association for the Advancement of Automotive Medicine; Florida. 2004. [PMC free article] [PubMed] [Google Scholar]
- Hopkin JM, O’Reilly DM. Revaluation of the Cost of Road Accident Casualties: 1992 Revision. Transport Research Laboratory; 1993. TRL Research Report 378. [Google Scholar]
- Hopkin JM, Simpson HF. Valuation of Road Accidents. Transport Research Laboratory; 1995. TRL Report Number 163. [Google Scholar]
- Miller TR, Pindus NM, Leon TS, Douglass JB. Motor Vehicle Injury Costs by Body Region and Severity. Proceedings of the 34th Annual Conference, Association for the Advancement of Automotive Medicine; Scotsdale, AZ. 1990. [Google Scholar]
- Morris Barnes J, Fildes B, Bentivegna F, Seyer K. Effectiveness of ADR 69: A Case-Control Study of Crashed Vehicles Equipped with Airbags. Australian Transport Safety Bureau; 2001. Monash University Accident Research Centre Road Safety Research Report CR 199. [Google Scholar]
- Zaloshnja E, Miller T, Council F, Persaud B. Comprehensive and Human Capital Crash Costs by Maximum Police-Reported Injury Severity within Selected Crash Types. Proceedings of the 48th Annual Conference, Association for the Advancement of Automotive Medicine; Florida. 2004. 2004. [PMC free article] [PubMed] [Google Scholar]


