Abstract
This paper reports the findings of a study of younger and older driver behaviour to hazardous traffic manoeuvres in a driving simulator. Hazardous situations on a highway and residential drive were studied and drivers’ vision and vehicle performance responses were collected. While all drivers were able to avoid crashes, the finding that older drivers were consistently slower to fixate hazardous stimuli in the driving environment and were slower to respond presents a potentially serious road safety concern. Further research is warranted, especially under conditions of increasing traffic complexity.
OLDER DRIVERS are not particularly over-represented in terms of the number of crashes on the roads but their risk of being involved in a fatal or serious injury crash is higher (Evans 1991; OECD 2001; Charlton et al 2002), especially for those aged 75years and older. Some have argued that this increase in risk only applies to a subset of older drivers; those who have a low annual mileage (Harkemes-Blomqvist et al 2002; Langford et al 2006), although this might simply reflect poor health status for this cohort. Nevertheless, with a predicted ageing population, it is important to understand sensory and behavioural differences between older and younger drivers on the road to identify interventions to reduce their risk of serious injury in a crash.
Safe driving requires effective visual functions as well as cognitive skills. These include the ability to understand and remember traffic rules and signs, follow directions, utilise executive functions, allocate attention, process information quickly and accurately, and minimise the effects of distraction. Owsley and her colleagues described the driving task as a “visually cluttered array” involving both primary and secondary visual tasks, which requires use of both central and peripheral vision simultaneously. Furthermore, the driver is frequently unaware of where and when a significant visual event may occur (Owsley, et al, 1991).
Very little research, however, has been undertaken to examine differences in visual strategies and competencies between younger and older drivers. Szlyk et al (1995) reported that older drivers, regardless of their visual status, had an increased number of eye movements, and drove more slowly than the younger drivers when tested in a driving simulator. Pradhan et al (2005) showed that experienced drivers were more likely to look at risky features of the driving scenarios than younger and novice drivers in a simulated driving task. However, this finding was based on driving responses rather than a detailed analysis of fixation patterns.
While some early research documented age-related differences in visual search patterns of drivers, few have studied differences in visual search over time when driving, or how they might interact with age in negotiating hazards while driving. This paper describes the visual search patterns and driving performance of older and younger drivers over time in a simulator-based driving task, and is part of an ongoing investigation of visual scanning behaviour of young and older drivers.
METHOD
The high-level driving simulator located at Monash University was used to assess driving performance. The simulator is a stationary full-sized sedan on a motion platform with full vehicle controls. Four projectors provide 180° front view and 60° rear view graphics of the road scene, with a sound system providing usual road noise.
Three separate drives were used, all set in daylight conditions and on bitumen roads. The first drive was a familiarisation drive, the second a rural (highway) drive and the third a residential drive. The speed limit throughout the highway drive was 80km/h and 60km/h for the residential drive. Road included single lanes in each direction and well as undivided dual lanes in both directions.
Stimulus Materials
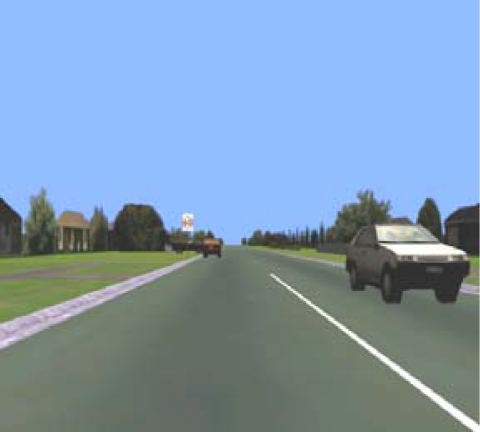
Five highway and 6 residential hazards were programmed for display in the simulator experiment; a typical residential hazardous event is shown in Figures 1 and 2 below. Descriptions of all these hazardous events are listed in Table A1 in the Appendix.
Fig 1.
Residential hazard 7 – a vehicle is stopped at the roadside and a parked vehicle starts to pulls out from a driveway as the participant approaches.
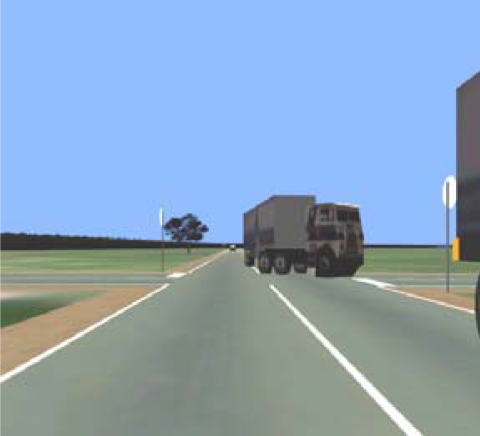
Fig 2.
Highway hazard 4 - One truck is parked on shoulder of the right lane, a second truck in oncoming traffic turns left, encroaching on the participant’s lane;
Test Procedure
A total of 45 participants participated in the study including 25 older driver (OD) aged 65–75 years and 20 younger drivers (YD) aged 25–35 years. All had self-reported normal or corrected-to-normal vision, and were screened (by self-report) for epilepsy, medical conditions and medications with known associations with crash risk. Participants were tested for cognitive status using Trail-Making Test (Trails A and B), the Motor-Free Vision Perception Test (MVPT) and the Months Backwards (the 6-item Short Blessed Test).
Each participant completed a pre- and post-drive questionnaire, designed to collect demographic information and details about their driving experience (including average weekly driving distance) and their experience in the simulator, in particular, whether they had experienced any discomfort with the simulator. Presentations of the urban and rural drives were counterbalanced across participants.
Eye Movements
Eye-tracking was measured using the FaceLAB© system, Version 2, by Seeing Machines, Australia. Two unobtrusive cameras were located on the dashboard and calibrated for angles and depth of the seated driver in order to establish movement parameters of the eyes and head in three dimensions. Camera images of the participant were linked to visions of the road ahead through a user-operated computer interface. The system is designed to recognise and track facial features and markers placed on the drivers face, including the iris, pupil and eyelids.
Performance Measures
For each of the events in the highway and residential driving scenarios, an arbitrary start and end time was determined and measures of driving performance and visual scanning patterns were recorded. Three key driving measures were analysed here for each of the events: mean speed and speed variability (standard deviation of speed) and brake response time. In addition, for more detailed analyses of specific events, other driving data including acceleration and lane maintenance were derived from the vehicle recordings. FaceLAB measures included time to first fixate the target/hazard (gaze vector intersects coordinates of target), gaze duration, and percentage of total gaze time for key parts of the driving environment (road ahead, peripheral, target and the speedometer).
RESULTS
To investigate potential differences between the two age groups of participants, independent groups t-tests were conducted for each dependent variable. Alpha level was set to 0.05 for all dependent variables. The number of cases available for analyses varied across the different events due to attrition from simulator discomfort or missing FaceLAB data. In addition, Pearson Product correlations were conducted to examine the association between performance on cognitive tasks and driving and vision measures. Results reported here are based on 19-OD and 18-YD (attrition rates are due to simulator discomfort or missing FaceLAB data).
Age Differences
The groups differed in their average driving experience (50 years versus 10 years) (t=−27.4, df=37, p<0.0001) but not weekly driving exposure (approx. 250 kilometres per week) (t=0.21, df=37, p=0.83).
Highway Drive Results
The driving performance results for the highway drives are shown in Table 1 for the speed and time-to-brake responses.
Table 1.
Highway driver responses for older (OD) and younger (YD) drivers across scenarios
| Task | Speed (Km/h) | Time to Brake (secs) | |||||||
|---|---|---|---|---|---|---|---|---|---|
| Mean | SD | t | df | Mean | SD | t | df | ||
| 1a | OD | 43.9 | 6.8 | −0.77 | 35 | 4.2 | 2.4 | 1.40 | 35 |
| YD | 45.4 | 4.7 | 3.3 | 1.3 | |||||
| 1b | OD | 41.0 | 8.4 | −1.75 | 34 | 4.1 | 2.2 | 1.78 | 34 |
| YD | 45.0 | 5.1 | 3.4 | 1.2 | |||||
| 2 | OD | 40.8** | 16.5 | −2.63 | 35 | 1.3 | 1.6 | 0.86 | 35 |
| YD | 54.6 | 15.5 | 0.8 | 1.9 | |||||
| 3 | OD | 48.1** | 12.4 | −3.53 | 36 | 3.4 | 5.0 | −1.18 | 36 |
| YD | 61.1 | 9.7 | 6.0 | 7.8 | |||||
| 4 | OD | 69.1 | 16.7 | 0.60 | 29 | 0.22 | 0.6 | −0.50 | 29 |
| YD | 65.7 | 15.0 | 0.3 | 0.7 | |||||
p<0.05
p<0.01
Both groups of drivers maintained an average speed considerably slower than the 80km/h limit. For Events 2 and 3, older drivers drove significantly slower than younger drivers, with differences being approximately 13 km/h for both Events. For Events 1a, 1b and 4, the average driving speeds for the two groups did not differ significantly. Standard deviations in speed did not differ significantly across the two groups for Events 1, 2 and 4 (not shown) although older drivers showed significantly greater variability in speed than younger drivers for Event 3. No age group differences were observed in braking responses.
Visual Fixation
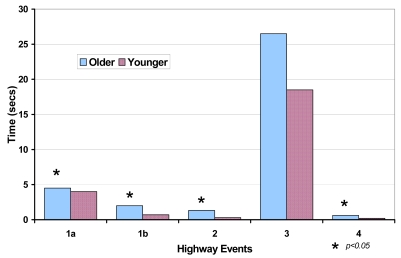
For the highway drives, there was a tendency for older drivers to fixate on the target later than younger drivers (see Figure 3). The group differences were significant for Events 1a, 1b, 2 and 4 [t(32)=2.759, p=0.011; t(34)=2.942, p=0.007; t(35)=2.852, p=0.01; t(29)=2.089, p=0.049, respectively]. For Event 3, the same trend was evident, although the effect failed to reach significance (p=0.093). To identify any group differences between the older and younger drivers in the direction of gaze within the driving environment, gaze vectors were identified in four key areas; target, road ahead, peripheral, and speedometer. Percentages of time fixating on each of the elements were calculated for all of the scenarios (Table 2).
Fig 3.
Time taken to fixate on target for Highway drive events
Table 2.
Percent of time fixated on the elements of the 5 scenarios for older drivers OD and younger drivers YD for the highway drive.
| Element | Event 1a | Event 1b | Event 2 | Event 3 | Event 4 | |||||
|---|---|---|---|---|---|---|---|---|---|---|
| OD | YD | OD | YD | OD | YD | OD | YD | OD | YD | |
| Target | 6 (4) | 5 (3) | 29 (19) | 31 (11) | 20 (15) | 34* (19) | 13 (11) | 12 (8) | 30 (26) | 34 (18) |
| Road Ahead | 47 (31) | 53 (24) | 25 (19) | 32 (17) | 30 (26) | 34 (22) | 32 (22) | 46* (20) | 33 30) | 41 (18) |
| Peripheral | 38 (31) | 1 (15) | 35 (28) | 22 (13) | 40 (31) | 22* (21) | 37 (22) | 25 (17) | 23 (29) | 10 (20) |
| Speedometer | 7 (12) | 18 (22) | 10 (17) | 13 (14) | 7 (14) | 6 (8) | 10 (12) | 14 (16) | 12 (27) | 14 (13) |
Differences between groups were significant at p<.05 Figures in parentheses refer to the SD for these recordings
In Event 2, younger drivers spent proportionately more time looking at the target than older drivers (t(35)=−2.497, p=0.017). In addition, older drivers spent almost twice as long looking at areas peripheral to the road than younger drivers (t(35)=2.076, p=0.045). For Event 3, younger drivers spent proportionally more time looking at the road ahead compared to older drivers (t(36)=−2.019, p=0.05). There was also a trend showing that older drivers spent more time looking at areas peripheral to the road compared to younger drivers, but this failed to reach significance (p=0.083). In Events 1a and 1b, the same trend was evident (p=0.067, p=0.084, respectively).
Analyses were also undertaken to investigate the relationship between driving performance and visual scanning in the highway drives (not shown here). For Events 1a, 1b and 4, there was a significant association between captures and brake time among drivers, where younger drivers saw the target later and also applied the brakes later.
Residential Drive Results
The driving performance results for the residential drives are shown in Table 3 where during the residential drive, both groups maintained an average speed lower than the 60km/h limit (results from Events 10 and 11 are not presented here due to insufficient data available). With the exception of Event 8 (p=0.339), older drivers generally drove significantly slower than younger drivers (differences 6–10 km/h) (Event 6: t(34)=−5.422, p< 0.001; Event 7a: t(32)=−3.944, p< 0.001; Event 7b: t(32)=−3.858, p<0.001; Event 9: t(34)=−2.487, p=0.021; Event 9b: t(33)=−2.905, p=0.007). Interestingly though, in Event 8b, older drivers did drive slightly faster than younger drivers, although the difference, while significant, was less than 5 km/h (t(32)=3.014, p=0.005).
Table 3.
Residential driver responses for Older (OD) and Younger (YD) drivers across scenarios
| Task | Speed (Km/h) | Time to Brake (secs) | |||||||
|---|---|---|---|---|---|---|---|---|---|
| Mean | SD | t | df | Mean | SD | t | df | ||
| 6 | OD | 28.7 | 12.9 | −5.42 | 34 | 2.54 | 1.65 | −1.36 | 34 |
| YD | 39.4 | 14.1 | 3.33 | 1.80 | |||||
| 7a | OD | 38.5** | 8.6* | −3.94 | 32 | 6.13 | 3.71 | 1.20 | 32 |
| YD | 46.5** | 5.4* | 4.65 | 3.45 | |||||
| 7b | OD | 34.9** | 8.4** | −3.86 | 32 | 1.69 | 1.52 | 1.30 | 32 |
| YD | 43.9** | 4.4** | 1.08 | 1.14 | |||||
| 8a | OD | 47.9 | 6.9 | −0.98 | 32 | 6.13* | 11.39 | −2.72 | 32 |
| YD | 48.9 | 7.0 | 17.3* | 12.60 | |||||
| 8b | OD | 47.7** | 5.0 | 3.01 | 29 | 1.88 | 2.19 | −0.64 | 29 |
| YD | 43.5** | 6.5 | 2.31 | 1.41 | |||||
| 9a | OD | 35.7* | 18.1 | −2.49 | 34 | 6.75 | 2.02 | −0.42 | 34 |
| YD | 41.7 | 15.6 | 7.05 | 2.16 | |||||
| 9b | OD | 24.4** | 12.4 | −2.90 | 33 | 1.20 | 0.84 | −0.25 | 33 |
| YD | 32.6** | 12.8 | 1.28 | 1.14 | |||||
p<0.05
p<0.01
Standard deviations in speed did not differ significantly across the two groups for Events 6, 8a, 8b, 9a and 4b (p=0.069 to 0.954). However, for Events 7a and 7b, older drivers did show significantly greater variation in speed than younger drivers (t(32)=2.757, p=0.010, t(32)=4.472, p<0.001, respectively). The Table also shows that older drivers initiated braking significantly earlier in Event 8a (t(32)=−2.717, p=0.010). A slower speed can mitigate the urgency of braking in some circumstances; however, in Event 8a group differences in mean speed were minimal. No other group differences in braking times were significant (p=0.184 to 0.806).
Visual Fixation
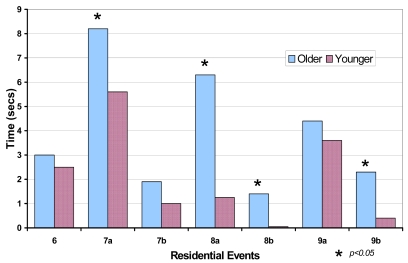
Results for the visual scanning are described below for the residential drives. Figure 4 shows the time to first fixate the target or hazard for each of the residential driving events, where older drivers tended to first fixate on the target later than the younger ones. For example, in Event 7a, the older group took an average of 8.2 seconds to fixate on the target, whereas the younger participants saw the target 5.6 seconds from the start of the event. Group differences were significant for Events 7a, 8a, 8b and 9b (t(32)=2.784, p=0.011; t(32)=2.255, p=0.039; t(29)=2.217, p=0.045; t(33)=2.931, p=0.008, respectively). No others though were significant (p=0.280 to 0.464).
Fig 4.
Time taken to fixate on events during the residential drive
Table 4 shows the percent of time that older and younger drivers spent fixating on elements of the driving scenarios during the residential drive.
Table 4.
Percent of Time Fixated on Elements of the Scenarios for Older Drivers(OD) and Younger Drivers (YD) in the residential drive.
| Event 1 | Event 2a | Event 2b | Event 3a | Event 3b | Event 4a | Event 4b | ||||||||
|---|---|---|---|---|---|---|---|---|---|---|---|---|---|---|
| OD | YD | OD | YD | OD | YD | OD | YD | OD | YD | OD | YD | OD | YD | |
| Target | 36 (17) | 39 (18) | 25 (18) | 44 (19) | 37 (24) | 64* (26) | 43 (31) | 58 (27) | 51 (32) | 66 (25) | 30 (17) | 29 (12) | 36 (22) | 33 (13) |
| Road Ahead | 26 (21) | 33 (18) | 34 (22) | 31 (11) | 18 (15) | 13 (12) | 7 (7) | 6 (4) | 5 (9) | 7 (5) | 28 (23) | 37 (16) | 24 (21) | 31 (11) |
| Peripheral | 25 (25) | 18 (22) | 28 (23) | 21 (23) | 31 (25) | 20 (24) | 30 (26) | 19 (17) | 23 (26) | 19 (18) | 25 (25) | 23 (16) | 27 (27) | 27 (18) |
| Speedo | 11 (20) | 7 (6) | 12 (22) | 3 (2) | 13 (25) | 2 (3) | 13 (18) | 14 (17) | 18 (27) | 6 (9) | 15 (21) | 9 (7) | 12 (20) | 6 (6) |
Differences between groups were significant at p<.01
Group differences were evident only for Events 7a and 7b, where older drivers were found to spend a significantly lower percentage of the total event gaze time looking at the target/hazard (t(32)=−2.99, p=0.005; t(32)=−3.11, p=0.004, respectively). For example, in Event 7b, the younger drivers fixated on the target for 64 percent of the total event time (SD 26%), whereas the older drivers looked at the target for 37 percent of the time (SD 24%). Older drivers also spent more time fixating on the speedometer during events 7a and 7b, although these differences were not significant (p=0.090). Overall, there was a high level of variability in looking behaviour. Variability was particularly high for older drivers compared with younger drivers for the relative time spent looking at the speedometer.
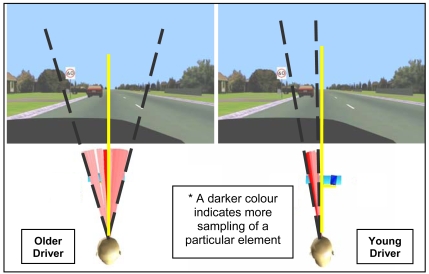
Group differences in gaze patterns were explored more fully. Indicative of these results are the findings for Event 7 that revealed that over the course of the event, the older and younger drivers had different fixation patterns.
The results in Figure 5 show that over the course of the event, the older and younger drivers had different fixation patterns. The eye tracking data indicate that from the start of the event until the ‘hazard vehicle’ is passed, younger drivers spent more time fixating the target than older drivers. Interestingly, when approaching the target, younger drivers spent most of their time scanning the peripheral left of the roadway, that is, generally around where the target was located. In contrast, older drivers seemed to distribute their fixations more broadly across the road and periphery, with peaks first located to the right periphery and to the left periphery as they neared the target and remained on the left until well past the hazard vehicle. They also had a peak in fixations on the speedometer on approach to the speed sign, which was not observed in the younger drivers.
Fig 5.
Gaze Vector Directions for OD and YD for Residential Event 7.
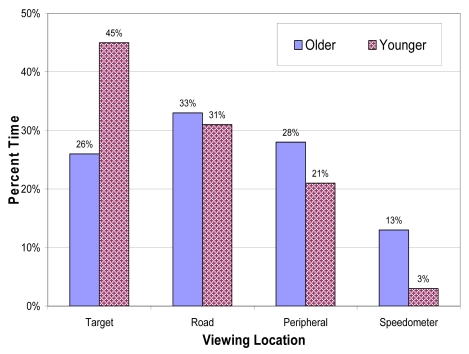
Figure 5 shows the results of viewing time by key locations for the residential event 7 where a vehicle starts to back out but then stops. Of importance, older drivers spent significantly less time looking at the hazard (r=0.418, p<.05) and more time looking at the speedometer (r=0.434, p<.05).
DISCUSSION
The findings from this research program highlighted interesting differences between younger and older drivers in their visual patterns and strategies while driving. Specifically, older drivers demonstrated a delayed fixation on hazards, a broader visual scanning pattern, and spent less time looking at the hazard relative to younger drivers. Older drivers were more likely to divide their total looking time across areas of the driving environment both inside the car (speedometer) and outside the vehicle (from peripheral left to peripheral right) than their younger counterparts. These findings in driving speed and visual search patterns were somewhat consistent with limited previous research in this area (Maltz and Shinar, 1999; Pradhan et al, 2005; Szlyk et al, 1995).
A possible explanation for differences between these two age groups might reflect different driving strategies adopted by older drivers to compensate for age-related changes in functional abilities for driving (Oxley et al., 2003). For example the broader scanning patterns adopted by older drivers may be an adaptive strategy for restricted visual fields. By adopting a more broad scanning approach (as indicated in Figure 5), the older driver might be able to overcome reductions in the resolution of fine detail and rely more on dynamic cues for avoiding hazardous situations.
Of interest also was the finding that drivers with poorer cognitive abilities tended to be slower in directing their gaze towards critical hazards and drove at slower speeds (see Koppel, et al, 2006, for more details). This could represent a deliberate cautious, self-regulatory strategy to compensate for slower responses. However, speed reduction in itself, may not be sufficient compensation to avoid hazards in all driving situations. Despite the fact that older drivers have delayed fixations on hazards, an important element was that older drivers appeared able to take appropriate action to avoid the hazard.
Older drivers generally were slower at identifying the approaching hazard than were younger drivers but then braked much earlier than younger participants did. Again, reductions in cognitive capacity might explain this interesting finding as older people generally experience greater difficulty in memory and attentional skills and hence might be rushed into making a decision to brake ahead of where they really needed to (again, these results are described in detail in Koppel et al, 2006). If this is correct, it has consequences for their safe driving as it could well put them in a position of vulnerability in certain situations. Further research is warranted to confirm if this finding is robust.
Finally, there was an over-emphasis among the older drivers in looking at the speedometer in a number of the hazardous events. For instance, older drivers spent 13% of the time while negotiating Event 7 looking at the speedometer, compared with only 3% for younger drivers. This meant they spent a little more than half the equivalent time looking at the hazard than younger drivers did. This may reflect a greater emphasis among older drivers to speed control (especially as there was a speed limit sign in the vicinity) or it could be an artifact of the simulator environment itself.
Limitations
The use of the Monash simulator and FaceLAB technology did provide an excellent opportunity to examine the phenomenon of interest through the measurement of visual tasks and strategies employed by the drivers. However, it should be recognized that there are limitations with this study approach that need to be recognised.
The degree to which simulated driving performance is representative of real world driving responses is unclear. Further research is warranted to demonstrate their degree of concordance.
Simulator discomfort does affect older drivers to some degree and is disproportionate. This might indicate that older drivers have more difficulty adapting to the simulated environment than their younger counterparts.
Eye-tracking data can only provide limited indications about the drivers’ focus of attention on specific events or hazards while driving. The driver may fixate on elements in the driving environment without attending to that information.
CONCLUSIONS
This research has described in detail the visual search patterns of young and older drivers with reference to the timing, location and duration of visual fixations during a simulated hazardous driving task and the associated driving responses. While all drivers were able to avoid crashes, the finding that older drivers were consistently slower to fixate hazardous stimuli in the driving environment and that their in-vehicle responses were quite different to those of their younger counterparts presents a potentially road safety concern. It will be important to investigate this finding further under conditions of increasing traffic complexity to test further this hypothesis.
Fig 5.
Percent of time looking at key locations for residential event 7
ACKNOWLEDGEMENTS
This research was sponsored by General Motors Holden in Australia and the authors are grateful to them for allowing the publication of this work. We acknowledge the participants who willingly agreed to participate in the experimentation. The views expressed are those of the authors and do not necessary represent those of either GM Holden or Monash University.
Appendix A
Table A1.
Description of Hazardous events – hwy and residential drive
| Highway drive | |
|---|---|
| Task | Description |
| 1a | Participant approaches unsignalised intersection; vehicle enters intersection from the right, failing to yield; |
| 1b | Participant approaches unsignalised intersection Utility vehicle in front brakes suddenly, turns left; |
| 2 | Several vehicles slow in right lane and signal for a right turn to enter service station, and stop in right lane of highway; driver must move into left lane to pass stationary vehicles turning right; |
| 3 | Vehicle turns from petrol station on the right side of road into the right lane adjacent to driver; participant’s view of the vehicle is obscured until passes vehicles stopped in right lane. Vehicle tracks ahead of participant at same speed until 100m prior to lanes merging; |
| 4 | One truck parked on shoulder of the right lane, a second truck in oncoming traffic turns left, encroaching on the participant’s lane; |
| 5 | A motorcycle overtakes on a curve and pulls into the lane in front of the participant, brakes, and then accelerates. |
| Residential drive | |
| 6 | A truck travelling from right encroaches on the participant’s lane when the truck is turning left into oncoming traffic; |
| 7 | A 4WD is stopped at the roadside and a vehicle pulls out from a driveway just ahead of the parked 4WD; At same time, a car in oncoming traffic passes in right lane; |
| 8 | A vehicle turns into the road ahead from the left, suddenly brakes and then accelerates ahead; |
| 9 | A pedestrian appears from the right at an intersection and proceeds to cross the road in front of the participant. |
| 10 | A motorcycle approaching suddenly turns right in front of the participant, failing to give way. |
| 11 | Participant turns right at a Y-intersection, selecting one of three possible gaps in oncoming traffic (3,5,9 sec) |
REFERENCES
- Ball K, Owsley C, Sloane ME, Roenker DL, Bruni JR. Visual attention problems as a predictor of vehicle crashes in older drivers. Investigative Ophthalmology and Vision Sciences. 1993;34(11):3110–3123. [PubMed] [Google Scholar]
- Charlton J, Fildes B, Andrea D. Vehicle safety and older occupants. Gerentechnology. 2002;1(4):274–286. [Google Scholar]
- Evans L. Traffic Safety and the Driver. Nostrand Reinhold; New York: 1991. [Google Scholar]
- Harkemes-Blomqvist L, Raitanen T, O”Neill D. Driver ageing does not cause higher accident rates per km. Transport Research; Part F. 2002;5:271–274. [Google Scholar]
- Koppel S, Charlton J, Muir C, Oxley J, Fildes B, Scully J, Tomasevic N. Solutions for older driver issues: design-technology-training, AutoCRC Report. Monash University Accident Research Centre; Clayton, Australia: 2006. [Google Scholar]
- Langford J, Methorst R, Hakamies-Blomqvist L. Older drivers do not have a high crash risk – a replication of low mileage bias. Accident Analysis & Prevention. 2006;38(3):574–578. doi: 10.1016/j.aap.2005.12.002. [DOI] [PubMed] [Google Scholar]
- Maltz M, Shinar D. Eye movements of older and younger drivers. Human Factors. 1999;41(1):15–26. doi: 10.1518/001872099779577282. [DOI] [PubMed] [Google Scholar]
- OECD. Ageing and Transport: Mobility Needs and Safety Issues. Organisation for Economic Co-operation and Development, OECD Publishing; 22 Nov. 2001. [Google Scholar]
- Owsley C, Ball K, Sloane ME, Roenker DL, Bruni JR. Visual/cognitive correlates of vehicle accidents in older drivers. Psychology & Aging. 1991;6(3):403–415. doi: 10.1037//0882-7974.6.3.403. [DOI] [PubMed] [Google Scholar]
- Oxley J, Charlton J, Fildes B. Self-regulation of older drivers: A review of the literature. (Report AP-R221-03) Sydney, Australia; Austroads: 2002. [Google Scholar]
- Pambakian ALM, Wooding DS, Patel N, Morland AB, Kennard C, Mannan SK. Scanning the visual world: a study of patients with homonymous hemianopia. Journal of Neurology, Neurosurgery & Psychiatry. 2000;69(6):751–759. doi: 10.1136/jnnp.69.6.751. [DOI] [PMC free article] [PubMed] [Google Scholar]
- Pradhan AK, Hammel KR, DeRamus R, Pollatsek A, Noyce DA, Fisher DL. Using eye movements to evaluate effects of driver age on risk perception in a driving simulator. Human Factors. 2005;47(4):840–852. doi: 10.1518/001872005775570961. [DOI] [PubMed] [Google Scholar]
- Szlyk JP, Seiple W, Viana M. Relative effects of age and compromised vision on driving performance. Human Factors. 1995;37(2):430–436. doi: 10.1518/001872095779064645. [DOI] [PubMed] [Google Scholar]


