Abstract
The advent of Automatic Crash Notification Systems (ACN) offers the possibility of immediately locating crashes and of determining the crash characteristics by analyzing the data transmitted from the vehicle. A challenge to EMS decision makers is to identify those crashes with serious injuries and deploy the appropriate rescue and treatment capabilities. The objective of this paper is to determine the crash characteristics that increase the risk of serious injury.
Within this paper, regression models are presented which relate occupant, vehicle and impact characteristics to the probability of serious injury using the Maximum Abbreviated Injury Scale Level (MAIS). The accuracy of proposed models were evaluated using National Automotive Sampling System/Crashworthiness Data System (NASS/CDS) and Crash Injury Research and Engineering Network (CIREN) case data. Cumulatively, the positive prediction rate of models identifying the likelihood of MAIS3 and higher injuries was 74.2%.
Crash mode has a significant influence of injury risk. For crashes with 30 mph deltaV, the risk of MAIS3+ injury for each mode is 38.9%, 83.8%, 47.8% and 19.9% for frontal, near side, far side and rear impact crashes, respectively. In addition to deltaV, a number of crash variables were identified that assist in the accurate prediction of the probability of MAIS 3+ injury. These variables include occupant age, partial ejection, safety belt usage, intrusion near the occupant, and crashes with a narrow object. For frontal crashes, added crash variables include air bag deployment, steering wheel deformation, and multiple impact crashes. The quantitative relationship between each of these crash variables and injury risk has been determined and validated by regression analysis based on NASS/CDS and CIREN data.
The National Highway Traffic Safety Administration (NHTSA) has reported that 27 million vehicles were involved in over 17 million crash events on US roadways in 2000. During these events, an estimated 2 million occupants sustained injuries requiring medical care, but only 1 in 8 sustained injuries that were considered life threatening [1]. Although these 250,000 seriously injured occupants require the most urgent medical attention, they are not easily distinguished from the less severely injured using current rescue protocols. This inability to distinguish occupants at high risk for severe injury results in costly delays in treatment and poor allocation of medical resources.
A number of crash attributes have been recognized as important indicators of injury potential, yet the use of this information to improve rescue care has been limited to date. In the event of a motor vehicle crash, potentially injured occupants rely on passing motorists or accessible cellular technology to initiate a call for help. Once this call has been made, rescue services verbally gather location and crash severity data from callers in order to select and deploy rescue services to the crash site. A study by Evanco et. al. estimates a potential reduction of 3,069 rural fatalities if notification times within one minute of the crash are achieved [2]. Clark and Cushing estimate this potential fatality reduction to be 1,697 for the 1997 fatally injured population [3].
Upon arrival to the crash, first care providers rely on anatomical, physiological and occasionally mechanism criteria to distinguish occupants who require trauma center care from those who do not. In some cases, evidence of severe internal injury is difficult to discern in the field. There are crash involved occupants who are improperly transported to non-trauma center care before the true severity of their injuries is recognized.
Conversely, many occupants are triaged to trauma centers based on “High Suspicion of Injury” criteria in the absence of definitive evidence of injury. In this case, first care providers may choose trauma center care based on their overall impression of an occupant’s condition even if they do not meet any established trauma criteria. This use of “High Suspicion of Injury” criteria greatly improves the chance that an occupant who has not met trauma criteria will receive necessary trauma center care. In many cases, this practice taxes rescue and in-hospital resources.
In Miami, Florida 60% of occupants triaged to the Ryder Trauma Center under “High Suspicion of Injury” criteria are discharged within 24 hours of hospital arrival [4]. This suggests that better methods to discern the seriously injured from uninjured in the field may help to reduce the unnecessary use of valuable medical resources.
In 1997, Malliaris et. al. proposed the URGENCY algorithm to predict the risk of serious injury in the event of a motor vehicle crash [5]. The algorithm processed crash conditions using logistic regression models to predict the likelihood of an AIS3 or higher injury for crash involved occupants. A single regression model was developed to predict injury risk for all crash modes based on characteristics known to be influential for injury outcome. This approach is effective in the characterization of the interaction between model variables; however, it assumes that variations in crash attributes are equally influential in all crash directions. The creation of distinct crash models by impact direction is necessary to enhance the predictive ability of predictive injury models.
The following paper supports further implementation and enhancement of ACN technology to improve crash rescue care. Further development of the URGENCY algorithm is described and its predictive ability is documented through an analysis of real-world crash cases. Four independent injury models by crash mode were developed. Each algorithm was created in two levels of complexity and tested for its accuracy. Model performance is also compared with the use of deltaV alone as an independent predictor of injury.
DATA SOURCES AND METHODS
For this study, National Automotive Sampling System/Crashworthiness Data System (NASS/CDS) crash data was used to develop models that predict the likelihood of severe injury. Data was partitioned in a variety of ways to improve prediction accuracy. NASS/CDS years 1995–1999 and CIREN years 1994–2002 were used to develop the injury prediction coefficients for the models. Model testing and validation was performed using NASS/CDS 2000 and 2001 data as well as Crash Injury Research and Engineering Network (CIREN) case files. The NASS/CDS collects approximately 5,000 cases per year. These cases involve approximately 9,000 occupants. The CIREN database contains approximately 1,100 stored cases.
Both NASS/CDS and CIREN databases provide cases where crash attributes and their corresponding injury outcomes are known for each crash involved occupant. NASS/CDS cases provide information regarding crashes across all injury severities at a national level while CIREN cases provide more detailed investigations of occupant injury mechanism for only the most severely injured crash population.
The use of CIREN case files presents an opportunity to evaluate the most serious crash events where the majority of occupants investigated require immediate medical care. Unlike NASS/CDS which samples all crash severities, CIREN centers consider only crash involved occupants who are transported to a Level I trauma center participating in the study or they are fatally injured. Accordingly, CIREN case investigations provide very detailed information regarding only these most serious collision events and occupant injuries sustained. Use of these cases for model training would introduce significant bias toward high severity injury therefore, this data was used only for model analysis and validation purposes.
NASS/CDS 1995–1999 cases were processed such that accident, vehicle and occupant level data are linked for any crash involved occupant twelve years and older. The analysis was performed for all occupants in any seating position. For the purpose of model development during this stage, only maximum injury severity (MAIS) and overall occupant injury severity score (ISS) were necessary for processing; therefore, injury level data was not linked.
Model variables were conditioned and categorized into continuous or dichotomous variables classes. Crash attributes, where multiple categories exist, were recoded as single binary variables. Table 1 below shows a subset of model variables used in each proposed model.
Table 1.
Crash attributes Considered for Regression Models
| Variable | Description |
|---|---|
| DELTAV | Total DeltaV |
| BELT | 3-Point Belt Usage |
| BDPLY | Airbag Deployment |
| MAXC1 | Max Exterior Crush 1 (in.) |
| MAXC2 | Max Exterior Crush 2 (in.) |
| NARROW | Narrow Object Collision |
| INTRUS | Intrusion Near Occ. (in.) |
| EJP | Partial Occ. Ejection |
| EJC | Complete Occ. Ejection |
| SQR_AGE | Occupant Age Squared |
| STRIM | Steering Rim Deformed |
| OCCHT | Occupant Height (in.) |
| OCCWT | Occupant Weight (lb.) |
| BMI | Body Mass Index |
| FEMALE | Occupant Gender |
| TRACK | Seat Track Position |
| MULTI | Multiple Impacts |
| SEATPOS | Seating Position |
CIREN investigations consider only crash involved occupants who are transported to one of nine Level I trauma centers participating in the study or those who are fatally injured during a crash. Case investigations focus on fewer cases per year with significant emphasis on analysis of crash causation and injury mechanism. Accordingly, CIREN case investigations provide very detailed information regarding only the most serious crash events. CIREN cases were used primarily for recognition of injury patterns and final model validation during this study.
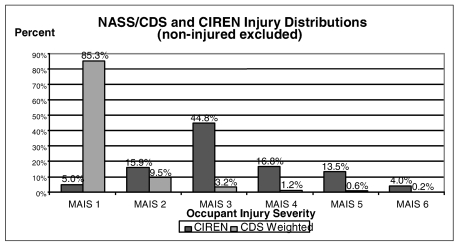
CIREN crash variables were coded identically to the NASS/CDS variables shown in Table 1. This allows for direct application of NASS/CDS based crash variables to CIREN populations during validation. Figure 1 shows a comparison of MAIS level per crash involved occupant for NASS/CDS 2000–2001 as well as CIREN census data. It may be easily recognized that the average severity of injured occupants within the CIREN census far exceeds that of the NASS/CDS dataset. The effect of this varied distribution on model behavior will be discussed later in this text.
Figure 1.
NASS/CDS and CIREN Injury Distribution
REGRESSION MODELLING
Simple logistic regression techniques were used during this study to represent observable relationships between a population of independent crash variables and dependant outcomes. This approach uses the Method of Least Squares to generate a function describing the behavior of some outcome variable in terms of a series of input crash variables.
Logistic regression models fit relationships to predict the probability that a selected event will occurred (yes or no response). This approach, using the Principle of Maximum Likelihood, yields a probability value on a scale which is bounded by 0 and 1 (i.e. probability of event occurrence between 0 and 100 percent). For this study, the hypothesis that a crash event will result in an MAIS3 or higher injury based on input crash variables is tested. Equation 1 below defines the relationship between input crash variables and the intermediate parameter w. When substituted into Equation 2, this parameter yields the maximum likelihood that an MAIS3+ injury will occur.
| (1) |
| (2) |
The relationships shown above (Equations 1 and 2) can be expanded to include additional crash descriptors that are known to be influential to injury risk. If a variable is significant to the modelled outcome, the addition of that parameter to the regression equation should enhance the predictive ability of the model. In some cases, however, additional model crash variables do not lead to significant increases in model accuracy. Therefore, model crash variables should be judiciously selected. During this study, variable selection was performed through an iterative analysis of model accuracy while crash variables were added or removed from each. Details of this process have been previously reported [6].
INJURY PREDICTION BASED ON CRASH CHARACTERISTICS
In order to quantify the level of injury sustained by occupants involved in motor vehicle crashes, a consistent and meaningful measure of injury severity must first be selected. The scoring system must provide a clear indication of the most severe injury level sustained so that injured occupants may receive the most appropriate medical care in the post crash phase. At the same time, this scale must accurately reflect the total amount of crash energy to which an occupant was exposed during a crash event. When accurately calculated, deltaV provides a good indication of the kinetic energy of the vehicle/occupant system before impact. Dissipation of this energy and the degree to which an occupant is subjected to it directly relates to the level of trauma an occupant is likely to sustain. However, numerous other factors my influence the severity of the injury.
The Abbreviated Injury Scale (AIS) is a well established measure of trauma per injury sustained during a crash. It measures the physical disruption of tissue due to the ill effects of impact energy. An AIS score is assigned to each discernable injury across all body regions and provides an indication of the threat to life due to a specific injury. The highest AIS or Maximum AIS value (MAIS) has been used by many to represent the overall severity of injury sustained by an occupant. This measure indicates the extent of occupant injury and the corresponding level of required medical care; however, it does not adequately account for all injuries sustained across the entire body. If multiple occurrences of harmful occupant loading take place, reporting a single MAIS value does not adequately gauge the total trauma experienced by an occupant.
Similar behavior of the average ISS and the severe injury risk suggests that ISS may be a viable measure of injury severity for models based on deltaV and crash energy. The ISS score also provides a graduated scale which accounts for injury severities that may extend beyond the single most severe injury (as suggested by MAIS). It is calculated as follows:
| (3) |
Regular regression techniques were used to relate crash attributes to actual ISS scores. This technique differs from the logistic regression approach which relates crash attributes to the likelihood of MAIS3+ injury. The evaluation of ISS as a predictor of injury is documented in an earlier paper and is presented here in Table 2 for background purposes [8].
Table 2.
Logistic and Regular Regression Coefficients- 1 Parameter Model (all modes)
| Model Type | Parameter(All Modes) | Estimate | Standard Error |
|---|---|---|---|
| P(MAIS3+)(logistic) | Intercept | −4.1951 | 0.0587 |
| DeltaV | 0.1301 | 0.00258 | |
| ISS Value(regular) | Intercept | −0.0776 | 0.02108 |
| DeltaV | 0.0966 | 0.00112 |
Within the following sections, logistic regression models indicating the likelihood of MAIS3+ injury are presented. Tables 2 and 3 show the coefficients for Equation 1 and 2, and the standard error. The logistic regression model applied to obtain the Table 2 coefficients used only deltaV as the predictor variable. No distinction was made by crash direction. Based on Table 2, the probability of MAIS 3+ injury in a 30 mph crash is 42.7%
Table 3.
Logistic Regression Models- Probability of MAIS3+ Injury- DeltaV by Mode
| Mode | Parameter | Estimate | Standard Error |
|---|---|---|---|
| Frontal | Intercept | −4.1373 | 0.03717 |
| Deltav | 0.1228 | 0.00194 | |
| Nearside | Intercept | −4.0664 | 0.1151 |
| Deltav | 0.1903 | 0.0061 | |
| Farside | Intercept | −4.4873 | 0.10488 |
| Deltav | 0.1466 | 0.00543 | |
| Rear | Intercept | −5.665 | 0.07375 |
| Deltav | 0.1424 | 0.00429 |
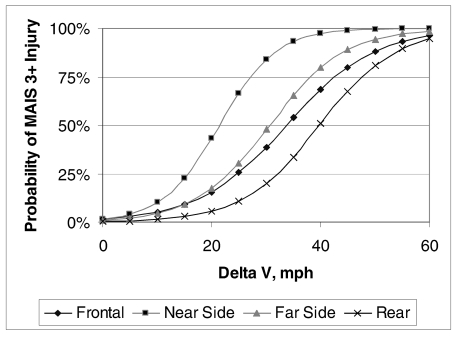
When separated by crash mode, the parameter estimates for MAIS3+ injury are as shown in Table 3. Based on these model crash variables, the risk of MAIS3+ injury for each mode is 38.9%, 83.8%, 47.8% and 19.9% for frontal, nearside, farside and rear impact crashes respectively for a 30 MPH deltaV. Figure 2 shows the variation of the MAIS 3+ injury probability with delta V for different crash modes. A stratified approach (separate models by mode) was adopted during model creation so that the true effect of predictor variables could be quantified. This approach was selected so that model complexity could be limited for future applications.
Figure 2.
Probability of MAIS 3+ Injury by Crash Mode and Delta V
The significant variation in injury risk based on crash direction suggests that separate models for each mode may better predict the occurrence of injury compared to a single model which concurrently represents all crash modes. As such, separate models are presented for frontal, nearside, farside and rear impact crashes in the following sections. For each crash mode, parameter estimates are presented in two variable groupings. These groups are listed and described below.
INJURY PREDICTION BASED ON MULTIPLE CRASH VARIABLES
The selection of crash variables in the models to follow was based on an examination of all possible groupings of the variables in Table 1. From these grouping an optimized set was selected. Selection was based on variables that provided statistically significant changes in the MAIS 3+ probability of injury. Some of these variables may not be available through current sensor systems. These detailed models can provide indicators of factors that may significantly influence injury risk. As such they provide guidance to first care providers and to designers of future automatic crash notification systems.
In the future, selected model crash variables could be derived from basic occupant sensor technology. Upcoming regulatory requirements intend to improve the level of protection provided by advanced restraint systems through a better understanding of occupant factors (i.e. occupant height, weight, gender). These characteristics may provide additional data points for processing by on-board diagnostic systems. In the meantime, verbal communication of some data points listed below may significantly enhance the ability of ACN call takers to assess likely injury severity from remote locations.
Some of this information may also be generated through processing of raw information like vehicle acceleration profiles. Post crash processing of vehicle acceleration data may provide valuable information regarding the nature of a collision event if collected for a larger portion of the crash event. As an example, the acceleration profile for some narrow object collisions can be distinguished from profiles of other collision types due to its characteristic shape. These events are characterized by a prolonged period of moderate deceleration followed by a sharp increase in deceleration level once the narrow object begins interaction with more rigid engine and drive train components. This information could be used as a model input parameter to indicate a narrow object impact.
The crash variables were selected for optimized performance of each model by crash mode. In Table 3 below, variables selected for the frontal model are shown. In addition, Table 3 contains parameter estimates and standard error values for logistic regression models predicting MAIS3+ injury. The two values of maximum crush are applicable to vehicles that undergo multiple impacts. The maximum crush values are for the two areas of the vehicle with the most damage. The presence or absence of steering wheel deformation is represented by the steer variable.
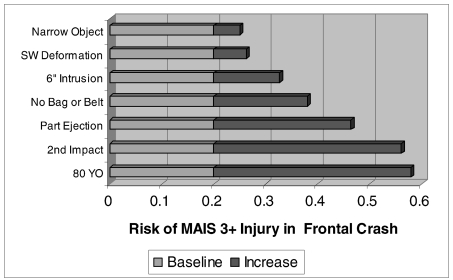
Figure 3 shows the influence on MAIS 3+ injury risk for crash variables other than delta V. For the baseline case, a 30 year old belted occupant protected by an air bag was assumed. The delta V was maintained at a constant value that produced an injury probability of 20%. The other independent variables in Table 3 were applied one at a time to evaluate the change in injury probability over the baseline. For continuous variables, a reasonable magnitude was assumed. The intrusion was assumed to be 6 inches, the 2nd impact was assumed to cause 25 inches of crush, and the age of the occupant was increased from 30 to 80.
Figure 3.
Increase of MAIS 3+ Probability over Base, due to Shown Influences for Frontal Crashes
In Table 4 below, variables selected for the near side model are shown. In addition, Table 4 contains parameter estimates and standard error values for logistic regression models predicting MAIS3+ injury.
Table 4.
Near Side Crash Optimized Crash Variables and Values
| Abbreviation | Crash Variable | Estimate | Std Error |
|---|---|---|---|
| Intercept | Intercept | −5.989 | 0.3173 |
| deltav | Total Delta V (mph) | 0.167 | 0.0122 |
| belt | 3-Point Belt Usage | −0.2638 | 0.1439 |
| narrow | Narrow Obj. Collision | 1.099 | 0.2467 |
| intrus | Intrus. Near Occ. (in.) | 0.0996 | 0.0126 |
| EJP | Partial Ejection | 1.2517 | 0.3621 |
| AGE | Occupant Age | 0.0401 | 0.00335 |
Figure 4 shows the influence on MAIS 3+ injury risk for crash variables other than delta V in near side crashes. For the baseline case, a 30 year old belted occupant was assumed. The delta V was maintained at a constant value that produced an injury probability of 20%.
Figure 4.
Increase of MAIS 3+ Probability over Base, due to Shown Influences for Near Side Crashes
In Table 5 below, variables selected for the far side model are shown. In addition, Table 5 contains parameter estimates and standard error values for logistic regression models predicting MAIS3+ injury to evaluate the change in injury probability over the baseline. The intrusion in this crash mode is binary – either greater or less than 18 inches.
Table 5.
Far Side Crash Optimized Crash Variables and Values
| Abbreviation | Crash Variable | Estimate | Error |
|---|---|---|---|
| Intercept | Intercept | −4.7765 | 0.5135 |
| DeltaV | Total Delta V (mph) | 0.1557 | 0.0114 |
| Belt | 3-Point Belt Usage | −1.2287 | 0.1846 |
| intru18 | 18 + In. Intrus. Near Occup | 1.2028 | 1.061 |
| EJP | Partial Ejection | 1.3693 | 0.5745 |
| AGE | Occupant Age | 0.0245 | 0.00449 |
| Bmi | Body mass index | −0.0154 | 0.0168 |
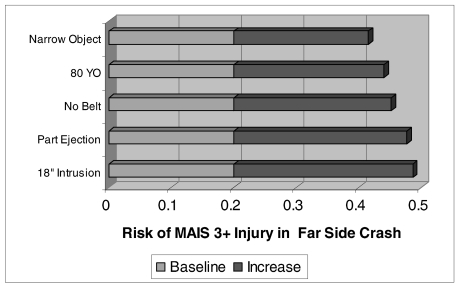
Figure 5 shows the influence on MAIS 3+ injury risk for crash variables other than delta V in far side crashes. For the baseline case, a 30 year old belted occupant was assumed. The delta V was maintained at a constant value that produced an injury probability of 20%. The other independent variables in Table 5 were applied one at a time to evaluate the change in injury probability over the baseline. The only continuous variable was age. The age of the occupant was increased from 30 to 80.
Figure 5.
Increase of MAIS 3+ Probability over Base, due to Shown Influences for Far Side Crashes
MODEL VALIDATION
NASS/CDS 2000–2001 data and CIREN census files were used to evaluate the accuracy of each proposed model. Each of the NASS/CDS populations tested was independent of the cases used to initially train the regression models. The distribution of crashes in the 2000 and 2001 NASS/CDS population includes a sample of 9,351 tow-away crashes representing a total of 4,745,144 occupants following weighting. This includes 3,122,193 drivers and 1,622,952 passengers.
It should be noted that the occupant counts for each of the four categories of planar crashes (frontal, nearside, far side and rear) do not include any occupants involved in rollovers or complete ejections. For this analysis, the occurrence of these events are not simply considered to be characteristics of other crash types but are serious enough to independently warrant rapid deployment of rescue services.
To evaluate the overall accuracy of each model, classification rates were determined at a single MAIS3+ injury risk threshold value. These threshold values were selected through an evaluation of the changes of specificity and selectivity as a function of injury risk threshold. To select an injury risk threshold value, a point was identified where variation in threshold value led to equivalent changes in model sensitivity and specificity. The selection of this threshold value equally favors model sensitivity and specificity. The resulting threshold, sensitivity and selectivity values are shown in Table 6. For other applications, selection of this value must be made based on intended model application and tolerable false positive and false negative predictions. Using threshold values as shown in Table 6, the overall sensitivity and specificity rates are shown by crash mode for the NASS/CDS test populations.
Table 6.
Model Performance at Selected Threshold Values (probability of MAIS3+ Injury NASS/CDS 2000–2001)-
| Crash Mode | Threshold Probability | Sensitivity | Specificity |
|---|---|---|---|
| Frontal | 19.20% | 70.10% | 88.80% |
| Nearside | 29.70% | 80.70% | 82.00% |
| Farside | 17.00% | 78.30% | 85.70% |
| Rear | 8.40% | 71.40% | 88.80% |
| Total | 74.20% | 87.50% |
DISCUSSION OF RESULTS
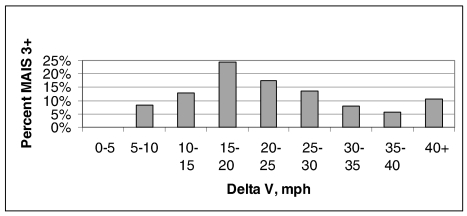
The distribution of MAIS 3+ injuries with delta V in frontal crashes is shown in Figure 6, based on NASS/CDS 1997–2000. Although deltaV has been shown to be an important factor in predicting MAIS 3+ injuries, a large number of injuries occur at relatively low values of deltaV. Consequently, added factors representing conditions that increase injury risk need to be considered.
Figure 6.
Distribution of MAIS 3+ Injured in NASS/CDS Frontal Crashes
Figure 2 shows how the same delta V may produce different injury risks in different crash modes. Partitioning by crash mode is an evident requirement for improved prediction.
Figure 3, 4 and 5 show how selected crash variables can each independently increase the injury risk over a 20% baseline risk at a moderate deltaV. Advanced age stands out in all crash modes, particularly for frontal crashes. Partial ejection is also an obvious hazardous outcome. Crashes involving narrow objects also emerged as a hazardous crash characteristic. Intrusion in a location close to the occupant is hazardous in frontal and near side crashes. In far side crashes, higher magnitudes of intrusion are required before this variable becomes significant. Belt use reduces injury risk in all crash modes, but is least effective in near side crashes. In frontal collisions, the damage associated with a second impact became a significant variable. In addition, steering wheel deformation resulted in increased risk.
CONCLUSIONS
It is well understood that rapid notification of rescue services and appropriate administration of medical care will reduce the likelihood of secondary injury or death of crash involved occupants. Methods to process crash conditions in order to estimate the likelihood of injury have been established and the accuracy of these methods has been reported. When compared with injury prediction based on deltaV alone, proposed models were shown to improve accuracy of injury estimates based on crash attributes available at the time of the crash.
Crash mode has a significant influence of injury risk. For crashes with a 30 mph delta V, the risk of MAIS3+ injury for each mode is 38.9%, 83.8%, 47.8% and 19.9% for frontal, nearside, farside and rear impact crashes, respectively.
For the NASS/CDS populations tested, the sensitivity of models predicting the likelihood of MAIS3 and higher injuries is 74.2% with an overall specificity of 87.5%. When compared with predictions based on deltaV alone, the use of proposed models offers a more accurate estimate of injury potential based on readily available crash information for frontal crashes and farside crashes. The limited data where MAIS3+ injury occurred during rear crashes did not permit improvements beyond algorithms using delta V alone.
In addition to deltaV, a number of crash variables were identified that assist in the accurate prediction of the probability of MAIS 3+ injury. These variables include occupant age, partial ejection, safety belt usage, intrusion near the occupant, and crashes with narrow objects. For frontal crashes, added crash variables include air bag deployment, steering wheel deformation, and multiple impact events. The quantitative relationship between each of these crash variables and injury risk has been determined and validated by regression analysis based on NASS/CDS and CIREN data.
Table 3.
Frontal Crash Mode Optimized Crash Variables and Values
| Variable | Description | Coefficient | Std Error |
|---|---|---|---|
| int | Intercept | −4.1623 | 0.1494 |
| deltav | Tot. DeltaV | 0.0875 | 0.00696 |
| belt | 3-Point Belt Usage | −0.8949 | 0.0895 |
| bdply | Airbag Deployment | −0.0205 | 0.0931 |
| maxc1 | Maximum Ext. Crush 1 (in.) | 0.0182 | 0.00632 |
| maxc2 | Maximum Ext. Crush 2 (in.) | 0.0404 | 0.016 |
| narrow | Narrow Object Collision | 0.3144 | 0.1145 |
| intrus | Intrusion Near Occup. (in.) | 0.109 | 0.00956 |
| sqr_age | Occup. Age Squared | 0.00031 | 0.000024 |
| ejectp | Partial Ejection | 0.8661 | 0.3985 |
| steer | Steering Wheel Deform | 0.2858 | 0.1231 |
ACKNOWLEDGMENTS
The authors wish to thank their sponsors, BMW, North America for their continuous support for this study. Also, the authors wish to recognize the late Dr. A.C. Malliaris for his pioneering work to develop the first generation of injury predicting algorithms known as URGENCY.
REFERENCES
- 1.National Highway Traffic Safety Administration, “Crash Injury Research and Engineering Network (CIREN) Program Report,” U.S. DOT HS 809 377.
- 2.Evanco WM. The potential impact of rural mayday systems on vehicular crash fatalities. Accident Analysis & Prevention. 1999;31:455–462. doi: 10.1016/s0001-4575(98)00083-9. [DOI] [PubMed] [Google Scholar]
- 3.Clark DE, Cushing BM. Predicted effect of automatic crash notification on traffic mortality. Accident Analysis and Prevention. 2002;34:507–513. doi: 10.1016/s0001-4575(01)00048-3. [DOI] [PubMed] [Google Scholar]
- 4.Interview: Dr. David Shatz, Ryder Trauma Center, University of Miami, October 9, 2002.
- 5.Malliaris AC, Digges KH, DeBlois JH. Relationships Between Crash Casualties and Crash Attributes. Society of Automotive Engineers SAE 970393; Feb, 1997. [Google Scholar]
- 6.Bahouth GT. The George Washington University. Jan, 2003. Doctoral Dissertation: Development and Validation of Injury Predicting Algorithms for Automotive Crash Applications. [Google Scholar]
- 7.Baker SP, O’Neill B, Haddon W, Long WB. The Injury Severity Score: a method for describing patients with multiple injuries and evaluating emergency care. Journal of Trauma. 19974;14(5):187–196. [PubMed] [Google Scholar]
- 8.Augenstein, et al. Methodology for The Development and Validation of Injury Predicting Algorithms. Paper 467, ESV Conference; May, 2003. [Google Scholar]


