Abstract
This study compares injury outcomes in vehicle crashes involving different age groups of belted passengers. Two datasets were considered.
Firstly, UK national data revealed that younger passengers are much more likely to be involved in crashes per million miles travelled compared to older passengers although older passengers are much more likely to be killed or seriously injured compared to younger passengers.
Secondly, in-depth vehicle crash injury data were examined to determine some of the underlying reasons for the enhanced injury risk amongst older passengers. In crashes of approximately equal severity, the older passenger group were significantly more likely to be fatally injured in frontal crashes (p<0.001). However young passengers were as equally likely to be killed in struck-side crashes compared to the older group. The results also showed that older passengers sustained more serious injuries to the chest region in frontal crashes compared with the younger aged group (p<0.0001) and it is this body region that is particularly problematic. When the data were analysed further, it was found that a large proportion of passengers were female and that in the majority of cases, the seat belt was responsible for injury.
Since by the year 2030, 1 in 4 persons will be aged over 65 in most OECD countries, the results suggest a need for intervention through vehicle design including in-vehicle crashworthiness systems that take into account reduced tolerance to impact with ageing.
It is generally acknowledged that the energy required to cause an injury reduces as a person ages (Augenstein, 2001). It therefore follows that older vehicle occupants are more vulnerable to injury in a crash compared with their younger counterparts. The skeletal structures of older persons are more easily damaged and the consequences of any assault are likely to be more serious compared with younger vehicle occupants because of reductions in bone strength and fracture tolerance (Dejammes and Ramet, 1996; Evans, 1991; Mackay, 1989; Viano et al, 1989). The high prevalence of osteoporosis particularly amongst females is well established (Berthel, 1980). Nevertheless, although manufacturers have an increased awareness of the physiological changes that take place in later life, the evidence upon which effective crash protection design is based is sparse, particularly regarding the needs of older occupants (Mackay, 1989). In one study, Foret-Bruno, (1978, 1989, in Dejammes and Ramet, 1996) concluded that older people could withstand a chest load of 5,000 Newtons (equating to 50mm of force-deflection on a Hybrid-III anthropomorphic crash-test dummy) whilst young people could withstand a chest load of 8,000 Newtons (equating to 80mm of force-deflection). The implication of this is that an older car occupant is several times more likely to sustain a life-threatening chest injury (Padmanaban, 2001). The chest is clearly a vulnerable area and the major load bearing area for restraint systems as well as a major point of contact with the vehicle structure in a crash.
However, the level of personal mobility and independence afforded by the motorcar is valued highly by older people. Many older people in western countries now make an overwhelming proportion of their trips in private vehicles (OECD, 2001) compared with 30 years ago or so. With this in mind, there is a growing awareness of the need for vehicle safety to suit older occupants. In short, there is a need to improve the crashworthiness of vehicles to provide better protection for older occupants in the event of a crash.
Although there is much data concerning driver performance degradation with ageing, the effect of ageing on injury outcomes in vehicle crashes is still largely unclear. Evans, (1991) noted that age effects are largely difficult to determine.
This study follows on from previous work examining ‘Older Occupant’ outcomes in vehicle crashes. A previous study examined injury outcomes for ‘Older Drivers’ (Morris et al, 2002). Such studies are deemed necessary in view of the growing recognition of the increase in the numbers of elderly persons in most westernised societies. Moreover, as noted by Mackay and Hassan, (2000) more detailed crash data are needed to optimise vehicle crash performance.
The aims of the study were deemed as follows;
To examine crash and injury characteristics that may affect older passenger outcomes in the event of a crash;
To make some preliminary assessment of the need for countermeasure development.
METHOD
Two databases were used to examine issues concerning the older passengers. The first database includes UK crash data from all UK accidents involving passenger cars in which an injury occurred to at least one occupant. Since the data represent the UK injury accident population, tests for statistical significance are not required. In this section, any differences noted between the age groups, even if small, are true differences and not due to sampling error.
The second database includes in-depth UK crash injury data covering current model cars. These data were collected between 1998 and 2001 as part of the Co-operative Crash Injury Study (CCIS). The CCIS data are a stratified sample of UK crashes where the vehicle was towed from the crash-scene. Some 80% of ‘serious’ and ‘fatal’ and some 10–15% of ‘slight’ injury crashes according to the UK government’s classification are investigated in well-defined sample regions. Consequently, the resulting sample is biased towards the more serious crashes. In addition, there is a possibility of regional bias since the study operates in a limited number of regions in the UK.
Single impact vehicle crashes only were studied. The un-weighted sample includes only belted front seat passengers, including 723 passengers aged between 13–39 years (young), 360 aged between 40–64 years (middle-aged) and 195 aged 65+ years (older passengers). Medical data were obtained from the hospitals to which the occupants were admitted. The sampling criteria determined that all vehicles in the study were less than six years old at the time of the crash and were towed away from the crash scene. An in-depth examination of each vehicle was made in recovery-yards and garages within a few days of the accident. Passenger airbag deployment rate in the overall sample was found to be very low. In only 17 (<2%) cases was a passenger present when the passenger airbag deployed. Rear seat passengers were not considered in this study.
The UK government system of injury classification was used to assess and compare the severity of passenger injury in the datasets. This system classifies injured passengers approximately as follows;
| Fatal | Death within 30 days of the crash |
| Serious | Injury serious enough to warrant hospitalisation or injuries such as fractures, severe lacerations. |
| Slight | Injury requiring minor treatment at an outpatient ward or at the roadside. |
| No injury | No reported or observed injury. |
In addition, individual injuries were coded and described according to the Abbreviated Injury Scale (AIS) 1990 revision. Maximum Abbreviated Injury Score (MAIS) was also used where possible. This is the highest Abbreviated Injury Score (AIS) injury sustained by the passenger in the crash (ranging from MAIS = ‘0’ or no injury to MAIS = ‘6’ or maximum injury). The Chi squared test was used to examine the relationship between age group (3 levels) and a number of independent variables of interest.
RESULTS
National accident data
The first analysis concentrates on UK National casualty trends with exposure data from the National Travel Survey;1 population counts from the UK Census 20012 and accident statistics from the police STATS 19 database. It should be noted that the STATS 19 database contains the whole UK injury accident population and as such, tests for statistical significance are therefore not required. In this section, any differences noted between the age groups, even if small, are true differences and not due to sampling error.
Table 1 shows the rate of injury for car passengers by age group. Here, the frequency of casualties from the STATS19 data has been adjusted by accounting for exposure in terms of distance travelled as a passenger for each age group. The age classifications used are dictated by the reported data.
Table 1.
Rate of Injury for Car Passengers by Age group
| Age Group | Population (millions) | Average mileage/ annum | Total mileage/ annum (millions) | Passenger casualties3 | Casualty rate/ million miles |
|---|---|---|---|---|---|
| 17–20 | 2.90 | 2,472 | 7168.80 | 11,662 | 1.626 |
| 21–29 | 6.70 | 1,944 | 13024.80 | 11,897 | 0.913 |
| 30–39 | 9.12 | 1,695 | 15458.40 | 8,304 | 0.537 |
| 40–49 | 7.89 | 1,665 | 13136.85 | 5,184 | 0.395 |
| 50–59 | 7.37 | 1,899 | 13995.63 | 4,519 | 0.323 |
| 60–69 | 5.48 | 1,719 | 9420.12 | 3,417 | 0.363 |
| 70+ | 6.74 | 1,114 | 7508.36 | 3,538 | 0.471 |
Focus on Personal Travel; Her Majesty’s Stationery Office ISBN: 0 11 552302 2
3% missing values
It is evident that those passengers below the age of 30 have a considerably higher casualty rate than older passengers. The rate decreases with age up to 60 years when there is then an observed increase in the casualty rate for the subsequent age groups.
For children over the age of 12 there is no longer a requirement to use any additional restraint beyond the adult lap-diagonal or lap belt, these being seen as adequate protection once a child reaches 13 years. Hence, the subsequent analysis includes all passengers over the age of 12.
The STATS 19 data only includes records for injured passengers; it is not therefore possible to quantify injury risk for passengers, as there is knowledge of non-injury events. For those passengers who were injured, Table 2 shows the proportions of fatal, serious and slight injury outcome, according to the police records for each age group.
Table 2.
Age of Passenger by Police Severity Classification
| Age | |||
|---|---|---|---|
| 13–39 years | 40–64 years | 65+ years | |
| Fatal | 0.9% | 0.6% | 1.9% |
| Serious | 9.8% | 7.9% | 13.3% |
| Slight | 89.3% | 91.5% | 84.8% |
It is clear that although passengers in the oldest age group generally have a lower casualty rate than the younger groups (as shown in table 1), the proportion injured at the Fatal/Seriously Injured level is considerably higher, 15% compared to 10.7% and 8.5% for the youngest and middle groups respectively.
In-Depth Accident Data
1. Characteristics of Crashes Involving Older Passenger
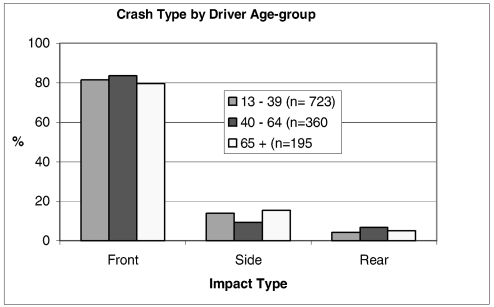
The first analysis studies some characteristics of crashes involving front seat passengers by age class. Figure 1 shows crash types in the sample by passenger age group.
Figure 1.
A chi-square test supports the observation that there is little relationship between crash type and age across the three age groups (χ2 = 8.236, d.f. = 4, p=0.083.) although the older passengers are involved in slightly more frontal and struck-side (i.e. ‘Left-side’) crashes and slightly fewer ‘Frontal’ and ‘Rear’ crashes compared to the ‘young’ and ‘middle-aged’ group.
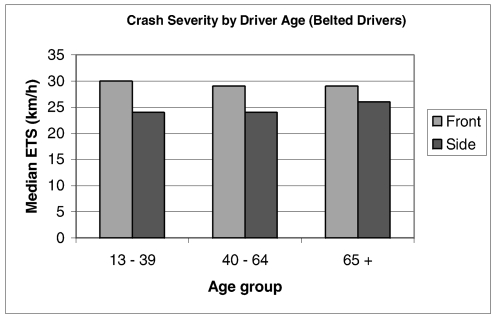
Figure 2 shows the crash severity for the three age groups according to crash type. Only Frontal crashes and Left-Side crashes have been studied in this analysis.
Figure 2.
As can be seen from figure 2, there appears to be little difference in the mean crash severity for frontal impacts, as measured by the Equivalent Test Speed (ETS). In support, a chi-square analysis for each impact type produced non-significant results (χ2 = 0.93, df=2, p = 0.628 for frontal impacts and χ2 = 0.16 p = 0.923 for side impacts).
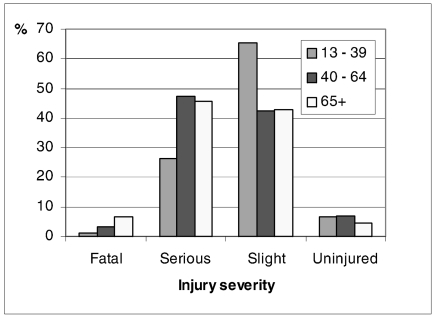
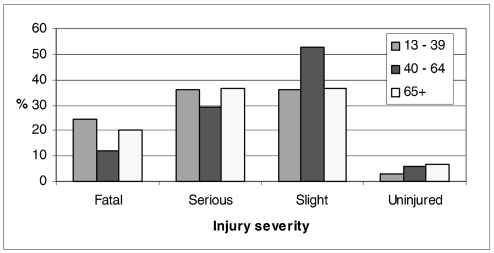
Figures 3 and 4 show injury outcomes (according to the UK Government’s classification of crashes) by crash type for the three groups of passengers. Some caution in strict interpretation of the results is indicated since this classification is based on Police assessments of the crash severity in terms of injury outcomes made at the crash-scene, in the absence of supporting clinical diagnosis. Whilst the Police assessments of actual injury outcomes can be misleading in some cases, particularly the distinction between ‘Slight’ and ‘Serious’ injury (e.g. Morris et al, 2003), erroneous classification of ‘Fatal’ outcome is very rare in the UK.
Figure 3.
Injury severity by age group in Frontal Impacts
Figure 4.
Injury severity by age group in Side Impacts
In frontal crashes, a chi-square analysis shows that older passengers appear to be over-represented in the ‘Fatal’ injury classification (χ2= 66.770, df = 6, p<0.001). This is the case, even though as was shown above, the severity of crashes in which they are involved do not differ statistically when compared with the other groups of passengers (i.e. ‘Younger’ and ‘Middle-aged’ groups). However, the crash-types in terms of object struck do differ somewhat as can be seen in table 3 below. In comparison to younger passengers, the older passenger group tend to be involved in more crashes involving trucks and buses. The younger age group tend to be involved in more crashes with poles and trees compared to both other age groups. It is difficult to ascertain the extent to which object struck affects injury outcome in frontal crashes on this analysis alone though. Data on intrusion, and degree of overlap, amongst other factors, need to be taken into account.
Table 3.
Object Struck in Side Impact Crashes
| 13 – 39 years | 40 – 64 years | 65 + years | |
|---|---|---|---|
| Car | 66.1% | 72.1% | 66.4% |
| Truck/Bus/Van | 12.2% | 16.4% | 20.7% |
| Pole/Tree | 8.7% | 2.7% | 3.4% |
| Other Object | 13% | 8.8% | 9.5% |
In side impact crashes (figure 4) however a different pattern emerges. Observationally, it is the ‘Younger’ passengers who are marginally more likely to be fatally injured in the event of a side impact crash albeit non-statistically significantly (χ2= 5.184, df = 6, p = 0.520). With this in mind, the object struck in individual crashes was also examined (table 4). It was found that whilst the numbers of car-to-car crashes were comparable in each age-group, passengers in the ‘Younger’ age-group were four times more likely to be the passenger of a vehicle involved in crashes in which the object struck was a pole or tree whilst the ‘Older’ age-group were more likely to be the passenger of a vehicle involved in a collision with a truck/bus/van.
Table 4.
Object Struck in Side Impact Crashes
| 13 – 39 years | 40 – 64 years | 65 + years | |
|---|---|---|---|
| Car | 69.2% | 74.5% | 71.1% |
| Truck/Bus/Van | 12.9% | 17.7% | 19.3% |
| Pole/Tree | 6.3% | 1.3% | 1.5% |
| Other Object | 11.6% | 6.5% | 8.1% |
2. Injury Outcomes to Front Seat Passengers
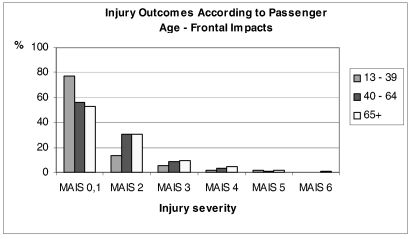
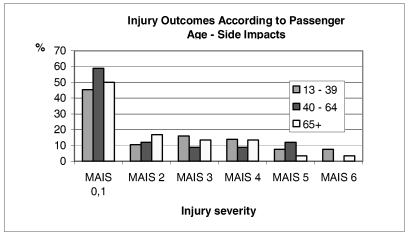
Figures 5 and 6 show injury outcomes according to passenger age. Figure 5 shows outcomes in frontal crashes whilst figure 6 shows outcomes in struck-side side impact crashes.
Figure 5.
Figure 6.
In figure 5, it is evident that differences in injury outcomes exist with ‘Younger’ occupants more likely to sustain MAIS 0 and 1 injuries compared to ‘Middle-aged’ and ‘Older’ occupants. However, older occupants were almost three times more likely to sustain MAIS 4+ injuries compared to ‘Younger’ occupants.
In figure 6, the relationship between occupant age and injury outcome was much less clear-cut. ‘Younger’ occupants were in fact, more likely to sustain injuries at the MAIS 4+ level. Given the differences in injury outcomes in both frontal and left-side impacts, the data were analysed further to look at injuries to specific body regions. All body regions were examined but the injury rates in most of the body regions were not statistically significant in each of the 3 groups.
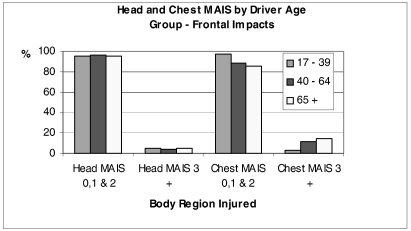
The head and chest regions were then further considered, as these were found to be the most frequent body regions injured. Figures 7 shows the Head and Chest MAIS outcomes in frontal impacts according to passenger age group. A chi-square test found that the overall distributions for head injury outcomes across the three age groups in frontal crashes did not differ (χ2 = 0.824, df = 2, p = 0.662). However when chest injuries were considered, differences in the overall distribution were supported by chi-square analysis (χ2 = 32.754, df = 2, p = 0.0001)
Figure 7.
In the vast majority of cases (87%), the seat belt was found to be the contact source for injuries at all levels of severity. In 9% of cases, the injury contact source could not be identified whilst only in some 4% of cases was the contact source found to be another interior object (other than the seat belt). Given the differences in chest injury outcomes and the effects of the seat belt as a contributory factor, the influence of pre-tensioned seat belts was examined (table 5)
Table 5.
Effect of Pre-tensioned Belt on Injury Outcome by Age
| 13–39 years | 40–64 years | 65+ years | ||||
|---|---|---|---|---|---|---|
| MAIS 0,1 & 2 | MAIS 3+ | MAIS 0,1 & 2 | MAIS 3+ | MAIS 0,1 & 2 | MAIS 3+ | |
| Belt Pretensioner | 100% | - | 93% | 7% | 100% | 0% |
| No Belt Pre-tensioner | 96% | 4% | 89% | 11% | 87% | 13% |
The results suggest that a pre-tensioned belt has an effect on reducing the level of severity to the chest in the event of a frontal impact crash. However, the analysis only partly explains why MAIS 3+ injury rates sustained by the ‘Middle-aged’ and ‘Older’ age group of passengers are higher in comparison to the ‘Younger’ age group. The effect of passenger sex was therefore considered. In the overall sample of passengers in frontal impacts, some 68% were female passengers and 32% male. However, when broken down according to age-group, the distribution changes – in the younger group, 59% were female compared to 41% male, in the middle group, 79% were female compared to 21% male and in the Older group, 84% were female compared to 16% male.
Table 6 shows the relationship between chest injury outcome and sex of passenger in frontal crashes.
Table 6.
Chest Injury Outcome by Age and Sex
| 13-39 years | 40-64 years | 65+ years | ||||
|---|---|---|---|---|---|---|
| MAIS 0,1 & 2 | MAIS 3+ | MAIS 0,1 & 2 | MAIS 3+ | MAIS 0,1 & 2 | MAIS 3+ | |
| Male | 91%* | 7%* | 91% | 9% | 79% | 21% |
| Female | 99% | 1% | 90% | 10% | 87% | 13% |
sex unknown in 2% of cases
As can be seen from the table, the proportion of females injured at the MAIS3+ level increases from 1% in the ‘Younger’ group to 13% in the ‘Older’ group. Given that the overall distribution of female/male passenger changes as the age increases, the difference in overall chest MAIS3+ distributions as shown in figure 7 may be explained by the increases in the numbers of females as passengers as age increases.
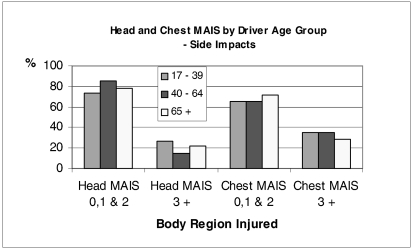
A somewhat different result was found for passengers involved in left-side crashes. There was no evidence to suggest that the passenger head injury rates differed between the three age groups of passengers (χ2 =1.578, df = 2, p = 0.454) and this is again contrary to intuitive expectations. However, when chest injuries were considered, there were also no differences in the overall distribution (χ2 = 0.424, df = 2, p = 0.809). Both the middle-aged and older age group were observed to have a higher albeit non-statistically significant rate of injuries at the MAIS 3+ level compared to the younger age-group of passengers (figure 8).
Figure 8.
The effect of passenger sex was also considered for passengers in struck-side crashes. In the overall sample of passengers in side impacts, some 54% were female passengers and 42% male. However, when broken down according to age-group, the distribution changes – in the younger group, 57% were female compared to 41% male, in the middle group, 82% were female compared to 18% male and in the Older group, 84% were female compared to 16% male.
Given that the sex distributions according to age are similar to those evident in frontal crashes, it was predicted that a higher proportion of ‘Older’ passengers and possibly also ‘Middle-aged’ passengers would have sustained MAIS 3+ chest injuries compared to the ‘Younger’ group. The reason why this did not occur is largely unclear although sample size may partly explain this finding.
DISCUSSION
This study has found that given assumed similar crash conditions, older passengers appear to be more at significantly greater risk of sustaining fatal and serious injuries in frontal crashes whilst both ‘Younger’ an ‘Older’ passengers are at greater risk of being seriously or fatally injured compared to ‘Middle-aged’ passengers in struck-side (left-side) crashes. Given that the overall crash severities between the groups of passengers do not differ significantly, object struck may partially explain the reason for the enhanced risk of fatality to the ‘Younger’ group in struck-side crashes - in both frontal and struck-side (left-side) impacts, ‘Younger’ passengers are more likely to be involved in collisions involving a pole or tree and it is in such crashes, particularly where the impact is concentrated to the passenger door, that adverse occupant outcome can be expected (e.g. Pilkington, 1998). Another factor could be that ‘Younger’ passengers travel in smaller vehicles leading to enhanced risk of fatality in crashes in struck-side crashes involving other cars.
However, the reason for enhanced risk of fatality to the ‘Older’ passenger in frontal crashes is not totally clear although when considering object struck, this group of passengers are involved in a higher proportion of crashes with trucks, buses and vans, where the possibility of ‘Under-ride’ exists.
For all passengers, the body region most prone to injury in frontal impact crashes is the chest. However, the ‘Older’ and also ‘Middle-aged’ passengers were found to be at greater risk of sustaining MAIS3+ chest injuries. It was further found that in frontal impacts, the vast majority of chest injuries are caused by the restraint system whereas other interior vehicle components accounted for only a small proportion (4%) of the injuries. Part of the reason for enhanced risk of MAIS3+ to both ‘Middle-aged’ and ‘Older’ passengers could be that a significant proportion of the passengers in these groups were female (compared to the ‘younger’ group where the difference in passenger sex is less pronounced) who are thought to be more prone to the effects of ageing (e.g. Berthel, 1980). The data therefore suggest overall that older female passengers are sustaining chest injuries via the seat belt. Interestingly, a seat-belt pre-tensioner was found to have a general effect of reducing the risk of MAIS 3+ chest injury to all age groups.
When injury rates to all other body regions besides the chest are examined, there is no discernible difference in injury rate. Most noteworthy, there does not appear to be an association between age and head injury outcome. Whilst this finding may not conform to somewhat intuitive predictions of increased head injury risk associated with ageing, it should be noted that there is little available head injury biomechanics literature to support the notion that head injury risk is actually enhanced as a person ages.
This study suggests some need for consideration of vehicle design given that by the year 2030, 1 in 4 persons will be aged over 65 in most OECD countries. In particular, vehicle restraint systems may need to offer better protection for older passengers Chest injury mitigation devices such as facia airbags, improvements in pre-tensioned and load-limiting seat belt systems may be seen to be beneficial in the course of time and it is necessary to regularly monitor injury outcomes through in-depth studies. Therefore it is important that biomechanical variation in tolerance to impact (due to age) is taken into account. Future methods for providing for such variability could include load limiting or discretionary web-lock mechanisms, which could be calibrated for specific occupant characteristics such as age, sex, weight and height as Mackay (1994) suggests. Such systems could recognise the age of individual passengers through key-card identification on entry into the vehicle. Another intervention that would be less reliant on technology (and therefore less expensive) could be the development of 4-point belt systems which would have the capability of distributing impact loading across the thorax in a less injurious manner.
It is also be important to monitor how effectively recent safety systems such as door and seat-mounted side airbags afford protection, particularly to the elderly vehicle occupant.
This study was intended as an overview of injury outcomes to older passengers. As with any study, a number of limitations are evident. Whilst the severity of the crash, crash type and object struck have been taken into account, some factors such as degree of overlap, intrusion extent and size of vehicle have not been closely scrutinised. Several factors influence injury outcomes in crashes and in-depth statistical follow up studies should be considered to examine several of the issues raised in greater detail. The situation regarding rear seat passengers also remains largely unexplored to date and will be considered at a later date.
ACKNOWLEDGEMENTS
This paper uses accident data from the United Kingdom Cooperative Crash Injury Study.
CCIS is managed by TRL Limited, on behalf of the Department for Transport (Vehicle Standards and Engineering Division) who fund the project with Autoliv, Daimler Chrysler, Ford Motor Company, LAB, Nissan Motor Company, Toyota Motor Europe, and Visteon.
The data were collected by teams from the Birmingham Automotive Safety Centre of the University of Birmingham; the Vehicle Safety Research Centre of Loughborough University; and the Vehicle Inspectorate Executive Agency of the DfT.
Further information on CCIS can be found at http://www.ukccis.org
REFERENCES
- Augenstein J. Differences in Clinical Response between the Young and the Elderly. Proceedings of the Ageing and Driving Symposium; Southfield, MI. 19–20 February 2001; Des Plaines, IL: Association for the Advancement of Automotive Medicine; 2001. [Google Scholar]
- Berthel M, Kuntzmann F, Moyses B, Bouket JL. La Perte Minerale Ousseuse Liee a L’age. Medicine et Hygenie. 1980;38:1828–1831. [Google Scholar]
- Charlton J, Andrea D, Fildes B, Morris A, Oxley J, Langford J, Johnson L. RACV Report. 2002. Safe Vehicle Choices for Older Adults. [Google Scholar]
- Cunningham C, Howard D, Walsh J, Coakley D, O'Neill D. The Effects of Age on Accident Severity and Outcome in Irish Road Traffic Accident Patients. Irish Medical Journal. 2001;94:169–171. [PubMed] [Google Scholar]
- Dejammes M, Ramet M. Aging Process and Safety Enhancements of Car Occupants. Proceedings of Enhanced Safety in Vehicles Conference; Melbourne, Australia. 1996. [Google Scholar]
- Diamantopoulou K, Skalova M, Dyte D, Cameron M. Crash Risks of Road User Groups in Victoria. (Report No.88) Melbourne, Victoria: Monash University Accident Research Centre; 1996. [Google Scholar]
- Evans L. Traffic Safety and the Driver. New York: 1991. ISBN 0-442-00163-0 Published by Van Nostrand Reinhold. [Google Scholar]
- Fildes BN, Fitzharris M, Charlton J, Pronk N. Older Driver Safety – A challenge for Sweden’s ‘Vision Zero’. Proceedings of the Australian Transport Research Forum; Hobart. April 2001. [Google Scholar]
- Foret-Bruno J-Y, et al. Correlation Between Thoracic Lesions and Force Values Measured at the Shoulder of 92 Belted Occupants Involved in Real accidents. Proceedings of 22nd Stapp Car Crash Conference; 1978. [Google Scholar]
- Foret-Bruno JY, Brun-Cassan F, Brigout C, Tarriere C. Thoracic Deflection of Hybrid III: Dummy Response for Simulations of Real Accidents. Proceedings of 12th Experimental Safety Vehicles conference; 1989. [Google Scholar]
- Hu P, Jones D, Reuscher T, Schmoyer R, Truett T. Report for the National Highway Traffic Safety Administration. Oak Ridge National Laboratory Tennessee; ONRL: 2000. Projecting fatalities in crashes involving older drivers. [Google Scholar]
- Mackay GM, Hassan AM. Age and Gender Effects on Injury Outcome for Restrained Occupants in Frontal Crashes. A Comparison of UK and US Databases. Proceedings of the AAAM Conference; Chicago, Illinois. 2000. [PMC free article] [PubMed] [Google Scholar]
- Mackay GM. Biomechanics and the Regulation of Vehicle Crash Performance. Proceedings of 33rd AAAM Conference; Baltimore, USA. 1989. [Google Scholar]
- Mackay GM, Parkin S, Scott A. Intelligent Restraint Systems – What Characteristics Should They Have?. Advances in Occupant Restraint Technologies: Joint AAAM/IRCOBI Special Session; Lyon, France. 1994. [Google Scholar]
- Morris AP, Welsh RH, Frampton R, Charlton J, Fildes BN. An Overview of Requirements for the Crash Protection of Older Drivers. Proceedings of AAAM Conference; Tempe, Arizona. 2002. [PubMed] [Google Scholar]
- Morris AP, Mackay GM, Wodzin E, Barnes JS. Some Injury Scaling Issues in UK Crash Research. Proceedings of the IRCOBI Conference; Lisbon Portugal. 2003. (in press) [Google Scholar]
- OECD. Ageing and Transport: Mobility Needs and Safety Issues. Report published by an OECD Scientific Expert Group; Paris, France. 2001. [Google Scholar]
- Padmanaban J. Crash Injury Experience of Elderly Drivers. Proceedings of the Ageing and Driving Symposium, Southfield, MI, 19–20 February 2001; Association for the Advancement of Automotive Medicine, Des Plaines, IL. 2001. [Google Scholar]
- Pilkington GB. Utility Poles – A Highway Safety Problem. Public Roads. 1988;152(3):61–66. [Google Scholar]
- Viano D, Culver CC, Evans L, Frick M, Scott R. Involvement of Older Drivers in Multi-Vehicle Side Impact Crashes. Proceedings of 33rd AAAM Conference; Baltimore, USA. 1989. [Google Scholar]


