Abstract
Clustering periodically expressed genes from their time-course expression data could help understand the molecular mechanism of those biological processes. In this paper, we propose a nonlinear model-based clustering method for periodically expressed gene profiles. As periodically expressed genes are associated with periodic biological processes, the proposed method naturally assumes that a periodically expressed gene dataset is generated by a number of periodical processes. Each periodical process is modelled by a linear combination of trigonometric sine and cosine functions in time plus a Gaussian noise term. A two stage method is proposed to estimate the model parameter, and a relocation-iteration algorithm is employed to assign each gene to an appropriate cluster. A bootstrapping method and an average adjusted Rand index (AARI) are employed to measure the quality of clustering. One synthetic dataset and two biological datasets were employed to evaluate the performance of the proposed method. The results show that our method allows the better quality clustering than other clustering methods (e.g., k-means) for periodically expressed gene data, and thus it is an effective cluster analysis method for periodically expressed gene data.
Keywords: Gene expression data, nonlinear model, periodicall expressed genes, clustering, average adjusted Rand index
1. BACKGROUND
Many biological processes such as cell-cycle division exhibit periodic behaviors. To understand the mechanisms of these biological processes, DNA microarray experiments have been employed to produce gene expression profiles at a series of time points, for example, the cell division cycle processes of yeast Saccharomyces cerevisiae [1, 2], bacterium Caulobacter crescentus [3], and human being [4]. Such time-course gene expression data provides a dynamic snapshot of most (if not all) of the genes related to the biological development process. It is believed that clustering periodically expressed gene from their time-course expression data could help understand the molecular mechanisms of those biological processes.
In past decade, a number of methods have been proposed for identifying and clustering periodically expressed genes. The discrete Fourier transform method is the earliest method for identifying and clustering periodically expressed genes [1–4]. In these papers, the discrete Fourier transform is applied to gene expression data to get a two-dimensional vector. One component of the vector is the sum of all coefficients of sine functions while another component is the sum of all coefficients of cosine functions. Then the magnitude of the two-dimensional vector is used to measure periodicity of time-course gene expression profile. The rather subjective cut-off value is taken to determine if a gene is periodically expressed. By this way, Spellman et al. determine that 800 genes are periodically expressed out of more 6000 gene expression profiles from yeast Saccharomyces cerevisiae. After performing cluster analysis, these 800 genes are divided into five groups [2]. However, microarray experiments typically generate short time-course data. As pointed in [5, 6], the frequency resolution obtained on such short time-course data by the discrete Fourier transform is often not adequate for resolving periodicities of interest.
Authors in [7] propose a method called CORRCOS to find periodically expressed genes. CORRCOS generates totally 101000 periodic synthetic models. Each gene expression profile is compared to each of these 101000 models. Although it can identify periodically expressed gene, CORRCOS is too time consuming and the cross-correlation is not real metric. In [6], authors develop another algorithm named RAGE for detecting periodically expressed genes. Like CORRCOS, RAGE is a synthetic model-based method. Compared with CORRCOS, RAGE is less time consuming [6]. Wichert et al. [8] propose a statistical method to identify periodically expressed genes from their time-course gene expression profiles. The method models gene expression profiles also as sine functions use the Fisher g-test for statistical analysis. Given a time-course gene expression profile yt (t = 1,2,…, m), the g-static is defined as
| (1.1) |
where
| (1.2) |
is called the periodogram. It is assumed that if a time-course gene expression profile has a significant sinusoidal component with frequency ω0 ∈ [0, π], the periodogram exhibits a peak at that frequency with a high probability. On the other hand, if a time-course gene expression profile is purely random, the periodogram reduces to a straight line. Based on Fisher g-test [9], Chen [10] proposes a C&G procedure to identify periodically expressed genes from their time-course expression profiles. The g-statistic is effective only for evenly spaced gene expression profiles. For unevenly spaced gene expression profiles, Chen et al. propose to use Lomb-Scargle periodograms to discover statistically significant periodic gene expression [11, 12]. However, a recent research [13] has concluded that the Fisher g-test is poor if the time-course data is short and/or that data length is not an integer number of periods. Therefore, one can not expect to get a good clustering based on periodically expressed genes identified from these methods.
On the other hand, a number of clustering methods have been proposed for cluster analysis on gene expression data. These include distance/correlation-based clustering methods (e.g., hierarchical clustering [14], k-means clustering [15], and self-organizing maps [16]) and static model-based clustering methods [17, 18]. In these methods, gene expression profiles are viewed as multidimensional vectors. Distance/correlation-based clustering methods cluster genes based on the distance/correlation among their expression profiles. Static model-based clustering methods assign genes to one of clusters if their expression profiles may be generated by a multivariate normal distribution. These methods do not take into account the dynamic of time-course gene expression data and thus are not efficient for periodically expressed gene data.
Recently, some dynamic model-based clustering methods have been proposed to analyze time-course gene expression data [19, 20]. These methods employ autoregressive models to describe the dynamics of time-course gene expression data. As periodically expressed genes are associated with periodic biological processes, it is natural to model a periodically expressed gene data by periodic (nonlinear) function. This paper proposes a nonlinear model based method for clustering periodically expressed genes from their time-course expression profiles. The proposed method assumes that a periodically expressed gene dataset is generated by a number of periodical processes which are modelled by a linear combination of trigonometric sine and cosine functions in time plus a Gaussian noise term. A two-stage method is proposed to estimate the model parameters, and a relocation-iteration algorithm is employed to assign each gene to an appropriate cluster. A bootstrapping method and an average adjusted Rand index (AARI) are employed to measure the quality of clustering. One synthetic dataset and two biological datasets were employed to evaluate the performance of the proposed method.
2. METHODS
2.1. Model for Periodically Expressed Gene Profiles
Let x(t) (t = 1,2,…, m) be a time-course gene expression profile generated from a periodical biological process, where m is the number of time points at which gene expression is measured. After shifting the mean of gene expression profiles to 0, the periodicity of this time-course gene expression profile can be modeled by a linear combination of trigonometric sine and cosine functions in time plus a Gaussian noise term as follows [21]
| (2.1) |
where a and b are the coefficients of sine and cosine function, respectively; ω is the frequency of periodic expression data, and ε(t) represent random errors. This study assumes that the errors have a normal distribution independent of time with the mean of 0 and the variance of σ2. This model is equivalent to sinusoidal function model [7, 8, 10–13]
| (2.2) |
which are widely used to generate the synthetic periodic gene expression profiles [7] and to detect the periodically expressed genes [2, 8, 10–12]. In model (2.2), is called magnitude and Φ = arctan(a/b) is called the phase.
Given a time-course gene expression profile x(t) (t = 1, 2,…, m), estimating parameters a, b, and ω in model (2.1) is a nonlinear estimation problem as ω is nonlinear in the model. In general, all nonlinear optimization programs can be used to estimate parameters in model (2.1), for example, Gauss-Newton iteration method and its variants such as Box-Kanemasu interpolation method, Levenberg damped least squares methods, and Marquardt's method [22]. However, these iteration methods are sensitive to initial values. Another main shortcoming is that these methods may converge to the local minimum of the least squares cost function and thus cannot find the true values of the parameters.
Our observation is that noise-free model (2.1)
| (2.3) |
can be viewed as the general solution of a following second-order ordinary differential equation
| (2.4) |
and that ω2 is linear in equation (2.4) which is independent of a and b. Therefore, we propose the following two-step parameter estimation methods to estimate parameters a, b, and ω in model (2.2).
Step 1 —
Numerically calculate the second derivative of x(t). Then, based on equation (2.4), use linear least squares method to estimate parameter ω2. In details, let
(2.5) then, by the least squares method, ω2 is estimated as
(2.6) as time-course gene expression data are discrete, the second derivative is estimated by the central finite difference formula as follows:
(2.7) where Δ is time difference between two consecutive gene expression data points. From (2.7), the length of vectors X2 and X1 is m − 2. Note that if the value of calculated by (2.6) for a gene is negative, this gene will be judged not to be periodically expressed.
Step 2 —
Substitute the estimated value of ω into (2.2). Apply the maximum likelihood method to model (2.1) to estimate parameters a and b. In detail, let
(2.8) by the least squares method, a and b are estimated as
(2.9)
2.2. Nonlinear Model-Based Clustering
2.2.1. The Mixture Model
In this study, it is assumed that a time-course gene expression dataset is a collection of periodically expressed gene profiles which belong to several clusters, and profiles in each cluster can be described by model (2.1) or (2.2) with different parameters. Let θk = [ak, bk, ωk, σk2] be parameters of model (2.1) for the kth cluster. Then the task of nonlinear model-based clustering is as follows: for a given number of cluster K, divide a time-course gene expression dataset into a partition C = {C1,…, Ck ,…, CK} using model (2.1) with parameters θk = [ak, bk, ωk, σk2] (k = 1,…, K) which minimize
| (2.10) |
where the parameters Θ consist of {θk, k = 1,…, K}.
2.2.2. Estimation of Model Parameters
According to the parameter estimation method proposed in previous section for a single time-course expression profile, for the kth cluster parameters, θk = [ak, bk, ωk, σk2] can be estimated as
| (2.11) |
where |Ck| represents the number of time series in cluster Ck, ∑k=1K|Ck| = N.
2.2.3. Algorithm
This study employs a relocation-iteration algorithm as shown in Algorithm 1 to estimate the parameters such that the cost function (2.10) is minimized. In 2(a) of Algorithm 1, Θt represents the estimated parameters in cost function (2.10) at iteration t while, in 2(b), parameters, and represent the parameters of model k at iteration t.
Algorithm 1.
Algorithm for nonlinear model-based clustering.
2.3. Evaluation
In this study, we use the adjusted Rand index (ARI) [23] to evaluate the quality of the clustering. Consider two partitions of N objects: the r-cluster partition U = {u1,…ur} and the s-cluster partition V = {v1,…, vs}. One may construct a contingency table (matrix) as in Table 1.
Table 1.
Contingency table for two partitions of n objects.
| v 1 | v 2 | v s | Total | ||
|---|---|---|---|---|---|
| u 1 | n 11 | n 12 | ⋯ | n 1s | n 1. |
| u 2 | n 21 | n 22 | ⋯ | n 2s | n 2. |
| ⋮ | ⋮ | ⋮ | ⋮ | ⋮ | |
| u r | n r1 | n r2 | ⋯ | n rs | n r. |
|
| |||||
| Total | n .1 | n .2 | ⋯ | n .s | n .. = n |
In Table 1, entry nij is the number of objects that are both in clusters ui and vj, i = 1,…, r, j = 1,…, s. Let ni. = ∑j=1snij and n.j = ∑i=1rnij denote the sum of row i (i = 1,…, r) and the sum of column j (j = 1,…, s) in the contingency matrix, respectively, and let V = N(N − 1)/2 (the number of pairs of N objects). Based on the contingency matrix of two partitions, the ARI is defined as [23]
| (2.12) |
The expected value of ARI is 1 when they matched perfect and 0 when the two partitions are selected at random.
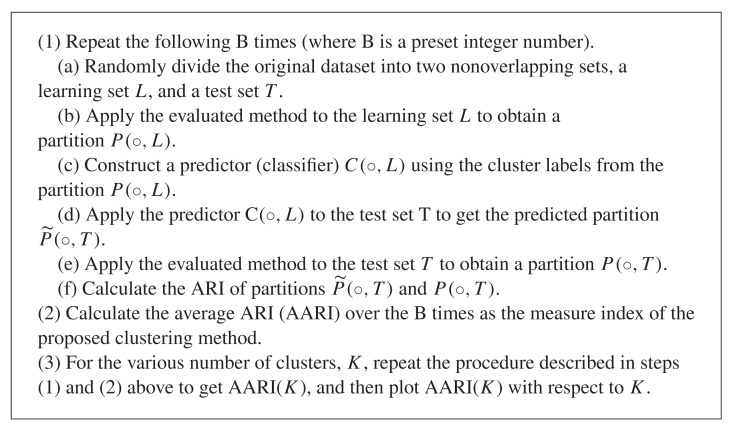
If the true cluster labels for some dataset are known, the proposed clustering methods can be applied these datasets to obtain new cluster labels. Then ARI can be calculated for these two partitions. If ARI is close to 1, one can say that the proposed clustering method is in agreement with the true clusters. However, for real-life gene expression datasets, the true cluster labels are typically unknown. For this case, this study adopts a bootstrapping approach as shown in Algorithm 2 [20] to evaluate the proposed clustering methods. For the given number of clusters, K, the average ARI (AARI) reports the quality of the clustering result obtained from the evaluated clustering methods. Accordingly, the larger AARI, the better the quality of the clustering is, that is, the better the performance of the clustering method is.
Algorithm 2.
The procedure for evaluating proposed clustering method.
3. EXPERIMENTAL RESULTS AND DISCUSSION
This study employs a synthetic dataset and two biological datasets to investigate the performance of the proposed method in different aspects.
3.1. Synthetic Dataset (SYN)
The synthetic dataset is generated by model (2.1). Let xit be the simulated expression (log-ratio) values of gene i at time point t in the dataset, that is,
| (3.1) |
where n is the number of genes, m is the number of time points, and K is the number of clusters.
In this study, parameters for synthetic data ak, bk, and wk are randomly chosen as follows:
| (3.2) |
where nk is the number genes in the kth cluster. The resulted parameters for synthetic data are shown in Table 2.
Table 2.
Parameters for synthetic data.
| Cluster 1 | Cluster 2 | Cluster 3 | Cluster 4 | Cluster 5 | |
|---|---|---|---|---|---|
| a k | 3.4397 | 6.9227 | 9.9126 | 12.1470 | 14.8819 |
| b k | 2.3705 | 6.0603 | 8.9280 | 12.2379 | 14.8195 |
| w k | 5.1516 | 3.1085 | 1.9359 | 1.5344 | 1.2413 |
| σ k | 0.4000 | 0.4000 | 0.4000 | 0.4000 | 0.4000 |
| n k | 136 | 300 | 279 | 239 | 120 |
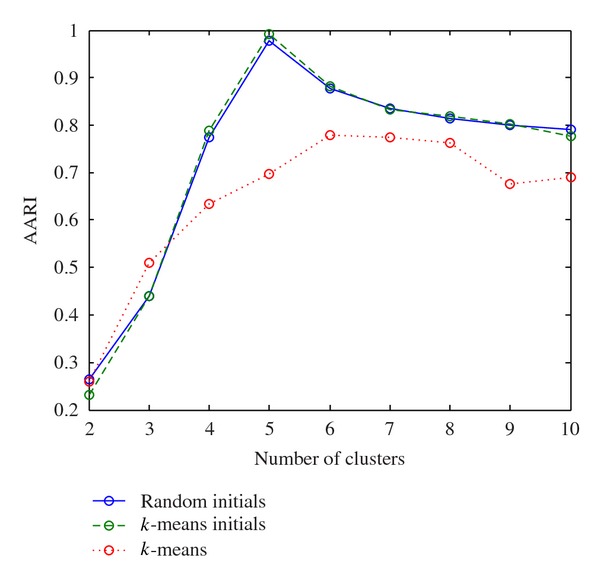
For various numbers of clusters, we run the proposed method described in Algorithm 1 with randomly chosen initial partitions, with the initial partitions from k-means results as and to the k-means methods. The ARI between clustering results and the known true cluster labels is calculated. The values of AARI are calculated over 20 runs and shown in the Table 3 and Figure 1.
Table 3.
The values of AARI for different clustering methods on synthetic data.
| No. of clusters | 2 | 3 | 4 | 5 | 6 | 7 | 8 | 9 | 10 |
|---|---|---|---|---|---|---|---|---|---|
| Random initial | 0.2638 | 0.4391 | 0.7734 | 0.9778 | 0.8766 | 0.8361 | 0.8140 | 0.7991 | 0.7895 |
| k-means | 0.2586 | 0.5088 | 0.6335 | 0.6970 | 0.7794 | 0.7731 | 0.7620 | 0.6758 | 0.6904 |
| k-means initial | 0.2310 | 0.4391 | 0.7889 | 0.9913 | 0.8824 | 0.8328 | 0.8185 | 0.8027 | 0.7771 |
Figure 1.

Plot of ARRI over different number of clusters for synthetic dataset.
From Figure 1, the proposed method with both initial partitions randomly chosen and those from k-means results has greater value of AARI than k-means when the number of clusters is greater than 3. Furthermore, when the number of clusters is the true value of 5, the AARI of the proposed method with both initial partitions reaches its maximum, which makes sense. However, the AARI of k-means method did not reach its maximum when the number of clusters is 5. Therefore, we can conclude that the proposed method outperforms the k-means in terms of AARI.
3.2. Real-Life Datasets
In this study, two real-life datasets are employed to illustrate the proposed method: ELU and BAC. ELU consist of expression profiles of 4304 genes without missing data. Expression profiles are obtained from yeast cell cycle division process through Eluration-synchronized experiments conducted by Spellman et al. [2]. Each expression profile has 14 equally spacing time points. BAC consists of expression profiles of 1590 genes without missing data. Expression profiles are measured during the cell cycle division process of the bacterium Caulobacter crescentus [3]. The measurements were taken at 11 equally spaced time points over 150 minutes. Both datasets are preprocessed in the following two steps.
Step 1 —
Shift the mean of each gene expression profile to 0.
Step 2 —
Filter the dataset with F-test at the significance level α, that is,
(3.3) where RHi is the sum of squared errors under the specific hypothesis and m is the number of time points. Keep the genes which reject the null hypothesis (show periodical behaviours) [21].
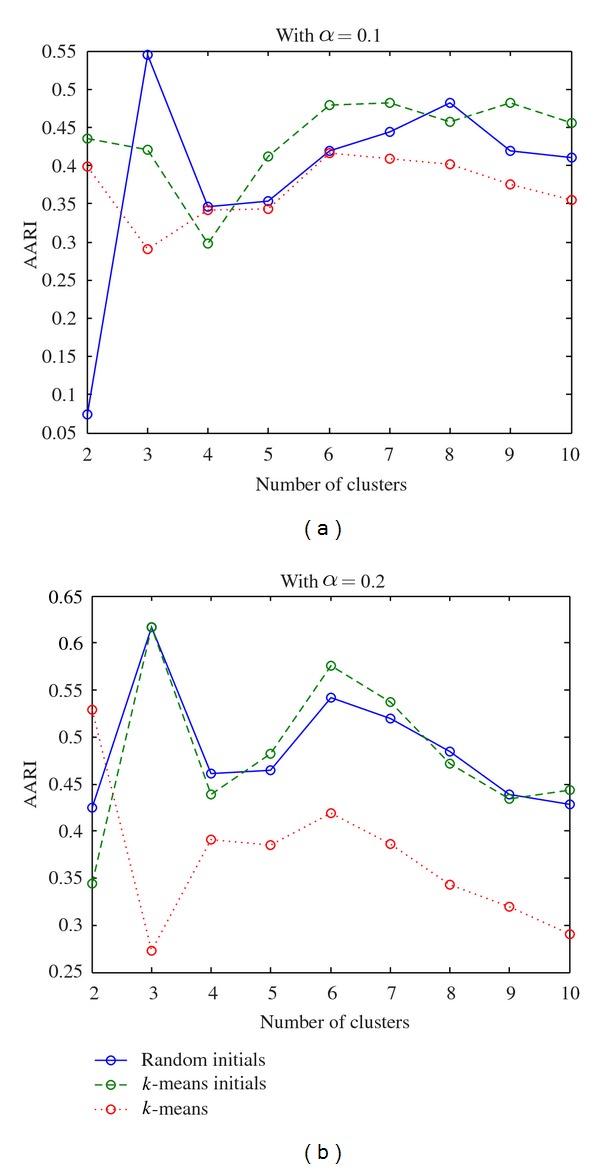
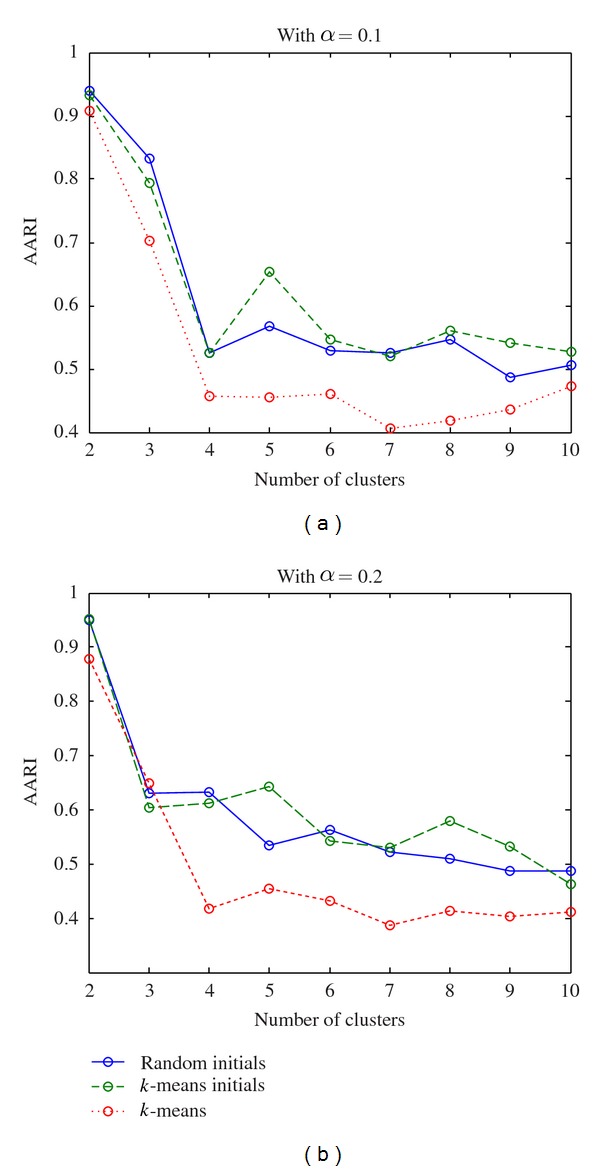
After these two steps, the number of genes remains for different significant level as in Table 4. Then we run the evaluation procedure proposed in Algorithm 2 on these selected gene expression profiles. The AARIs of the proposed method and k-means over various numbers of clusters are plotted in Figures 2 and 3 for dataset ELU and BAC, respectively. From Figures 2 and 3 the results from both real-life datasets show that the proposed method outperforms the k-means in terms of AARI.
Table 4.
The number of genes after filtering.
| α | 0.10 | 0.20 |
|---|---|---|
| ELU | 691 | 1207 |
| BAC | 471 | 658 |
Figure 2.

Plot of ARRI over different number of clusters for ELU after filtering.
Figure 3.

Plot of ARRI over different number of clusters for BAC after filtering.
4. CONCLUSIONS
This paper has presented a nonlinear model-based method for clustering periodically expressed genes from their time-course expression profiles. In this method, profiles of periodically expressed genes and thus the cluster of profiles are modelled by a linear combination of trigonometric sine and cosine functions in time plus a Gaussian noise term which is equivalent to a sinusoidal function model [1–4, 6–13, 17–19]. Although this model is not new, the existing methods are not based on parameter estimation technique, especially not estimating the frequency in the model as it is nonlinear in parameter. In the presented method, a two step linear least squares method is proposed to estimate all model parameters including the frequency for each clusters. Computational experiments on one synthetic dataset and two biological datasets show that the proposed method outperforms the traditional clustering methods such as k-means in terms of AARI, which indicate that the proposed method can effectively cluster periodically expressed genes from their time-course expression profiles.
CONFLICT OF INTERESTS
The authors declare that there are no conflict of interests.
ACKNOWLEDGMENTS
This research is supported by Science and Technology Funds of Beijing Ministry of Education (SQKM201210037001) through the first author and Natural Sciences and Engineering Research Council of Canada (NSERC) through other authors.
References
- 1.Cho RJ, Campbell MJ, Winzeler EA, et al. A genome-wide transcriptional analysis of the mitotic cell cycle. Molecular Cell. 1998;2(1):65–73. doi: 10.1016/s1097-2765(00)80114-8. [DOI] [PubMed] [Google Scholar]
- 2.Spellman PT, Sherlock G, Zhang MQ, et al. Comprehensive identification of cell cycle-regulated genes of the yeast Saccharomyces cerevisiae by microarray hybridization. Molecular Biology of the Cell. 1998;9(12):3273–3297. doi: 10.1091/mbc.9.12.3273. [DOI] [PMC free article] [PubMed] [Google Scholar]
- 3.Laub MT, Chen SL, Shapiro L, McAdams HH. Global analysis of the genetic network controlling a bacterial cell cycle. Science. 2000;290(5499):2144–2148. doi: 10.1126/science.290.5499.2144. [DOI] [PubMed] [Google Scholar]
- 4.Whitfield ML, Sherlock G, Saldanha AJ, et al. Identification of genes periodically expressed in the human cell cycle and their expression in tumors. Molecular Biology of the Cell. 2002;13(6):1977–2000. doi: 10.1091/mbc.02-02-0030.. [DOI] [PMC free article] [PubMed] [Google Scholar]
- 5.Filkov V, Skiena S, Zhi J. Analysis techniques for microarray time-series data. In: Proceedings of the 5th Annual Internatinal Conference on Computational Biology; May 2001; pp. 124–131. [DOI] [PubMed] [Google Scholar]
- 6.Langmmead CJ, Yan AK, McCung CR, Donald BR. Phase-independent Rhythmic analysis of genome-wide expression patterns. In: Proceedings of the Sixth Annual International Conference on Computational Biology; 2011; pp. 1–11. [DOI] [PubMed] [Google Scholar]
- 7.Harmer SL, Hogenesch JB, Straume M, et al. Orchestrated transcription of key pathways in Arabidopsis by the circadian clock. Science. 2000;290(5499):2110–2113. doi: 10.1126/science.290.5499.2110. [DOI] [PubMed] [Google Scholar]
- 8.Wichert S, Fokianos K, Strimmer K. Identifying periodically expressed transcripts in microarray time series data. Bioinformatics. 2004;20:5–20. doi: 10.1093/bioinformatics/btg364. [DOI] [PubMed] [Google Scholar]
- 9.Fisher RA. Test of significance in harmonic analysis. Proceedings of the Royal Society A. 1929;125:54–59. [Google Scholar]
- 10.Chen J. Identification of significant periodic genes in microarray gene expression data. BMC Bioinformatics. 2005;6, article 286 doi: 10.1186/1471-2105-6-286. [DOI] [PMC free article] [PubMed] [Google Scholar]
- 11.Glynn EF, Chen J, Mushegian AR. Detecting periodic patterns in unevenly spaced gene expression time series using Lomb-Scargle periodograms. Bioinformatics. 2006;22(3):310–316. doi: 10.1093/bioinformatics/bti789. [DOI] [PubMed] [Google Scholar]
- 12.Chen J, Chang KC. Discovering statistically significant periodic gene expression. International Statistical Review. 2008;76(2):228–246. [Google Scholar]
- 13.Liew AWC, Law NF, Cao XQ, Yan H. Statistical power of Fisher test for the detection of short periodic gene expression profiles. Pattern Recognition. 2009;42(4):549–556. [Google Scholar]
- 14.Eisen MB, Spellman PT, Brown PO, Botstein D. Cluster analysis and display of genome-wide expression patterns. Proceedings of the National Academy of Sciences of the United States of America. 1998;95(25):14863–14868. doi: 10.1073/pnas.95.25.14863. [DOI] [PMC free article] [PubMed] [Google Scholar]
- 15.Yeung KY, Fraley C, Murua A, Raftery AE, Ruzzo WL. Model-based clustering and data transformations for gene expression data. Bioinformatics. 2001;17(10):977–987. doi: 10.1093/bioinformatics/17.10.977. [DOI] [PubMed] [Google Scholar]
- 16.Törönen P, Kolehmainen M, Wong G, Castrén E. Analysis of gene expression data using self-organizing maps. FEBS Letters. 1999;451(2):142–146. doi: 10.1016/s0014-5793(99)00524-4. [DOI] [PubMed] [Google Scholar]
- 17.Ghosh D, Chinnaiyan AM. Mixture modelling of gene expression data from microarray experiments. Bioinformatics. 2002;18(2):275–286. doi: 10.1093/bioinformatics/18.2.275. [DOI] [PubMed] [Google Scholar]
- 18.McLachlan GJ, Bean RW, Peel D. A mixture model-based approach to the clustering of microarray expression data. Bioinformatics. 2002;18(3):413–422. doi: 10.1093/bioinformatics/18.3.413. [DOI] [PubMed] [Google Scholar]
- 19.Ramoni MF, Sebastiani P, Kohane IS. Cluster analysis of gene expression dynamics. Proceedings of the National Academy of Sciences of the United States of America. 2002;99(14):9121–9126. doi: 10.1073/pnas.132656399. [DOI] [PMC free article] [PubMed] [Google Scholar]
- 20.Wu FX, Zhang WJ, Kusalik AJ. Dynamic model-based clustering for time-course gene expression data. Journal of Bioinformatics and Computational Biology. 2005;3(4):821–836. doi: 10.1142/s0219720005001314. [DOI] [PubMed] [Google Scholar]
- 21.Wu FX. Identification of periodically expressed genes from their time-course expression profiles. In: Proceedings of the International Symposium on Bioinformatics Research and Applications, (ISBRA ’10); May 2010; pp. 12–15. [Google Scholar]
- 22.Beck JV, Arnold KJ. Parameter Estimation in Engineering and Science. New York, NY, USA: John Wiley & Sons; 1977. [Google Scholar]
- 23.Krieger AM, Green PE. A generalized rand-index method for consensus clustering of separate partitions of the same data base. Journal of Classification. 1999;16(1):63–89. [Google Scholar]


