Abstract
Wild birds have been implicated in the spread of highly pathogenic avian influenza (HPAI) of the H5N1 subtype, prompting surveillance along migratory flyways. Sampling of wild birds for avian influenza virus (AIV) is often conducted in remote regions, but results are often delayed because of the need to transport samples to a laboratory equipped for molecular testing. Real-time reverse transcriptase polymerase chain reaction (rRT-PCR) is a molecular technique that offers one of the most accurate and sensitive methods for diagnosis of AIV. The previously strict lab protocols needed for rRT-PCR are now being adapted for the field. Development of freeze-dried (lyophilized) reagents that do not require cold chain, with sensitivity at the level of wet reagents has brought on-site remote testing to a practical goal.
Here we present a method for the rapid diagnosis of AIV in wild birds using an rRT-PCR unit (Ruggedized Advanced Pathogen Identification Device or RAPID, Idaho Technologies, Salt Lake City, UT) that employs lyophilized reagents (Influenza A Target 1 Taqman; ASAY-ASY-0109, Idaho Technologies). The reagents contain all of the necessary components for testing at appropriate concentrations in a single tube: primers, probes, enzymes, buffers and internal positive controls, eliminating errors associated with improper storage or handling of wet reagents. The portable unit performs a screen for Influenza A by targeting the matrix gene and yields results in 2-3 hours. Genetic subtyping is also possible with H5 and H7 primer sets that target the hemagglutinin gene.
The system is suitable for use on cloacal and oropharyngeal samples collected from wild birds, as demonstrated here on the migratory shorebird species, the western sandpiper (Calidrus mauri) captured in Northern California. Animal handling followed protocols approved by the Animal Care and Use Committee of the U.S. Geological Survey Western Ecological Research Center and permits of the U.S. Geological Survey Bird Banding Laboratory. The primary advantage of this technique is to expedite diagnosis of wild birds, increasing the chances of containing an outbreak in a remote location. On-site diagnosis would also prove useful for identifying and studying infected individuals in wild populations. The opportunity to collect information on host biology (immunological and physiological response to infection) and spatial ecology (migratory performance of infected birds) will provide insights into the extent to which wild birds can act as vectors for AIV over long distances.
Protocol
1. Wild bird capture using mist nets
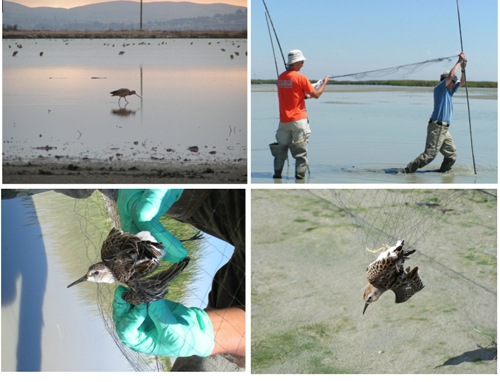
For shorebird capture, set up mist nets at an active foraging site such as a marsh, shoreline, or mud flat.
Slide trammel line loops of one end of the mist net around the pole and insert pole vertically into mud.
Stretch out net, insert second pole through trammel loops at other end of mist net and vertically insert pole into mud, making sure that the trammel lines are taught.
Once a bird is captured, extract the bird from the net and return to the banding station.
2. Cloacal swab sampling
Collect cloacal swabs immediately after capture
Locate the cloaca and use fingertips to push back surrounding feathers
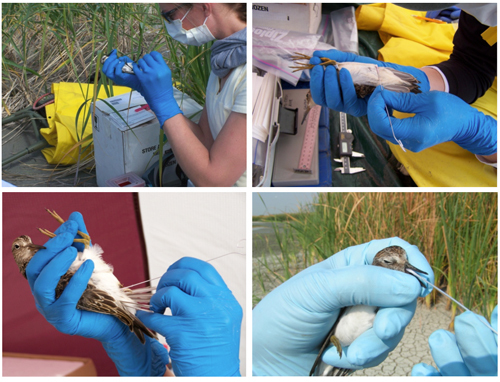
Unwrap a sterile Dacron- or Polyester-tipped swab, stem end first, and moisten the tip with sterile viral transport media for greater ease in swabbing. After moistening, the entire head of the swab is gently inserted into the cloaca. Swab the inside circumference of the cloaca by slowly twirling the swab and remove the swab from cloaca.
Inserting the swab tip directly into the viral transport media sample vial; rotate the swab shaft between the thumb and forefinger while the swab is in the media. Have an assistant complete the procedure by pulling the tip of the swab back from the bottom of the vial ~ 1 cm and cut the shaft of the swab with a pair of scissors so the swab tip remains in the vial and the shaft does not interfere with cap closure. Cap vial tightly. Disinfect the scissors with alcohol in between cutting swab shafts.
Place the vials in a freezer box containing either dry ice or ice packs.
3. Oropharyngeal swab sampling
Gently open the bird's beak so that the choanal slit is visible
Unwrap a clean swab from the package, stem end first, and moisten the tip with viral transport media for greater ease in swabbing
Without touching the tip to any other surfaces, insert it into the mouth and swab the choanal opening on the roof of the mouth and continue back towards the oropharyngeal or throat region
Place the swab tip directly into the viral transport media vial. Rotate the swab shaft between the thumb and forefinger while the swab is in the media. As above, have an assistant pull the tip of the swab back from the bottom of the vial ~ 1 cm and cut the shaft of the swab with a pair of scissors so the swab tip remains in the vial and the shaft does not interfere with cap closure. Cap vial tightly. Disinfect the scissors with alcohol in between cutting swab shafts.
Place the vials in a freezer box containing dry ice or ice packs.
4. Bird handling and release
Return bird to the site of capture and release in a timely manner (<20mins). Handlers should be aware of the principles of animal welfare and be alert for signs of bird suffering during sampling (i.e. abrasions, capture myopathy and hypo- or hyperthermia). A basic first aid kit should be included in the equipment list.
5. Testing facilities
Samples can be tested in any enclosed space such as a research trailer or tent, with a power supply (voltage-regulated power generator) to run the PCR unit and attached computer.
6. RNA extraction
RNA extraction was performed with the RNeasy Mini kit with minor modifications to the manufacturer's instructions following Spackman et al. 1
Vortex the swab medium for 3-5 s and transfer 350 μl to a 2 ml microcentrifuge tube. Note: Keep remainder sample on ice in case PCR-positive samples need to be rescreened or H5 test needs to be run.
Add 350 μl of RLT buffer (with β-me) and vortex for 5 s.
Add 350 μl of RNA grade 70% ethanol.
Centrifuge at 5,000 x g for 5 min.
Add 600 μl of the supernatant to a spin column placed in a 2 ml collection tube. Retain the remaining sample in test tube rack.
Centrifuge for 20 s at 10,000 x g and discard flow-through.
Repeat steps 17-18 until all the sample has been passed through spin column.
Place spin column in a clean 2 ml collection tube.
Add 700 μl of RW1 buffer to the spin column and centrifuge 25 s at 10,000 x g. Discard the flow-through.
Add 500 μl RPE buffer to the spin column and centrifuge for 25 s at 10,000 x g. Discard the flow-through.
Repeat step 22 for a total of two washes with RPE buffer.
Centrifuge the spin column for an additional 2 minutes at 14,000 x g. Discard collection tube.
Place the spin column in a clean 1.5 ml microcentrifuge tube and add 50μl of nuclease-free water. Incubate at room temperature for 60 s.
Elute RNA by spinning for 60 s at 10,000 x g for 60 s. Place purified sample on ice.
7. Preparing negative controls
Lyophilized reagents were prepared for use in the PCR assay according to instructions from the Idaho Technologies Freeze-Dried Reagent Detection Kit for TaqMan Probes Influenza A Target 1 (ASAY-ASY-0109).
Centrifuge negative control reagent vial (red) for 3 s to ensure pellets are at the bottom.
Remove cap, visually make sure pellets are at the bottom.
Add 20 μl of 2 X Reconstitution Buffer and 20 μl Reagent Grade Water.
Recap and vortex for 5 s at maximum speed.
Centrifuge for 3 s to bring liquid to bottom of vial.
Visually check the pellet has rehydrated, if not repeat steps 31-32.
Pipette 19 μl of the hydrated mixture into a Lightcycler capillary tube, repeat pipette step into a second capillary to obtain a duplicate.
8. Preparing test samples
Centrifuge the unknown reagent vial (blue) for 3 sec to ensure pellets are at the bottom.
Remove cap, visually make sure pellets are at the bottom.
Add 40 μl of purified RNA.
Recap and vortex for 5 s at maximum speed.
Centrifuge for 3 s to bring liquid to bottom of vial.
Visually check the pellet has rehydrated, if not repeat steps 38-39.
Pipette 19 μl of hydrated mixture into a Lightcycler capillary tube, repeat pipette step into a second capillary to obtain a duplicate.
9. Preparing positive controls
Centrifuge the positive control reagent vial (green) for 3 s to ensure pellets are at the bottom.
Remove cap, visually make sure pellets are at the bottom.
Add 20 μl of 2 X Reconstitution Buffer and 20 μl Reagent Grade Water.
Recap and vortex for 5 s at maximum speed.
Centrifuge for 3 s to bring liquid to bottom of vial.
Visually check the pellet has rehydrated, if not repeat steps 45-46.
Pipette 19 μl of the hydrated mixture into a Lightcycler capillary tube, repeat pipette step into a second capillary to obtain a duplicate.
10. Centrifuging the capillary tubes
Once all of the capillary tubes for the batch have been prepared load them into the mini-centrifuge fitted with capillary adapters.
Centrifuge at the lowest setting by holding the pulse button down for 1 s. This transfers liquid to the bottom in preparation for testing.
11. Operating the RAPID
Create a New file. Label positive control, negative control, and samples (by their ID number).
- Program 1: RNA Sample Preparation Hold
- Cycles = 1
- Analysis Mode = None
- Target Temperature = 40
- Incubation Time = 30 min
- Temperature Transition Rate = 20°C/s (default)
- Secondary Temperature Target = 0 (default)
- Step Size = 0 (default)
- Step Delay = 0 (default)
- Acquisition Mode = None (default)
- Program 2: RNA Denaturation
- Cycles = 1
- Analysis Mode = None
- Target Temperature = 94
- Incubation Time = 120s
- Temperature Transition Rate = 20°C/s (default)
- Secondary Temperature Target = 0 (default)
- Step Size = 0 (default)
- Step Delay = 0 (default)
- Acquisition Mode = None (default)
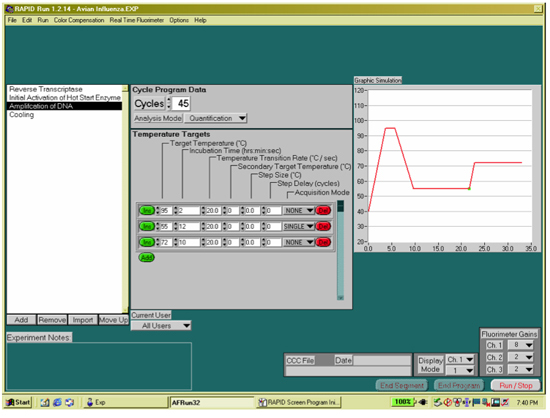
- Program 3: RNA Amplification
- Cycles = 45
- Analysis Mode = Auto Analysis
- Target Temperature, Segment 1 = 94; Segment 2 = 60
- Incubation Time, Segment 1 = 0 s, Segment 2 = 20 s
- Temperature Transition Rate, Seg 1 & 2 = 20°C/s (default)
- Secondary Temperature Target, Seg 1 & 2 = 0 (default)
- Step Size, Seg 1 & 2 = 0 (default)
- Step Delay, Seg 1 & 2 = 0 (default)
- Acquisition Mode, Segment 1 = None; Segment 2 = single
- Fluorescence Parameters
- Display Mode: fluorescence channel 2 (Ch2/1) Gains:
- Ch 1 (F1) = 1
- Ch 2 (F2) = 8
- Ch 3 (F3) = 1
- To display the real-time fluorescence data for each sample, select the sample of interest and click the 'Show Graph' button at the bottom of the screen
- For each capillary, the results include the following:
- # -- identifies the carousel position of the carousel
- Sample name - provides the name of the sample
- Control - indentifies the sample type for each sample
- Score - calculated using the relationship between the sample's fluorescence and the level of background fluorescence in the sample
- Result - displays the overall result for the sample
12. Representative results:
Possible results include the following: Present: A red 'present' call for a test/unknown sample indicates that the target was identified in that sample and the controls were successful. Not detected: A green 'not detected' call for a test/unknown sample indicates that the target was not identified in that sample and the test controls were successful. Please repeat: A 'please repeat' indicates that the positive or negative control failed.
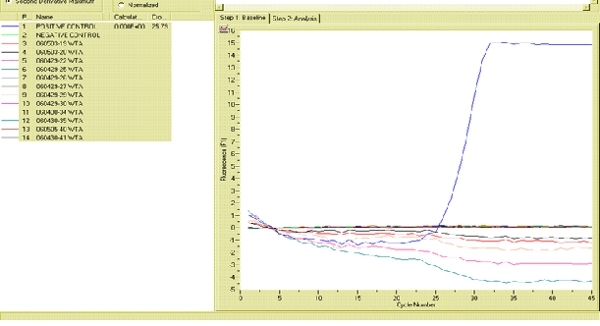
An example of a successful analysis by the RAPID 7200 is shown in Figure 4. The positive control is amplified and generates detectable fluorescence (y-axis) at approximately 25 cycles (x-axis). A cycle threshold (CT) > 35 is the agreed cut-off for most AIV reference laboratories. Therefore, the positive controls for this method produced a fluorescent signal within the accepted number of cycles (0-35) for AIV detection. In contrast, the negative control does not generate a fluorescent signal even after 45 cycles. Similarly, the twelve samples collected from western sandpipers did not generate a fluorescent signal indicating that the birds were negative for AIV. Follow-up testing of all positive samples in a traditional laboratory is encouraged to ensure that no false positives are erroneously produced.
 Figure 1. Shorebird capture using mist nets.
 Figure 2. Collection of cloacal and oropharyngeal samples from least sandpipers.
 Figure 3. Programming the RAPID 7200 for RNA amplification.
 Figure 4. Fluorogram generated by the RAPID 7200 portable rRT-PCR showing how positive and negative controls should appear in a successful assay. Click here to view the full sized image
Discussion
The method of rapid diagnosis presented here facilitates time-efficient and accurate testing of wild bird samples for surveillance of AIV. The much less stringent specimen storage requirements of portable rRT-PCR are suitable for remote situations where maintenance of a cold chain may be impractical if liquid nitrogen shippers or dry ice is not available. In addition, we found that sample analysis with freeze-dried reagents was straightforward enough to be performed by field biologists with minimal knowledge of laboratory-based molecular analysis. The technique was time-efficient and also cost-effective. With one operator, it was feasible to run three batches, resulting in 42 screenings for AIV each day in a field setting. We assessed that all materials needed to run this system could be brought to any location and the methodology could be taught to an operator over the course of a day. The limiting factor in remote field situations is the power supply required to run the portable rRT-PCR unit and attached computer; however, this may be mitigated through the use of a voltage-regulated portable electrical power generator. In addition, sequencing of the extracted RNA or the original sample is only feasible in cases where cold chain can be temporarily maintained until delivery to a laboratory.
Our previous analysis indicated that the portable rRT-PCR unit had identical specificity (100%) and comparable sensitivity (98%) to virus isolation performed in a laboratory setting2. Previous validation studies have demonstrated that false negatives are the most common error with rRT-PCR because of the large potential for improper sample preparation, presence of PCR inhibitors in fecal material or degradation of the lyophilized reagent bead 1,3-4. Another shortcoming of the technique is the sensitivity of lyophilized reagents in view of newly emerging strains of AIV. The virus is in a constant state of genomic reshuffling wherever hosts overlap, a hypothesis supported by numerous phylogenetic studies5-8. Hence primers and probes issued for use with portable rRT-PCR require constant re-validation. For example, reagents specific for American and Eurasian lineages of the H5 and H7 subtypes are now recommended due to the divergence of the virus according to biogeographic region9. As with all other field testing, suspected HPAIV positives should be transported to an approved facility for final confirmation testing with VI for highest specificity and sensitivity10.
In conclusion, this study demonstrated that portable rRT-PCR is suitable for the purpose of screening cloacal samples from wild birds for AIV in non-laboratory settings. The primary advantage of this technique is to expedite diagnosis of wild birds, increasing the chances of containing an outbreak in a remote location with a faster response time. Portable rRT-PCR also represents a breakthrough for researchers that seek to unravel the role of wild birds in the spread of AIV. The ability to diagnose host status at the time of sampling makes it possible to collect biological information to address key questions about immunological and physiological responses11 to infection, or genetic characteristics associated with natural resistance in wild birds12. Moreover, deploying costly satellite transmitters on confirmed hosts to track their movements would be invaluable for identifying which species act as long-distance carriers of AIV as well as assessing their migratory performance, habitat preferences and levels of interaction with poultry. Future operational testing in areas of international concern for HPAIV, such as Central and South Asia13, would conclusively determine how rapid rRT-PCR units perform under outbreak scenarios when diagnosis of a large number of positive samples is time-critical.
Disclosures
No conflicts of interest declared.
Acknowledgments
We wish to thank M. Scullion and R. Crisp of Idaho Technologies for technical support and the USGS Western Ecological Research Center for funding (S. Schwarzbach) and assistance (K. Spragens, T. Graham). This research was performed under the auspices of the Center for Innovative Technology - Institute for Defense and Homeland Security (www.idhs.org), in support of the Department of Defense and Air Force Research Laboratory. Animal handling followed protocols approved by the Animal Care and Use Committee of the U.S. Geological Survey Western Ecological Research Center and permits of the U.S. Geological Survey Bird Banding Laboratory. Any use of trade, product, or firm names in this publication is for descriptive purposes only and does not imply endorsement by the U. S. government.
References
- Spackman E. Development of a real-time reverse transcriptase PCR assay for type A influenza virus and the avian H5 and H7 hemagglutinin subtypes. J Clin Microbiol. 2002;40:3256–3260. doi: 10.1128/JCM.40.9.3256-3260.2002. [DOI] [PMC free article] [PubMed] [Google Scholar]
- Takekawa JY. Field detection of avian influenza virus in wild birds: evaluation of a portable rRT-PCR system and freeze-dried reagents. J Virol Methods. 2010;166:92–97. doi: 10.1016/j.jviromet.2010.02.029. [DOI] [PubMed] [Google Scholar]
- Das A, Spackman E, Senne D, Pedersen J, Suarez DL. Development of an internal positive control for rapid diagnosis of avian influenza virus infections by real-time reverse transcription-PCR with lyophilized reagents. J Clin Microbiol. 2006;44:3065–3073. doi: 10.1128/JCM.00639-06. [DOI] [PMC free article] [PubMed] [Google Scholar]
- Spackman E, Suarez DL. Avian influenza virus RNA extraction from tissue and swab material. Methods Mol Biol. 2008;436:13–18. doi: 10.1007/978-1-59745-279-3_3. [DOI] [PubMed] [Google Scholar]
- Chen R, Holmes EC. Frequent inter-species transmission and geographic subdivision in avian influenza viruses from wild birds. Virology. 2009:383–3156. doi: 10.1016/j.virol.2008.10.015. [DOI] [PMC free article] [PubMed] [Google Scholar]
- Macken CA, Webby RJ, Bruno WJ. Genotype turnover by reassortment of replication complex genes from avian influenza A virus. J Gen Virol. 2006;87:2803–2815. doi: 10.1099/vir.0.81454-0. [DOI] [PubMed] [Google Scholar]
- Dugan VG. The evolutionary genetics and emergence of avian influenza viruses in wild birds. PLoS Pathog. 2008;4:e1000076–e1000076. doi: 10.1371/journal.ppat.1000076. [DOI] [PMC free article] [PubMed] [Google Scholar]
- Spackman E. Phylogenetic analyses of type A influenza genes in natural reservoir species in North America reveals genetic variation. Virus Res. 2005;114:89–100. doi: 10.1016/j.virusres.2005.05.013. [DOI] [PubMed] [Google Scholar]
- Pasick J. Advances in the molecular based techniques for the diagnosis and characterization of avian influenza virus infections. Transbound Emerg Dis. 2008;55:329–338. doi: 10.1111/j.1865-1682.2008.01047.x. [DOI] [PubMed] [Google Scholar]
- OIE Manual of diagnostics tests and vaccines for terrestrial animals (mammals, birds and bees) 2004;1:258–269. [PubMed] [Google Scholar]
- Weber TP, Stilianakis NI. Ecologic immunology of avian influenza (H5N1) in migratory birds. Emerg. Infect. Dis. 2007;13:1139–1143. doi: 10.3201/eid1308.070319. [DOI] [PMC free article] [PubMed] [Google Scholar]
- Kim J-K, Negovetich NJ, Forrest HL, Webster RG. Ducks: the "Trojan Horses" of H5N1 influenza. Influenza and Other Respiratory Viruses. 2009:121–128. doi: 10.1111/j.1750-2659.2009.00084.x. [DOI] [PMC free article] [PubMed] [Google Scholar]
- Gilbert M. Flying over an infected landscape: distribution of highly pathogenic avian influenza H5N1 risk in South Asia and satellite tracking of wild waterfowl. Ecohealth. 2010 doi: 10.1007/s10393-010-0672-8. [DOI] [PMC free article] [PubMed] [Google Scholar]


