Abstract
Fluorescent proteins and dyes are essential tools for the study of protein trafficking, localization and function in cells. While fluorescent proteins such as green fluorescence protein (GFP) have been extensively used as fusion partners to proteins to track the properties of a protein of interest1, recent developments with smaller tags enable new functionalities of proteins to be examined in cells such as conformational change and protein-association 2, 3. One small tag system involves a tetracysteine motif (CCXXCC) genetically inserted into a target protein, which binds to biarsenical dyes, ReAsH (red fluorescent) and FlAsH (green fluorescent), with high specificity even in live cells 2. The TC/biarsenical dye system offers far less steric constraints to the host protein than fluorescent proteins which has enabled several new approaches to measure conformational change and protein-protein interactions 4-7. We recently developed a novel application of TC tags as sensors of oligomerization in cells expressing mutant huntingtin, which when mutated aggregates in neurons in Huntington disease 7. Huntingtin was tagged with two fluorescent dyes, one a fluorescent protein to track protein location, and the second a TC tag which only binds biarsenical dyes in monomers. Hence, changes in colocalization between protein and biarsenical dye reactivity enabled submicroscopic oligomer content to be spatially mapped within cells. Here, we describe how to label TC-tagged proteins fused to a fluorescent protein (Cherry, GFP or CFP) with FlAsH or ReAsH in live mammalian cells and how to quantify the two color fluorescence (Cherry/FlAsH, CFP/FlAsH or GFP/ReAsH combinations).
Protocol
1. Preparation of cells for labeling with ReAsH/FlAsH
Using standard cell culture methods for your cell line of interest, prepare a culture of adherent cells directly in a live cell imaging slide ready for transfection.
Transfect your plasmid containing TC-tagged gene of interest according to your transfection method of choice.
Note it is important to use positive and negative controls to assess the extent of specific binding to the TC tags and to assess for bleedthrough of fluorescence between the channels when collecting confocal micrographs. Hence, for two colors (eg FlAsH/Cherry or ReAsH/CFP or ReAsH/GFP combinations), ensure samples are prepared for single colors (eg Fluorescent protein alone or if possible a TC-tagged protein bound to FlAsH/ReAsH but with no fluorescent protein)
One to two days after transfection, gently rinse the cells with 300 μL pre-warmed (at 37 °C) HBSS.
Gently immerse the cells with 1 μM FlAsH (or ReAsH) in 300 μL of prewarmed HBSS and 10 μM 1,2-ethanedithiol (EDT).
It is important to add EDT first before adding FlAsH/ReAsH and make the buffer just prior to adding it to the cells. Incubate for exactly 30 min at 37 °C in tissue culture incubator. In our experience longer incubation times significantly increases the background fluorescence. New constructs should also be optimized for labeling time and FlAsH/ReAsH concentration (0.5-2 μM).
Gently aspirate labeling solution from cells and then replace with 300 μL prewarmed HBSS + 250 μM 2,3-dimercaptopropanol (BAL) for 15 min at 37 °C.
Remove wash solution by gentle aspiration and replace with 300 μL prewarmed HBSS.
After this wash, the cells may be fixed with paraformaldehyde (15 min with 3.2% solution), although we have found that this increases non-specific biarsenical dye fluorescence. Hence we usually image the cells live at room temperature. (Note that fixation of cells before labeling prevents biarsenical dye binding.)
2. Imaging the cells on a confocal microscope
On the confocal microscope, set up parameters for imaging the individual fluorophores (see Table 1) and ensure that there is negligible bleedthrough between the channels. This can be achieved by checking individual fluorophores (in control samples) against each different fluorescent acquisition setting for fluorescence. Adjusting the emission wavelength range can help to minimize bleedthrough (although this can also reduce the signal/noise).
Also adjust the photomultiplier settings so that the maximum fluorescence in the sample does not saturate the detector. (This can be detected using the Q-LUT setting on the SP2 Leica confocal). Once the best imaging settings are determined, do not change any of them between samples.
Other settings we typically use (although these can be optimized) are a scan rate of 200 Hz and collect 4 line averages and a pinhole diameter of 1 Airy unit. The pinhole diameter can be expanded if signal/noise is an issue, however, this may result in some loss of imaging.
Collect the confocal images in 12-bit (or higher) format if possible. 12-bit format captures a greater dynamic range of values (0-4095) for each pixel intensity than 8-bit (0-255). This is important for ensuring the richest data set is recorded, which maximizes quality of quantitative data analysis.
Collect images for the fluorescent protein channel (Cherry, GFP or CFP) and also for the biarsenical dye channel (FlAsH or ReAsH) for all samples.
3. Analysis of the data
Install the software ImageJ on your computer8. http://rsbweb.nih.gov/ij/
- Make sure that your version of ImageJ has the following plugins:
Open ImageJ, and if using a version older than v1.32c, click on the following options to enable multiple images to be opened at one time (which can be done by holding down the control button while you click on different files):
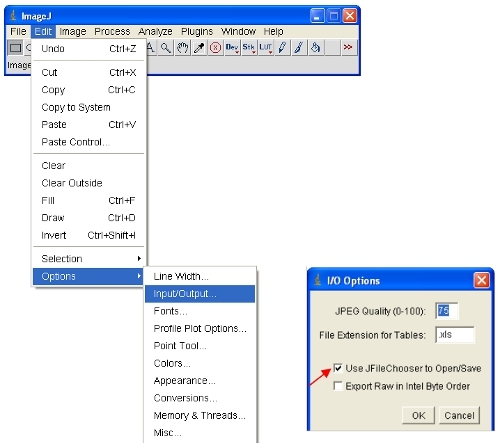
Open the images of interest in ImageJ. ImageJ will automatically define the maximum and minimum pixel intensities that are displayed on the screen for each image separately. Given that different images will have different pixel intensities, this means the displayed images ARE NOT comparable as viewed.
To ensure the opened images are all on the same scale, you can physically define the upper and lower pixel intensities to be viewed (this will not change the actual data content of the images as would be the case in some other software). These values can be set under the following menu:
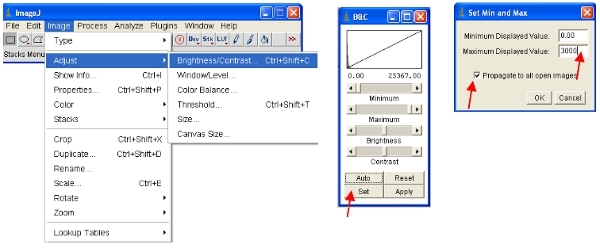
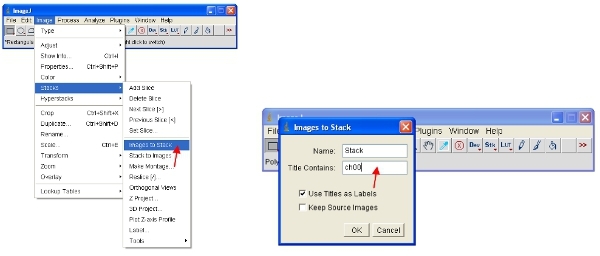
An alternative approach is to work with stacks, which puts all images together into one file and will automatically scale (for viewing) all the images in the stack to the same scale. The easiest way to work with the data is to convert each channel to a stack. Thus, for the fluorescent protein channel convert all to stack as shown. You can easily select one channel by stacking all images containing a common name (eg "ch00") in the title.
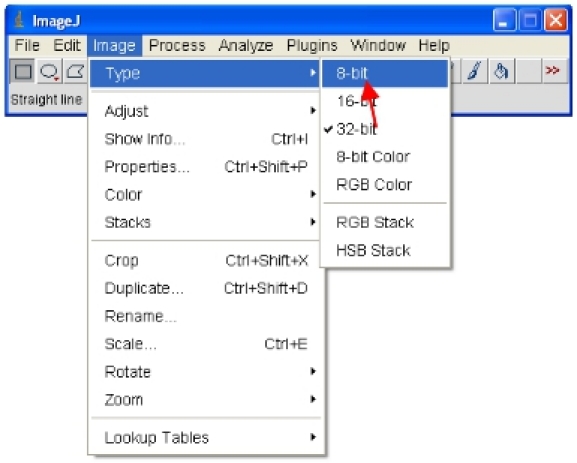
Now convert all the open images to 8-bit for analysis. This will actually rescale the viewed range into a 0-255 range (which defines 8-bit). IMPORTANT: Do not save over the original 12-bit (or higher) format or you will lose information content. Note that some software packages can only display 8-bit images so this format is useful for making figures etc.
Save a copy in a new folder called "8-bit converted" using the "Save as…" option.
One method to examine the extent of biarsenical dye binding in a whole image is to perform a pixel intensity correlation plot. This plots every pixel value in one channel relative to the corresponding pixel value in a second channel. Hence a pixel position high in CFP fluorescence will also be high in ReAsH fluorescence if there is high binding.
To analyze the pixel co-correlation, make sure the 8-bit ReAsH and Cerulean/GFP images are open in ImageJ.
Open the "Image Correlator" plugin as indicated below. Select "Image1" as the ReAsH or FlAsH stack and "Image2" as the fluorescent protein stack.
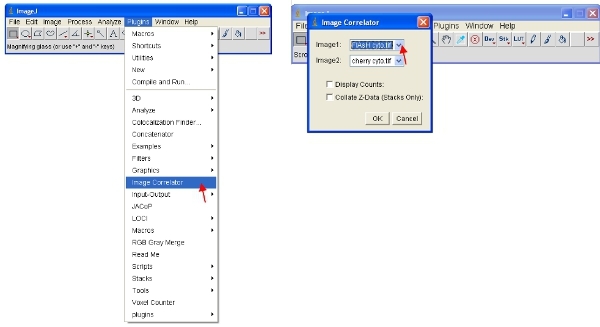
The resulting stack may not display any detailed information - this is normal. Save the stack in a new folder called "Scatterplots" and give it the same file name as the sample it refers to (eg "FlAsH-cherry correlation plot")
To view the data meaningfully you can do one of two options. First transform the data so that it is in log format. Then visually rescale the data as follows:
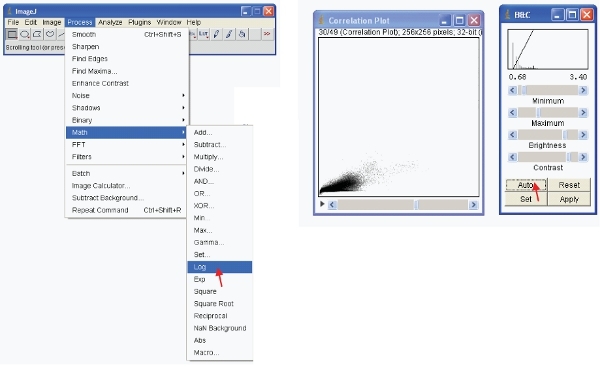
Alternatively, you can rescale the data visually to only show low values (eg 1-255) and display the data using a special LUT. An LUT (Look Up Table) represents a table of colors that are assigned to each pixel value in an image. This can be used to define a pseudocolor scheme for an image and is useful for defining certain features in an image. To create a custom LUT click on "LUT editor" and make a new one such as the one shown (this can be saved and used later on).
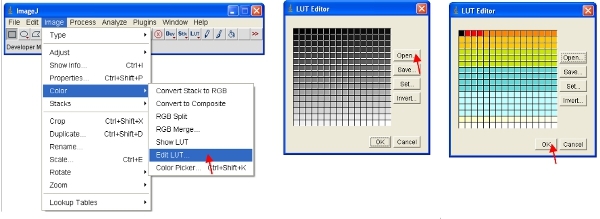
Set the brightness/contrast range from 0-255 (as described in step 13 above). To "lock in" the image as to that shown on the screen, the image can be converted to RGB format which saves an 8-bit value for each of the red, green and blue color of each pixel.
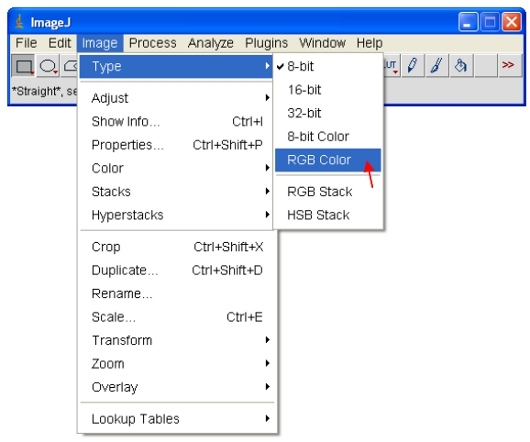 To copy and paste images to other programs first open the 8-bit or 16-bit images. As described in step 14 above, assign an LUT color scheme to the image. For CFP, assign the "Cyan" LUT as described below…
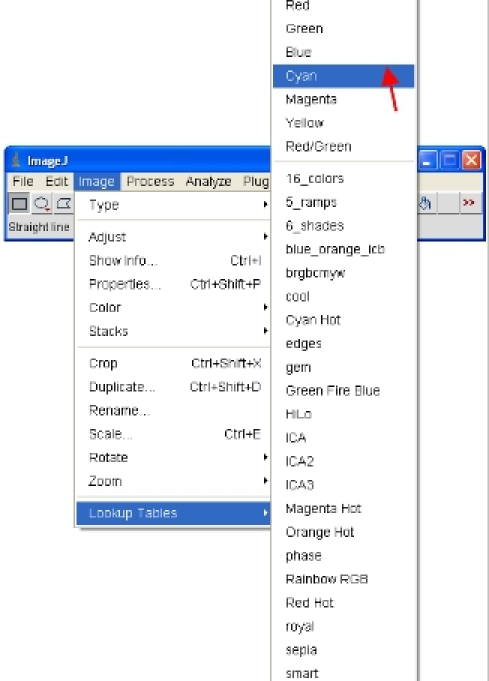
Select the image and to copy it to the clipboard, select…
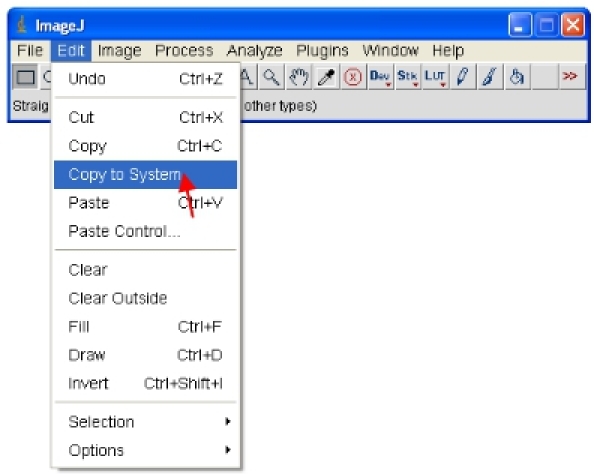
4. Representative results:
The success of labeling cells with biarsenical dyes is dependent on a few key parameters. First, the timing of the labeling with dyes is crucial. We have found that extended periods of labeling (more than 30 min) results in a high level of non-specific background staining. Fig 1 shows a typical result for a wild-type form of huntingtin fragment (25Q) fused to the CFP derivative Cerulean containing a TC tag as described previously 7. This sample was stained for 30 min with ReAsH and there is minimal background in the sample lacking the TC tag. We have found that fixing cells with paraformaldehyde increases background while fixing with methanol abrogates the fluorescence of the fluorescent protein tag. Hence where possible we image the cells live. It is important to also note that fixation prior to labeling with biarsenical dyes prevents their binding, presumably due to modifications of the TC motif.
Another critical factor for consistent results is the density of cells. We have found it critical to image cells that are loosely distributed and also that extensive clumping can lead to uneven staining of the biarsenical dyes in different cells.
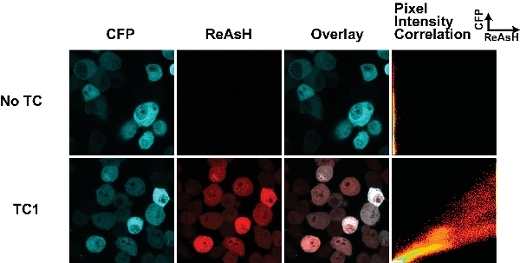 Figure 1. Tetracysteine tags and ReAsH staining in live cells transfected with huntingtin(exon1-25Q)-Cerulean fusions. The TC tag is located at the junction of the huntingtin-Cerulean fusion (as described in 7). The pixel intensity correlation plot enables an assessment to differences in ReAsH binding throughout the cell and can be used to map changes in ReAsH binding due to conformational change or ligand interactions.
Discussion
The approach to label protein localization with a fluorescent protein and conformational properties with a second dye offers much potential for mapping where different conformations of proteins accrue in cells and events that change the dynamics of protein conformation. ReAsH/FlAsH was first used as an in-cell sensor for protein folding of the mammalian cellular retinoic acid-binding protein I 4. In this example, the FlAsH bound to a TC tag engineered into cellular retinoic acid-binding protein I had reduced fluorescence yield in the folded form relative to the unfolded form, and the folding could be tracked in E. coli cells. More recently protein folding and self-association was demonstrated in model proteins by bipartite tetracysteine display 6. In this example, distal dicysteine pairs on model peptides were brought into close proximity upon binding of two peptides containing dicysteine pairs, or by the folding of a peptide that reconstitutes a functional tetracysteine motif for binding biarsenical dyes. We took this approach one step further by developing sensors that distinguish monomers from oligomers due to the TC tag becoming occluded from biarsenical dye binding in all oligomeric forms 7.
Despite the potential of TC tags and biarsenical dyes as reporters for conformational changes and association, the methodology suffers from having a comparatively low signal/noise signal compared to fluorescent proteins as a result of baseline background fluorescence 9. Hence in efforts to develop conformation sensors it would be worthwhile to test some of the other newer labeling approaches being developed, such as an engineered fluorophore ligase system that conjugates coumarin derivates to a 13 amino-acid peptide sequence 3.
The analysis presented here can be extended further to examine where within cells differences occur in the binding of ReAsH/FlAsH to the protein of interest. To do this, the images can be divided into subregions by creating regions of interest (ROI) and converting them to masks to filter the different parts of image (this can all be done in ImageJ). Hence, by comparison of the pixel intensity plots it should be possible to statistically evaluate differences between intracellular subregions using the sensors.
Disclosures
No conflicts of interest declared.
Acknowledgments
This work was funded by grants to DMH and TDM (NHMRC project grants). DMH is a Grimwade Fellow, funded by the Miegunyah Trust.
References
- Tsien RY. The green fluorescent protein. Ann. Rev. Biochem. 1998;67:509–544. doi: 10.1146/annurev.biochem.67.1.509. [DOI] [PubMed] [Google Scholar]
- Griffin BA, Adams SR, Tsien RY. Specific covalent labeling of recombinant protein molecules inside live cells. Science. 1998;281:269–2672. doi: 10.1126/science.281.5374.269. [DOI] [PubMed] [Google Scholar]
- Uttamapinant C. A fluorophore ligase for site-specific protein labeling inside living cells. Proc. Natl. Acad. Sci. USA. 2010;107:10914–10919. doi: 10.1073/pnas.0914067107. [DOI] [PMC free article] [PubMed] [Google Scholar]
- Ignatova Z, Gierasch LM. Monitoring protein stability and aggregation in vivo by real-time fluorescent labeling. Proc. Natl. Acad. Sci. USA. 2004;101:523–528. doi: 10.1073/pnas.0304533101. [DOI] [PMC free article] [PubMed] [Google Scholar]
- Coleman BM. Conformational detection of prion protein with biarsenical labeling and FlAsH fluorescence. Biochem. Biophys. Res. Commun. 2009;380:564–568. doi: 10.1016/j.bbrc.2009.01.120. [DOI] [PubMed] [Google Scholar]
- Luedtke NW, Dexter RJ, Fried DB, Schepartz A. Surveying polypeptide and protein domain conformation and association with FlASH and ReAsH. Nat. Chem. Biol. 2007;3:779–784. doi: 10.1038/nchembio.2007.49. [DOI] [PMC free article] [PubMed] [Google Scholar]
- Ramdzan YM. Conformation sensors that distinguish monomeric proteins from oligomers in live cells. Chem. Biol. 2010;17:371–379. doi: 10.1016/j.chembiol.2010.03.011. [DOI] [PMC free article] [PubMed] [Google Scholar]
- Abramoff Magelhaes, PJ SJRam. Image processing with ImageJ. Biophotonics International. 2004;11:36–42. [Google Scholar]
- Hearps A. The biarsenical dye Lumio exhibits a reduced ability to specifically detect tetracysteine-containing proteins within live cells. J. Fluor. 2007;17:593–597. doi: 10.1007/s10895-007-0225-x. [DOI] [PubMed] [Google Scholar]
- Adams SR. New biarsenical ligands and tetracysteine motifs for protein labeling in vitro and in vivo: Synthesis and biological applications. J. Am. Chem. Soc. 2002;124:6063–6076. doi: 10.1021/ja017687n. [DOI] [PubMed] [Google Scholar]
- Shaner NC, Steinbach PA, Tsien RY. A guide to choosing fluorescent proteins. Nat. Meth. 2005;2:905–909. doi: 10.1038/nmeth819. [DOI] [PubMed] [Google Scholar]


