Abstract
The Molecular Devices' FlexStation 3 is a benchtop multi-mode microplate reader capable of automated fluorescence measurement in multi-well plates. It is ideal for medium- to high-throughput screens in academic settings. It has an integrated fluid transfer module equipped with a multi-channel pipetter and the machine reads one column at a time to monitor fluorescence changes of a variety of fluorescent reagents. For example, FlexStation 3 has been used to study the function of Ca2+-permeable ion channels and G-protein coupled receptors by measuring the changes of intracellular free Ca2+ levels. Transient receptor potential (TRP) channels are a large family of nonselective cation channels that play important roles in many physiological and pathophysiological functions. Most of the TRP channels are calcium permeable and induce calcium influx upon activation. In this video, we demonstrate the application of FlexStation 3 to study the pharmacological profile of the TRPA1 channel, a molecular sensor for numerous noxious stimuli. HEK293 cells transiently or stably expressing human TRPA1 channels, grown in 96-well plates, are loaded with a Ca2+-sensitive fluorescent dye, Fluo-4, and real-time fluorescence changes in these cells are measured before and during the application of a TRPA1 agonist using the FLEX mode of the FlexStation 3. The effect of a putative TRPA1 antagonist was also examined. Data are transferred from the SoftMax Pro software to construct concentration-response relationships of TRPA1 activators and inhibitors.
Protocol
1. Cell preparations in 96-well plates
For HEK293 cells transiently trasfected with human TRPA1 cDNA
HEK293 cells are grown for one to two days in Dulbecco's Minimal Essential Medium (DMEM) containing 4.5 mg/ml glucose (Thermo Scientific, SH3002201), supplemented with 10% heat-inactivated fetal bovine serum (Invitrogen, 16000-044), 50 units/ml penicillin and 50 μg/ml streptomycin (Invitrogen, 15140-163). On the day of the transfection, the cell density should reach 70-90%.
Coat 96-well plates by pipetting 50 μl poly-L-ornithine (Sigma P3655, 20 μg/ml in sterile distilled water) to each well and incubating at 37°C for at least 15 min. Rinse each well once with Dulbecco's Phosphate Buffered Saline (DPBS) without Mg2+ and Ca2+ (Thermo Scientific, SH3002803). The plate may be left in the cell culture hood for a few hours.
For every well of a 96-well plate, dilute in a 1.5-ml Eppendorf tube 0.2 μg cDNA in 25 μl OPTI-MEM (Invitrogen, 31985-070). Scale up proportionally according to the number of wells to be transfected by the same cDNA. Also dilute in a separate 1.5-ml Eppendorf tube 0.4 μl Lipofectamine 2000 (Invitrogen, 11668-019) in 25 μl OPTI-MEM for each well to be transfected. Scale this up according to the total number of wells to be transfected.
Briefly vortex the diluted cDNA and Lipofectamine 2000 and let them sit at the room temperature for about 5 min.
Transfer an equal volume of the diluted Lipofectamine 2000 to the tube that contains the diluted cDNA, vortex and let the mixture sit at room temperature for 15 min to 2 hrs. During this time, transfer the cDNA/Lipofectamine 2000 mixture at 49 μl/well to the poly-L-ornithine coated plate.
Trypsinize the HEK293 cells (Step 1.1), count cell density using a hemocytometer or Countess automated cell counter (Invitrogen, C10227), and transfer a desired amount of cells (generally about ~125,000-150,000 cells/well) to a 15-ml sterile conical-bottom centrifuge tube. Centrifuge at 1000 x RPM for 5 min. Resuspend cells at ~1,250,00-1,500,000 cells/ml in the DMEM culture medium, supplemented with 10% heat-inactivated fetal bovine serum, but without antibiotics.
Dispense 98 μl cell suspension to each well that contains the cDNA-Lipofectamine 2000 mixture using a multichannel pipetter or the MicroFill Microplate Dispenser (Bio-Tek). Let the plate sit in the hood for at least 30 min before placing it to the humidified cell culture incubator. Incubate at 37°C, 5% CO2 for 20-44 hrs.
For HEK293 cells stably expressing TRPA1
Follow Step 1.2 to coat 96-well plates.
The inducible HEK293-hTRPA1 cell line was generously provided by Dr. A. Patapoutian (The Scripps Research Institute) and maintained in the same medium as the wild-type HEK293 cells (Step 1.1) but supplemented with 5 μg/ml blasticidin (Invitrogen, A1113902) and 50 μg/ml hygromycin B (Invitrogen, 10687010). When cell density reaches about 90%, trypsinize cells, count cell density, and centrifuge the desired amount of cells at 1000 x RPM for 5 min. Resuspend cells at a density of ~1,000,000 cells/ml in the same culture medium supplemented with doxycycline (Fisher, BP26535, 0.25 μg/ml).
Dispense the cell suspension to poly-L-ornithine coated plates at 100 μl/well using a multichannel pipetter or the MicroFill (Bio-Tek). Let the plate sit in the hood for at least 30 min before placing it to the humidified cell culture incubator. Incubate at 37 °C, 5% CO2 for 16 - 24 hr.
2. Solutions
Hank's buffered salt solution (HBSS) is used as the extracellular solution. It contains (in mM): 137 NaCl, 5.4 KCl, 0.25 Na2HPO4, 0.44 KH2PO4, 1.3 CaCl2, 1.0 MgSO4, 1.0 MgCl2, 10 glucose, 10 HEPES, with pH adjusted to 7.4 using 1N NaOH).
Fluo-4 assay buffer contains 2 mM probenecid in HBSS. Make 250 mM stock probenecid (Sigma, P8761) in 0.5 N NaOH. Dilute to HBSS at a ratio of 1:125. Readjust pH to 7.4 using 1 N HCl.
3. Cell loading with Fluo-4 AM
Dissolve 1 mg Fluo-4 AM (Invitrogen, F14202) in 912 μl anhydrous DMSO to make a stock solution of 1 mM. The Fluo-4 AM stock solution can be stored at -20 °C for at least one month.
Mix 10 μl 1 mM Fluo-4 AM with 10 μl Pluronic F-127 (Invitrogen, P3000MP, 20% (w/v) solution in DMSO) and then transfer the entire content to 5 ml Fluo-4 assay buffer (Step 2.2) supplemented with 0.1% Bovine serum albumin (Sigma, A9418).
Wash cells grown in 96-well plates (Step 1.7 or 1.10) with HBSS at 80 μl/well 2 times using a microplate washer (such as ELx405TM from Bio-Tek).
Add the Fluo-4 AM loading solution (Step 3.2) at 50 μl/well using a multichannel pipetter or the MicroFill (Bio-Tek) and incubate the plate at 37 °C for 1 hr.
Wash cells 3 times with the Fluo-4 assay buffer (Step 2.2.) using the ELx405TM microplate washer. After the last wash, leave 80 μl of the Fluo-4 assay buffer in each well.
4. Preparation of compound plate
During the 1 hr cell loading period, prepare a series of 3x dilutions of agonists (or antagonists) of 3x of the desired final concentrations in the Fluo-4 assay buffer.
Pipette 250-300 μl of the diluted compound solutions to a 96-well compound plate. Arrange to have the serial dilutions of a compound and the corresponding positive and negative controls in the same column of the compound plate whenever it is possible because FlexStation 3 reads one single column at a time.
5. Plate reading in FlexStation 3
Turn on the system (FlexStation 3, computer, and the SoftMax Pro 5.2 software)
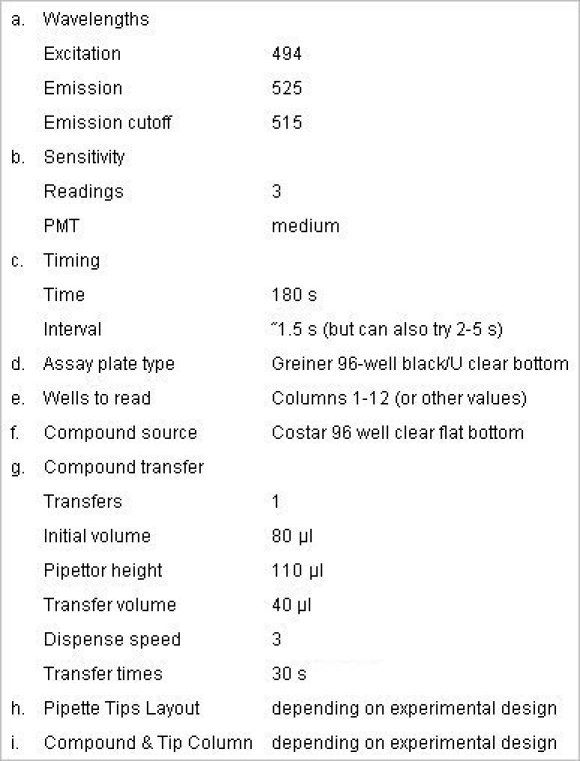
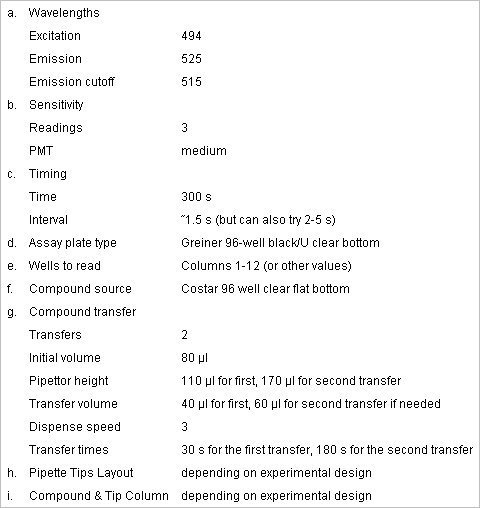
Save the experiment with a new file name. At the set-up, choose FLEX mode and enter the following values:
Protocol #1, agonist effect

Protocol #2, antagonist effect

Place a new tip box, compound plate and the reading plate to the appropriate trays in FlexStation 3 and click "read" button. The FlexStation 3 will read one column at a time and add compounds at the preprogrammed time points without interrupting the reading. It takes about 3 min (5 min for Protocol #2) to finish reading one column and the machine will continue to read the next column with compound additions performed as programmed by the user in step 5.2 until all columns are read.
6. Data analysis
Experimental data may be processed directly using the SoftMax Pro 5.2 software or copied and pasted into any spreadsheet program, such as Microsoft Excel. Concentration-response curve of a TRPA1 agonist flufenamic acid (FFA) is constructed using the following least-squares fitting routine.
 , where Y is the observed response, Ymax is the normalized maximal response, C is the corresponding drug concentration, EC50 is the concentration that evoked a half-maximal response, and nH is the apparent Hill coefficient. Concentration-inhibition curve for a putative TRPA1 antagonist compound A is obtained by using a fixed concentration of FFA (100 μM), and progressively increasing the concentration of compound A. IC50 value of compound A is calculated by least-squares fitting to the following equation.
  , where Y is the observed response and Ymax is normalized peak response, [Ant] is the corresponding compound A's concentration, IC50 is the antagonist concentration that produces half-maximal inhibition of FFA-evoked response, and nH is the apparent Hill coefficient.
7. Representative Results:
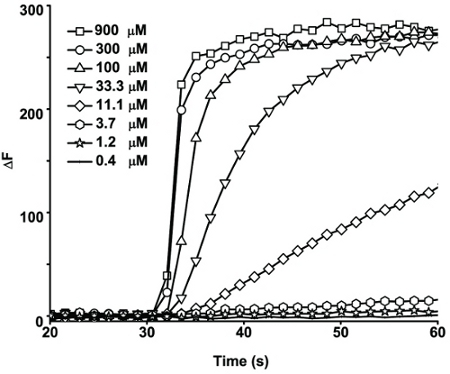
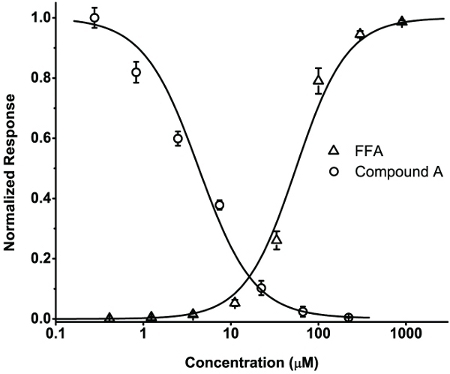
TRPA1 is a Ca2+-permeable cation channel, activation of which leads to calcium influx that can be detected by the Ca2+-sensitive dye, Fluo-4 (1-2). A HEK293-hTRPA1 stable cell line was used to study the concentration-response relationships of TRPA1 agonists and antagonists. Cells were loaded with Fluo-4 AM, placed in 80 μl of the assay buffer, and read using FlexStation 3. After recording the baseline fluorescence for 30 s, 40 μl of a serial dilution of the TRPA1 agonist, FFA, each at 3x of the desired final concentration, were added to the cells through a multi-channel pipetter included as a part of the fluidics module of FlexStation 3. The fluorescence changes were monitored for an additional 180 s. The relative Fluo-4 fluorescence changes for each well were expressed as ΔF= (F - F0), where F and F0 are fluorescence values at the time of interest and the beginning of the reading, respectively. Representative traces of the time courses to fluorescence changes in response to a series of FFA concentrations are shown in Fig. 1. Note for the last four FFA concentrations, although the maximal response levels are similar, the activation kinetics is clearly faster at the higher than at the lower FFA concentrations. Therefore, to distinguish these differences, the concentration - response relationship was constructed by measuring the initial rates (slope) of the fluorescence increase upon addition of varying concentrations of FFA (Fig. 2). The half maximal effective concentration (EC50) of FFA was determined to be 55.4 μM (n=3). To test the putative TRPA1 antagonist, compound A, we performed a similar experiment using protocol #2 (Step 2). In this case, a series of dilutions of the antagonist were added at 30 s (40 μl of 3x desired final concentrations) and the FFA was added 180 s later (60 μl at 300 μM for a final concentration of 100 μM). Compound A dose-dependently reduced the response of the TRPA1 cells to FFA with a half maximal inhibitory concentration (IC50) of 4.3 μM (n=3) (Fig. 2).
 Figure 1. Concentration-dependent activation of human TRPA1 by FFA. Traces are FFA-evoked increase of fluorescence over time (only responses in the first 60 s are shown to better illustrate the fast kinetics of the FFA-evoked responses). Please note that at higher concentrations FFA evoked fluorescence increase with a much faster kinetic than at lower concentrations, even though the peak fluorescence levels were similar.
 Figure 2. Concentration - response relationships for FFA-induced fluorescence change and compound A-induced inhibition of FFA response in human TRPA1 stably expressed in HEK293 cells. Δ,The concentration - response relationship of FFA was determined by measuring the initial rates (slope) of the normalized fluorescence increase upon addition of varying concentrations of FFA. O, Concentration-response relationship of inhibition of FFA-evoked calcium response by a putative TRPA1 antagonist, compound A.
Discussion
Intracellular Ca2+ plays important roles in many physiological and pathological conditions, such as neurotransmitter release (3), cardiac action potential (4), muscle cell contraction (5), cell signal transduction (6-7), and excitotoxic cell death (8). Measurement of intracellular Ca2+ levels helps to elucidate functional changes of Ca2+-permeable channels in the plasma membrane or intracellular organelles and the contribution of Ca2+ to the above processes (9-13). The assay can also be used to investigate the function of G-protein coupled receptors, many of which, upon activation, lead to increased intracellular free Ca2+ concentrations by releasing Ca2+ from intracellular Ca2+ stores or activating other Ca2+ permeable ion channels (14-16). FlexStation 3 makes use of Ca2+ sensitive dyes, which give rise to increased fluorescence intensity, or ratiometric changes, with the increase of intracellular Ca2+ concentration. This video article demonstrates the application of FlexStation 3 in the study of Ca2+-permeable TRPA1 channels heterologously expressed in HEK293 cells. Although we have only used 96-well plates for the demonstration, users can easily choose from 96- or 384-well plate format by switching the dispensing pipetters (8- or 16-channel). This assay provides a quick medium to high throughput screening capability of agonists and/or antagonists and is applicable to many other Ca2+-permeable ion channels. However, it should be noted that intracellular calcium assay is an indirect measurement of ion channel activities. Detailed follow-up studies using patch clamp recordings to directly measure ionic current flowing across cell membrane are still needed to draw appropriate conclusions.
To obtain reliable data quality, the following precautions should be taken:
For loosely adherent cells, such as HEK293 cells, coating the plates is essential. However, for strongly adherent cells, such as Chinese Hamster Ovary (CHO) cells or HELA cells, coating is not necessary.
It is important that equal amount of cells are seeded in each well of the multi-well plate and the cell density in each well should be between 90-100% confluency at the time of the assay.
Gently dispense liquid to the cells and avoid disturbing the cells when loading and washing cells.
Probenecid is added to prevent dye leakage. However, since probenecid also has effect on some ion channels, caution should be taken when interpreting data obtained from experiments that include probenecid in the assay buffer.
To determine the compound concentrations in the compound plate, consider the dilution factor for each well according to the buffer volume in the corresponding well of the sample plate before and after the compound addition.
Disclosures
No conflicts of interest declared.
Acknowledgments
We thank Drs. John Hancock, Ray Grill, Andrew Morris and Olga Chumakova for their support. The FlexStation 3 system is part of the UTHSC Cytodynamic Imaging Facility. We also thank Drs. Ardem Patapoutian and Michael Bandell from the Scripps Research Institute and Genomics Institute of the Novartis Research Foundation (GNF) for providing the HEK293-hTRPA1 stable cell line. The research is supported in part by grants from NIH (GM081658 to MXZ) and Texas Medical Center Digestive Diseases Center (to HH) and Mission Connect/TIRR Foundation (to HH).
References
- Hu H. Activation of TRPA1 channels by fenamate nonsteroidal anti-inflammatory drugs. Pflugers Arch. 2010;459:579–592. doi: 10.1007/s00424-009-0749-9. [DOI] [PMC free article] [PubMed] [Google Scholar]
- Hu H, Bandell M, Petrus MJ, Zhu MX, Patapoutian A. Zinc activates damage-sensing TRPA1 ion channels. Nat Chem Biol. 2009;5:183–190. doi: 10.1038/nchembio.146. [DOI] [PMC free article] [PubMed] [Google Scholar]
- Perney TM, Hirning LD, Leeman SE, Miller RJ. Multiple calcium channels mediate neurotransmitter release from peripheral neurons. Proc Natl Acad Sci. 1986;83:6656–6659. doi: 10.1073/pnas.83.17.6656. [DOI] [PMC free article] [PubMed] [Google Scholar]
- Mason SA, MacLeod KT. Cardiac action potential duration and calcium regulation in males and females. Biochem Biophys Res Commun. 2009;388:565–570. doi: 10.1016/j.bbrc.2009.08.050. [DOI] [PubMed] [Google Scholar]
- Raat NJ, Wetzels GE, DeMey JG. Calcium-contraction relationship in rat mesenteric arterial smooth muscle. Effects of exogenous and neurogenic noradrenaline. Pflugers Arch. 1998;436:262–269. doi: 10.1007/s004240050631. [DOI] [PubMed] [Google Scholar]
- Alagarsamy S, Johnson KM. Voltage-dependent calcium channel involvement in NMDA-induced activation of NOS. Neuroreport. 1995;6:2250–2254. doi: 10.1097/00001756-199511000-00035. [DOI] [PubMed] [Google Scholar]
- Su LT. TRPM7 regulates cell adhesion by controlling the calcium-dependent protease calpain. J Biol Chem. 2006;281:11260–11270. doi: 10.1074/jbc.M512885200. [DOI] [PMC free article] [PubMed] [Google Scholar]
- Dubinsky JM, Rothman SM. Intracellular calcium concentrations during "chemical hypoxia" and excitotoxic neuronal injury. J Neurosci. 1991;11:2545–2551. doi: 10.1523/JNEUROSCI.11-08-02545.1991. [DOI] [PMC free article] [PubMed] [Google Scholar]
- George J. Sodium channel activation augments NMDA receptor function and promotes neurite outgrowth in immature cerebrocortical neurons. J Neurosci. 2009;29:3288–3301. doi: 10.1523/JNEUROSCI.6104-08.2009. [DOI] [PMC free article] [PubMed] [Google Scholar]
- Price KL, Lummis SC. FlexStation examination of 5-HT3 receptor function using Ca2+ - and membrane potential-sensitive dyes: advantages and potential problems. J Neurosci Methods. 2005;149:172–177. doi: 10.1016/j.jneumeth.2005.05.014. [DOI] [PubMed] [Google Scholar]
- Laude AJ. Rapid functional assays of recombinant IP3 receptors. Cell Calcium. 2005;38:45–51. doi: 10.1016/j.ceca.2005.04.001. [DOI] [PubMed] [Google Scholar]
- Marincsak R. The analgesic drug, tramadol, acts as an agonist of the transient receptor potential vanilloid-1. Anesth Analg. 2008;106:1890–1896. doi: 10.1213/ane.0b013e318172fefc. [DOI] [PubMed] [Google Scholar]
- Xie X. Validation of high throughput screening assays against three subtypes of Ca(v)3 T-type channels using molecular and pharmacologic approaches. Assay Drug Dev Technol. 2007;5:191–203. doi: 10.1089/adt.2006.054. [DOI] [PubMed] [Google Scholar]
- Christensen BN, Kochukov M, McNearney TA, Taglialatela G, Westlund KN. Proton-sensing G protein-coupled receptor mobilizes calcium in human synovial cells. Am J Physiol Cell Physiol. 2005;289:C601–C608. doi: 10.1152/ajpcell.00039.2005. [DOI] [PubMed] [Google Scholar]
- Boulay G. Cloning and expression of a novel mammalian homolog of Drosophila transient receptor potential (Trp) involved in calcium entry secondary to activation of receptors coupled by the Gq class of G protein. J Biol Chem. 1997;272:29672–29680. doi: 10.1074/jbc.272.47.29672. [DOI] [PubMed] [Google Scholar]
- Nanda K. Functional screening of adrenergic receptors by measuring intracellular calcium using the FlexStation scanning fluorimeter. Biotechnol J. 2009;4:417–422. doi: 10.1002/biot.200800205. [DOI] [PubMed] [Google Scholar]


