

Abstract
A simple, rapid, sensitive, and specific high-performance liquid chromatography (HPLC) assay for flurbiprofen has been developed and validated practically. The chromatography was conducted using Gemini C18 column (5 μm; 4.6 mm × 250 mm, Phenomenex, California, USA). The mobile phase containing disodium hydrogen phosphate solution (30 mM) pH 7.0 and acetonitrile (50:50); and the isocratic flow rate of 1.0 ml/min were used in the current study. Detection was made at 247 nm. The calibration curve was linear (r ≥ 0.9996) over the concentration range of 5-50 μm/ml. Mean percentage (%) recovery ± % relative standard deviation (RSD) ranged from 97.07 ± 0.008 to 103.66 ± 0.013. Within-day and between-day precision were also in acceptable range of 98.83 ± 0.004 to 104.56 ± 0.009. In order to confirm the practical applicability of the method developed, flurbiprofen controlled release matrix tablets were subjected to the dissolution studies and the release rate was analyzed. The reported HPLC for flurbiprofen provides several advantages of simplicity, high specificity, accuracy, and very short run-cycle time. It is suggested that the method should be used for the routine quality control analysis of flurbiprofen pure drug and its dosage forms.
Keywords: Chromatography, flurbiprofen, isocratic, quality control, validation
INTRODUCTION
Flurbiprofen (FLB) (propionic acid derivative) is an important non steroidal anti-inflammatory analgesic drug and is usually recommended to the patients with rheumatoid arthritis, osteoarthritis, ankylosing spondilitis and gout.[1] It is also recommended for the treatment of vernal keratoconjuntivitis,[2] ocular gingivitis,[3] and postoperative ocular inflammation,[4] radio-protection, protection of post-irradiation myelo-supression, and inhibition of colon tumor.[5] It has been investigated that flurbiprofen had an excellent safety profile and showed dose-dependent central nervous system penetration when its safety, tolerability, and pharmacokinetics were studied in healthy elderly individuals.[6] With its ever increasing use in the clinical efficacy and pharmaceutical industry, there is a need to develop a sensitive, accurate, simple, rapid, reproducible, and more practically applicable analytical method for the determination of flurbiprofen. United States Pharmacopoeia[7] and British Pharmacopoeia[8] have recommended the methods for the analysis of flurbiprofen active drug and in tablet, using a stainless steel column (15 × 3.9 cm), with a mobile phase of water: acetonitrile: glacial acetic acid (60: 35: 05) at a flow rate of 1 ml/min. Literature showed only limited number of methods for the determination of pure flurbiprofen. Sajeev et al. reported a liquid chromatographic method for the determination of flurbiprofen in pure form and in formulations RP C18 column with mobile phase composition of methanol-acetonitrile-phosphate buffer (pH 5.6, 40:20:40). The retention time was found to be 4.3 min.[3] Foda et al. reported a method for the determination of flurbiprofen in pharmaceutical dosage forms. UV detector was used and the retention times were found to be 8.94 and 6.27 min both for flurbiprofen and internal standard.[9] Different high-performance liquid chromatography (HPLC) methods for the determination of flurbiprofen in various biological fluids were also found. Szpunar et al. investigated the pharmacokinetics of flurbiprofen in man regarding area/dose relationship using HPLC technique.[10] Geisslinger et al. reported an enantioselective HPLC assay for the quantitation of the enantiomers of flurbiprofen in human plasma. Acid glycoprotein (AGP) column (100 mm × 4.0 mm, I.D., 5 mm, Grom, Herrenberg, Germany.), the mobile phase 5% 2-propanol and 1 mM diethyloctaylamine in 20 mm phosphate buffer (pH 6.5) were used and the detection was made at 246 nm.[11] Hence, it could be concluded that no simple and rapid chromatographic methods have been published till date for the quantitation of DCL-Na except for various pharmacokinetic studies. The present study reports a simple, rapid, specific, precise, and validated HPLC method for the quantitative estimation of flurbiprofen.
MATERIALS AND METHODS
Materials
Disodium phosphate, acetonitrile and flurbiprofen were received from Sigma-Aldrich, New Zealand. Ethyl cellulose standard Premium and hydroxypropylmethylcellulose (Dow chemical co., Midland USA). All other chemicals used were of HPLC and analytical grades.
Methods
High-performance liquid chromatography method development
In brief, an HPLC system (Agilent 1200, Agilent Corporation, Germany) comprising a quaternary pump, an automatic sampler and a photodiode array (PDA) detector was used with data acquisition by ChemStation® software (Agilent Corporation, Germany). The chromatographic separation was achieved using a Gemini C18 column (5 μm; 4.6 mm × 250 mm, Phenomenex, California, USA) maintained at 25°C. The mobile phase was prepared and premixed containing fifty parts (by volume) of disodium hydrogen phosphate solution (30 mM) pH 7.0 fifty parts (by volume) of acetonitrile (50:50 v/v). The isocratic flow rate was 1.0 ml/min. An acetonitrile: water (50:50 v/v) mixture was used as a rinse solution for the injector, and the injection volume was fixed at 5 ml. Detection was carried out using a wavelength of 247 nm. The peak purity for FLB was also determined.
The developed method was validated according to International Conference on Harmonization (ICH) guidelines.[12]
FLB 10 mg pure drug was accurately weighed, transferred into a 10 ml volumetric flask and dissolved in triple-distilled water which was obtained in-house by reverse osmosis and commercially known as Milli-Q water (MilliQ, Millipore, USA) to yield a stock solution of 1 mg/ml. From the stock solution, a serial dilution was performed using the acetonitrile: water (50:50 v/v) mixture to yield a standard calibration curve with a concentration range from 5 to 50 μg/ml.
Linearity
The linearity of the calibration curve was checked over the range of 5-50 μg/ml.
Limit of detection and limit of quantitation
Limit of detection (LOD) is the lowest amount of analyte in a sample, which can be detected but not necessarily quantitated as an exact value, calculated using equation 1.
![]()
Where σ is standard deviation of the intercept and S is slope of the calibration curve.
Limit of quantitation (LOQ) is the lowest amount of analyte in a sample, which can be quantitatively determined in suitable precision and accuracy calculated using equation 2.
![]()
Precision and accuracy
Intra-day and inter-day variabilities were determined by repeated injections of quality control (QC) samples. The QC samples were prepared at 8, 25, and 45 μg/ml representing low, middle, and high controls, respectively. Accuracy was assessed by comparing the predicted concentrations of the QC samples with the nominal 8, 25, and 45 μg/ml concentrations.
The HPLC-PDA detector with the Agilent ChemStation software allowed on-line data acquisition of UV-spectra between 190 and 400 nm during peak elution. The PDA detector provides more information on sample composition than single-wavelength detection.[13,14] UV spectra were obtained at five different points across the FLB peak; two points before the peak apex (leading front), one point at the apex and two points after the apex (tailing front). The peak purity was assessed by examining the similarity of the UV spectra obtained at the five points. If an impurity or degradation product co-elutes with the FLB peak, the five UV spectra obtained across the peak are different. The peak purity analysis was carried out for all FLB samples throughout the study.
Practical Applicability
Two selected FLB controlled release matrix tablets were subjected to the release studies and different samples were obtained at predetermined time intervals of 0.5, 1, 1.5, 2, 3, 4, 5, 6, 8, 10, 12, 18, and 24 hrs. The samples were analyzed by HPLC to confirm the practical applicability of the method developed.
RESULTS AND DISCUSSION
High-performance Liquid Chromatography Method Development
The system suitability parameters were found to be within acceptable limits. An analytical run time of 15 min was optimized for each sample. The retention time of FLB under the experimental conditions was 3.2 min and well resolved from the formulation used [Figure 1]. The following validation parameters were estimated and evaluated according to the ICH guidelines:[12,15]
Figure 1.
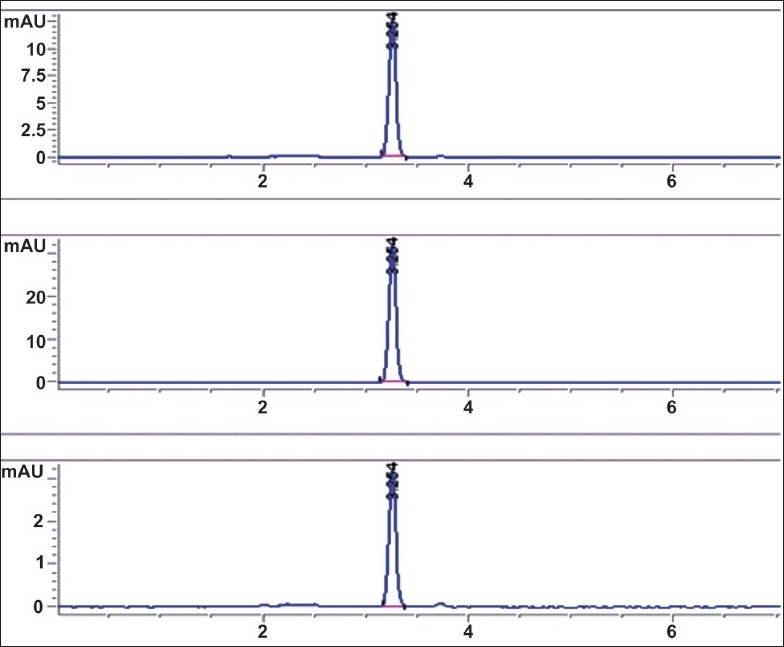
Representative HPLC chromatograms for FLB at three different concentrations in mobile phase
Linearity
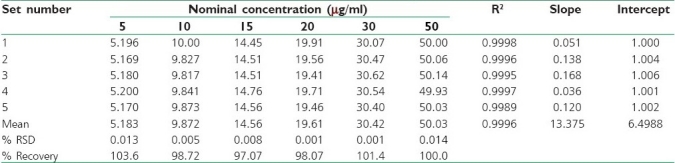
The calibration curves were linear in the range of 5-50 μg/ml (R2 > 0.9996). Percentage (%) recovery ± % RSD ranged from 97.07 ± 0.008 to 103.66 ± 0.013 [Table 1].
Table 1.
Reverse predicted concentrations, % recovery and regression coefficient (R2)
Limit of Detection and Limit of Quantitation
LOD and LOQ were estimated to be 0.173 μg/ml and 0.578 μg/ml, respectively.
Precision and accuracy
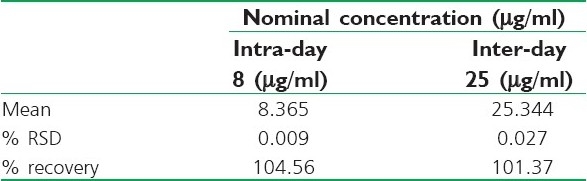
The precision and accuracy of the method were reported as the %RSD and % recovery of the QC samples [Table 2]. The inter-day and intra-day precision for the three samples was found to be between 0.001 to 0.027%, and 0.004 to 0.030%, respectively. These values comply with the acceptance criteria of the ICH guidelines.[12]
Table 2.
Precision and accuracy data of the QC samples (Results were expressed as mean values, n = 5)
The purity of FLB peaks was checked all over the study using a PDA detector and Agilent ChemStation software through examining the UV spectra at four predetermined points on the eluted drug peak from beginning to end.[13,16] Figure 2 is a representative example showing FLB spectra acquired during elution. The examined points were 2 upslope points, a base point and a down-slope point for purity determination, indicating a single component and a pure peak. The calibration curve [Figure 3] showed the best linearity of R2 = 0.9996.
Figure 2.
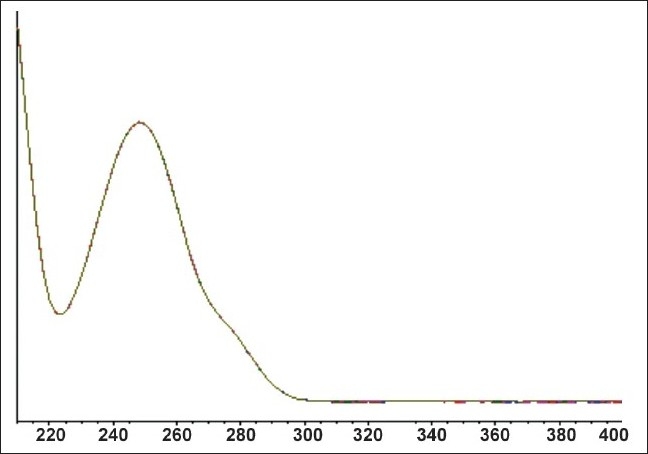
PDA-absorption spectra of the FLB peak from a standard solution
Figure 3.
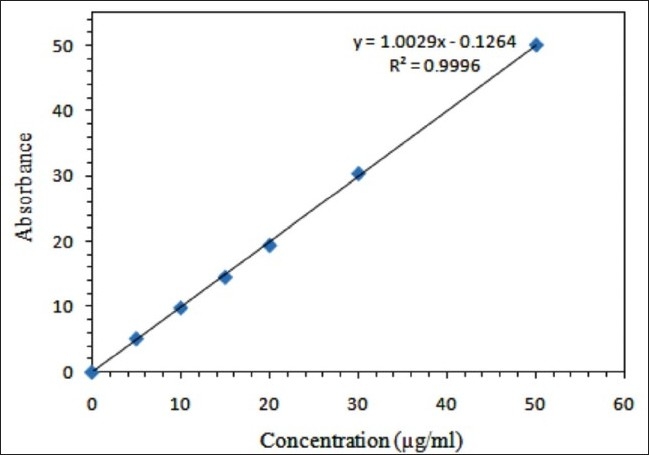
Mean standard HPLC calibration curve for FLB (n = 5)
Practical Applicability
The release data is shown in the Figure 4, indicating about 98% release of FLB from the matrix tablets formulated with ethylcellulose and ethylcellulose-hydroxypropymethylcellulose after 8:00 and 6:00 hrs, respectively. It could be observed that the release studies confirmed the applicability of the HPLC method developed for FLB pure drug and dosage form.
Figure 4.
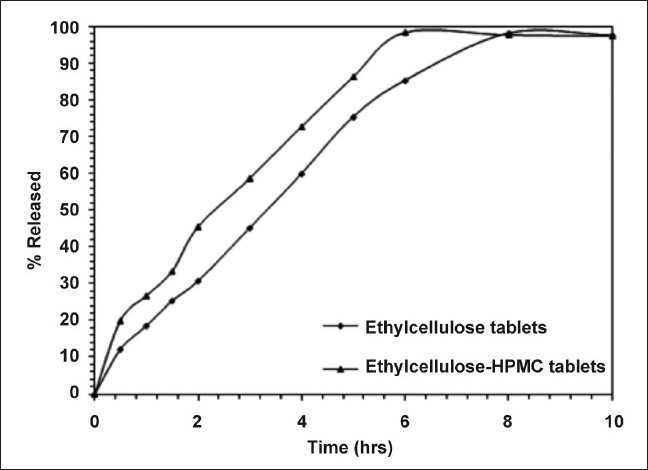
FLB release data from two selected controlled release matrix tablets
CONCLUSION
It could be concluded that a simple, rapid, and a specific high-performance liquid chromatographic assay for flurbiprofen has been developed and validated practically. The isocratic flow rate of 1 ml gave the retention time of FLB 3.2 min, which was well resolved from the formulation used under the experimental conditions to confirm its practical applicability.
Footnotes
Source of Support: Nil
Conflict of Interest: Nil.
REFERENCES
- 1.Brooks PM, Day RD. Nornal anti-inflammatory drugs: Differences and similarities. N Eng J Med. 1991;324:1716–25. doi: 10.1056/NEJM199106133242407. [DOI] [PubMed] [Google Scholar]
- 2.Sud RN, Greval RS, Bajwa RS. Topical flurbiprofen therapy in vernal keratoconjunctivitis. Indian J Med Sci. 1995;49:205–9. [PubMed] [Google Scholar]
- 3.Sajeev C, Ranendra NS. Simple rapid validated RP-LC method for the estimation of flurbiprofen in rabbit serum and Aqueous Humor. Analyt Lett. 2008;41:1318–34. [Google Scholar]
- 4.Josheph C. The role of NSAIDs in the management of postoperative ophthalmic inflammation. Drugs. 2007;67:1291–308. doi: 10.2165/00003495-200767090-00004. [DOI] [PubMed] [Google Scholar]
- 5.Juchelková J, Hofer M, Pospísil M, Pipalová I. Radioprotective effects of flurbiprofen and its nitroderivative. Physiol Res. 1998;47:73–80. [PubMed] [Google Scholar]
- 6.Galasko DR, Graff-Radford N, May S, Hendrix S, Cottrell BA, Sagi SA, et al. Safety, tolerability, pharmacokinetics, and Abeta levels after short-term administration of R-flurbiprofen in healthy elderly individuals. Alzheimer Dis Assoc Disord. 2007;21:292–9. doi: 10.1097/WAD.0b013e31815d1048. [DOI] [PubMed] [Google Scholar]
- 7.Rockville, editor. United States Pharmacopoeia Convention; 2000. Monograph on flurbiprofen, in United States Pharmacopoeia (USP) pp. 748–50. [Google Scholar]
- 8.British Pharmacopoeia. British Pharmacop-oeia Commission. 2008:612–13. [Google Scholar]
- 9.Nagwa H, Fodaa O, Al Goharya A. High Performance liquid chromatographic determination of flurbiprofen in pharmaceutical dosage forms analyt. Lett. 1994;27:2523–34. [Google Scholar]
- 10.Szpunar GJ, Albert KS, Bole GG, Dreyfus JN, Lockwood GF, Wagner JG, et al. Pharmacokinetics of flurbiprofen in man. I. Area/dose relationships. Biopharm Drug Dispos. 1987;8:273–83. doi: 10.1002/bdd.2510080308. [DOI] [PubMed] [Google Scholar]
- 11.Geisslinger G, Menzel-Soglowek S, Schuster O, Brune K. Stereoselective high-performance liquid chromatographic determination of flurbiprofen in human plasma. J Chromatogr. 1992;573:163–67. doi: 10.1016/0378-4347(92)80492-9. [DOI] [PubMed] [Google Scholar]
- 12.Shah VP, Midha KK, Dighe S, McGilveray IJ, Skelly JP, Yacobi A, et al. Analytical methods validation: Bioavailability, bioequivalence, and pharmacokinetic studies. Int J Pharm. 1992;82:1–7. doi: 10.1007/BF03189968. [DOI] [PubMed] [Google Scholar]
- 13.Krull I, Szulc M. Detection sensitivity and selectivity, Practical HPLC method development. In: Snyder LR, Kirkland JJ, Glajch JL, editors. Canada: John Wile and Sons, Inc; 1997. [Google Scholar]
- 14.Sinha VR, Monika, Trehan A, Kumar M, Singh S, Bhinge JR. Stress studies on acyclovir. J Chromatogr Sci. 2007;45:319–24. doi: 10.1093/chromsci/45.6.319. [DOI] [PubMed] [Google Scholar]
- 15.U.S. Department of Health and Human Services Food and Drug Administration. USA: Center for Evaluation and Research; 1996. ICH, Guidance for industry: Q2B validation for analytical procedures: methodology. [Google Scholar]
- 16.Wiberg K, Andersson M, Hagman A, Jacobsson SP. Peak purity determination with principal component analysis of high-performance liquid chromatography-diode array detection data. J Chromatogr. 2004;1029:13–20. doi: 10.1016/j.chroma.2003.12.052. [DOI] [PubMed] [Google Scholar]