

Abstract
The present study characterized prototypical patterns of development in self-reported externalizing behavior, between 12 and 22 years of age, within a community sample of 452 genotyped individuals. A Caucasian subset (n = 378) was then examined to determine whether their probabilities of displaying discrete trajectories were differentially associated with CHRM2, a gene implicated in self-regulatory processes across a range of externalizing behaviors, and if affiliating with antisocial peers moderated these associations. Findings indicate that relative to a normative “lower-risk” externalizing trajectory likelihood of membership in two “higher-risk” trajectories increased with each additional copy of the minor allelic variant at CHRM2, and that this association was exacerbated among those exposed to higher levels of peer group antisocial behavior.
Prospective studies examining the etiology of externalizing behavior suggest that conduct problems in childhood and adolescence convey risk for a variety of adult externalizing problems, including violence (Farrington, 1989), chronic offending/criminal behavior (Lynam, 1996), and alcohol and substance use, abuse, and dependence (Baer et al., 1995; Englund et al., 2008; Fergusson et al., 2007; Pulkkinen & Pitkänen, 1994). Although mean increases in externalizing behavior are somewhat normative in adolescence (Moffitt, 1993), studies employing person-centered analyses often reveal a subset of individuals who persist in displaying elevated and potentially detrimental levels of externalizing problems well beyond this transition (Bongers et al., 2004; Nagin & Tremblay, 1999). Thus, identifying factors that can differentiate between (1) developmentally normative increases in externalizing behavior and (2) more severe and enduring forms of externalizing problems is particularly important for targeting individuals/populations most amenable to prevention and intervention programming, and for alleviating potentially harmful long-term public health consequences. Toward this end, developmental scientists have argued that etiological models positing functionally interdependent systems of biological, psychological, and environmental influence will best serve to clarify our understanding of behavioral processes (Cairns et al., 1993; Gottlieb, 2001; Wachs, 2000), including the development of externalizing problems.
Peer Influences on Adolescent Externalizing Behavior
Peers have often been hypothesized to play a central role in the development of externalizing problems. The extent to which an adolescent’s peers engage in antisocial behaviors is among the best predictors of whether they themselves engage in antisocial behavior (Pratt & Cullen, 2000). Moreover, these associations have been independently confirmed with respect to both aggressive (Capaldi et al., 2001) and delinquent (Vitaro et al., 2000) sub-dimensions of adolescent conduct problems, though to a lesser extent among the former, which represents a more overt form of externalizing behavior (Barnow et al., 2005).
With respect to longitudinal studies, affiliation with antisocial peers has often been examined in relation to mean externalizing trajectories (i.e., average baseline levels and rates of change), but rarely in relation to patterns of development observed within discrete subgroups of the broader population (i.e., via person-centered approaches). For example, Barnes and colleagues (2006) demonstrated that increases in baseline levels of peer’s antisocial behaviors among 506 adolescents (mean age 14.5 years) were linked with higher initial levels and rates of increase in adolescents’ alcohol misuse, illicit drug use, and delinquency across six annual assessments. In addition, Vitaro and colleagues (2005) showed that among adolescents reporting at least one friend, those whose peers collectively reported the most prominent increases in delinquency during the transition into adolescence also averaged the highest intercepts and rates of change in their own delinquent behavior across the early adolescent years.
Genetic Influences on Externalizing Behaviors
Beyond proximal environmental influences, research on the etiology of externalizing problems has focused on the role of individual differences. Twin studies show evidence for genetic influences on general externalizing behavior (Hicks et al., 2004; Krueger et al., 2002). More recently, specific genes have been identified as potential candidates that may confer differential risk for behavioral outcomes. For example, CHRM2, a gene encoding the muscarinic acetylcholine receptor M2, has been associated with a number of cognitive and biological markers known to correlate with externalizing problems. Specifically, CHRM2 has been implicated as playing an important role in neurocognitive processes such as disinhibition (Casey et al., 2007) and novelty seeking (Dick et al., 2007a). In addition, CHRM2 has been associated with P300 event-related potentials, a biomarker shared across externalizing disorders (Jones et al., 2006; Jones et al., 2004), as well as with alcohol spectrum disorders directly (Dick et al., 2006; Rangaswamy & Porjesz, 2008). In one study, CHRM2 showed the strongest association with a composite factor encompassing symptoms from a variety of specific externalizing problems and disorders (Dick, 2007; Dick et al., 2008).
Interactive Influences on Externalizing Behaviors: Genotype by Peer Group Antisocial Behavior
In addition to these main effects, twin studies have also demonstrated interdependent effects between genetic and environmental influences on externalizing behavior, indicating that adolescents with different genetic predispositions may be differentially susceptible to peer influences. Affiliation with delinquent peers has been shown to moderate genetic influences on adolescent conduct problems, with genetic effects accounting for more of the variance in problem behavior as individuals are exposed to higher levels of peer antisocial behavior (Button et al., 2007). Similar evidence has emerged from studies focused on narrower dimensions of adolescent problem behavior. With respect to adolescent alcohol use, for example, as the total number of peers who drink increased, so too did the degree to which additive genetic factors accounted for variability in the frequency with which adolescents drink (Dick et al., 2007c). Likewise, findings suggest that while affiliating with aggressive peers generally increases risk for aggression among kindergarten aged children, it can be particularly detrimental for those who are also genetically predisposed (van Lier et al., 2007). Together, these studies suggest that minimizing exposure to peer antisocial behavior may serve to protect adolescents with heightened genetic risk, decreasing their subsequent likelihood of engaging in problematic externalizing behavior. However, to our knowledge, no study has yet demonstrated this effect with respect to the risk associated with a specific gene.
Objectives of the Present Study
Given the findings described above, we hypothesize that affiliation with antisocial peers and CHRM2 genotypes are both likely to differentiate individuals displaying distinct trajectories of externalizing behavior across adolescence, with higher levels of peer group antisocial behavior and additional copies of the risk alleles resulting in increased risk of long-term behavioral problems. In addition, we hypothesize an interaction effect between these two factors in line with a diathesis-stress model of psychopathology, such that the influence of CHRM2 genotypes will increase among adolescents with more exposure to antisocial peers. As such, we will (1) identify discrete trajectories of adolescent externalizing behavior, (2) examine the predictive utility of a contemporaneous measure of antisocial behavior within the peer group and a set of nine correlated single nucleotide polymorphisms (SNPs) in CHRM2, and (3) test for gene-environment interactions between genetic variation in CHRM2 SNPs and peer group antisocial behavior.
Method
Sample
Participants in the Child Development Project (CDP) were originally recruited from public schools within three cities (Nashville and Knoxville, TN and Bloomington, IN) during kindergarten pre-registration in 1987 and 1988. The majority of the sample was enrolled by randomly approaching parents at pre-registration and inviting them to participate in a longitudinal study of child development, with ~75% agreement rate. Because a small percentage of children in the targeted schools did not pre-register (15%), a similar proportion of the CDP sample were recruited on the first day of school or through letter or telephone to maintain representativeness of the school population. The original CDP sample consisted of 585 children (52% male; 81% European American, 17% African American, and 2% other ethnic origin). The sample was generally representative of the three communities in terms of demographics and socioeconomic status. Data collection began the summer before the participants entered kindergarten (at approximately 5 years of age), and follow-ups have been conducted annually and remain on-going. Approximately 485 subjects continue to participate regularly in CDP assessments. Participants who continue involvement in the CDP are from backgrounds characterized by slightly higher SES than are attrited participants, but the continuing participants do not differ from attrited participants on initial child adjustment or other family background characteristics (Pettit et al., 1997).
DNA was collected from CDP participants from February 2006 to July 2007. For many participants, DNA collection took place at an annual follow-up visit. Following completion of phenotypic assessments, participants were invited to provide a DNA sample. However for some participants, especially for the considerable number who lived away from the main research offices, DNA was collected in the context of a special visit. DNA was collected via saliva sample using Oragene collection kits, under the supervision of a specially trained interviewer. Participants received an additional $20 for participating in the DNA collection portion of the project and provided separate consent for the genotyping component of the project. Saliva samples were subsequently labeled anonymously and mailed to the laboratory of Dr. Alison Goate at Washington University, St. Louis, where DNA extraction and genotyping occurred. DNA samples were obtained from 452 individuals (52% female), representing 91% of those participants who were able to be contacted: 378 European Americans, 64 African Americans, and 10 individuals of other ethnic origin. Institutional Review Boards at each site approved this project.
Phenotypes
Externalizing behavior
The CDP collected data on self-reported externalizing behavior using Achenbach’s Youth Self Report (YSR; Achenbach, 1991) at ages 12, 14, 15, 16, 17, and 19 and using the Young Adult Self Report (YASR; Achenbach, 1997) at ages 20, 21, and 22. While parent- and teacher-reported versions were also administered (i.e., CBCL and TRF, respectively), only self-reported behavior was assessed beyond age 17. This widely-used assessment battery consists of 113 items in the Youth version and 123 items in the Young Adult version, for which the participant indicates whether the behavior is not true, somewhat or sometimes true, or very or often true (scored 0, 1, and 2, respectively). The Externalizing Scale consists of 30 items in the Youth version and 28 items in the Young Adult version comprising both delinquency (e.g., “I don’t feel guilty after doing something I shouldn’t”; “I damage or destroy things belonging to others”) and aggression measures (e.g., “I am mean to others”; “I get in many fights”). These measures have been shown to have excellent psychometric properties including high test-retest reliability, content validity, criterion-related validity, and construct validity (Achenbach & Rescorla, 2001; 2003). Alphas in the present study ranged from 0.84 to 0.88 across the nine assessments.
Peer group antisocial behavior
At 12 years of age, participants were asked to report on the level of antisocial behavior within their peer group with respect to five characteristics: “get into fights with other kids,” “use bad language,” “lie to their parents and teachers,” “get into trouble at school,” “like to do things that make you scared or uncomfortable.” Each of the behaviors was rated on a 5-point ordinal scale that ranged from “they never do this” to “they do this very often,” and values were summed across these five items (α = .74) and divided by the total number of items for which there were responses to derive an overall measure of peer group antisocial behavior. Age 12 assessments were used to examine peer group influences on contemporaneous externalizing behavior, as well as subsequent development within this construct, as these data were not available at earlier waves.
Genotyping
Genotyping was conducted with a modified single nucleotide extension reaction, with allele detection by mass spectrometry [Sequenom MassArray system; Sequenom, San Diego, CA]. PCR and extension primers (available upon request) were designed using MassARRAY Assay Design Version 3.1.2.5. In the CDP sample, we selected nine SNPs in CHRM2 for genotyping, based on evidence of association with one or more externalizing disorders in the COGA sample (Dick et al., 2007a; Wang et al., 2004); Figure 1 depicts the locations of the SNPs, which spanned 81,130 base pairs between intron 3–4 and the 3′ untranslated region of the gene. The overall genotyping success rate was 98.4%. Twenty-four biological and 12 technical replicates were genotyped, and produced a concordance rate of 100%. All 9 SNPs were successfully genotyped for 96% of the samples.
Figure 1.

Location of genotyped SNPs within the CHRM2 gene (not drawn to scale; kb represents 1000 base pairs). Dark gray box represents coding sequence (CDS), light gray boxes represent exons encoding untranslated sequences, and the black bar represents intronic sequences.
Given differential rates of genetic recombination, allele frequencies and linkage disequilibrium (LD; an estimate of the degree of association between SNPs) often differ across populations. Thus, we limited all analyses and data reported in this paper to the European American subsample to guard against the introduction of bias via population stratification. Haploview (Barrett et al., 2005) was used to estimate LD across the nine genotyped SNPs. As in previously genotyped samples, pairwise associations between markers in CHRM2 were moderate to high (see Table 1), yielding R2 values ranging from 0.22 to 0.98. Likewise, D′ (an alternative estimate of association that is less sensitive to variation in allele frequencies; Hedrick & Kumar, 2001) values ranged from .63 to 1.00. Together, these measures of association suggest at least modest correlations between all nine SNPs; thus, analyses with individual markers do not represent independent tests of association.
Table 1.
Pair-wise Disequilibrium Between Candidate SNPs in CHRM2
| Gene Location | |||||||||
|---|---|---|---|---|---|---|---|---|---|
| Intron 3–4 | Intron 4–5 | Intron 5–6 | 3′UTR | ||||||
| Marker a | rs978437 | rs36210735 | rs7782965 | rs7800170 | rs1455858 | rs1378646 | rs1824024 | rs324650 | rs8191992 |
| Location b | 136264718 | 136274187 | 136274673 | 136274860 | 136282243 | 136285541 | 136294234 | 136344201 | 136351848 |
| rs978437 (A=.70; G=.30) c | 1.00 | 1.00 | 1.00 | .94 | .97 | .94 | .64 | .78 | |
| rs36210735 (C=.55; T=.45) | .53 | 1.00 | 1.00 | .92 | .92 | .90 | .68 | .80 | |
| rs7782965 (C=.71; T=.29) | .95 | .50 | 1.00 | .98 | .98 | .98 | .67 | .79 | |
| rs7800170 (A=.55; C=.45) | .52 | .98 | .49 | .92 | .92 | .90 | .68 | .80 | |
| rs1455858 (A=.30; G=.70) | .88 | .45 | .93 | .44 | 1.00 | 1.00 | .64 | .74 | |
| rs1378646 (A=.69; G=.31) | .91 | .47 | .89 | .46 | .95 | .98 | .63 | .74 | |
| rs1824024 (G=.31; T=.69) | .87 | .44 | .90 | .43 | .97 | .95 | .65 | .74 | |
| rs324650 (A=.55; T=.45) | .22 | .45 | .23 | .46 | .22 | .22 | .23 | .79 | |
| rs8191992 (A=.56; T=.44) | .33 | .61 | .33 | .61 | .30 | .31 | .30 | .60 | |
Notes: UTR, untranslated region; A, adenine; C, cytosine; G, guanine; T, thymine; all SNPs were in Hardy-Weinberg equilibrium; D′ values are presented above the diagonal; R2 values are presented below the diagonal.
Markers are shown as rs numbers from the dbSNP database.
Locations are derived from estimates of chromosomal position in the dbSNP database (build 36.3), and are expressed in terms of base pairs.
Marker specific allele frequencies.
Table 1 displays additional descriptive information on the nine candidate SNPs, including location within the gene, as derived from estimates of chromosomal position within the dbSNP database, and sample-specific frequencies for the two nucleotide bases comprising each SNP [adenine (A), cytosine (C), guanine (G), thymine (T)]. All allele frequencies were in line with those reported in the European American sample of the HapMap project (as displayed in the dbSNP database, build 36.3). Moreover, all SNPs were in Hardy Weinberg equilibrium, indicating that the allele frequencies observed in the European American subset of the CDP sample reflect the population frequencies that would be expected within a randomly mating population, providing further support for the absence of potential genotyping problems. To assess the influence of CHRM2 within our analyses (described below), each of the SNPs is coded 0, 1, or 2, reflecting an additive genotypic model. This coding is in reference to the number of copies of the minor (least frequently observed) allele for all SNPs, which, in this sample, also correspond to the allelic variants associated with increased risk.
Statistical Analyses
By way of model building, our analyses followed three sequential steps. First, growth mixture modeling (GMM; Jung & Wickrama, 2007; Muthén & Shedden, 1999) was used to identify homogeneous subgroups of individuals manifesting distinct patterns of change in their externalizing problems from early adolescence through young adulthood (i.e., from age 12 to 22 years). Conventional growth curve modeling assumes a mean pattern of change in behavior within the population, with individual differences expressed in terms of normal variability around specified growth parameters (i.e., intercept and slope coefficients that define the level and shape of the change; see McArdle & Epstein, 1987). GMM is a widely used extension of this procedure that allows for the possibility of two or more discrete subgroups of individuals within a population, each having unique mean trajectories, as well as individual variability around the mean intercepts, linear slopes, and rates of acceleration (Muthén & Muthén, 2000). Because the identification and explanation of within-group differences was not a primary focus of the present analyses, the variances for all like growth parameters were constrained to be equal across trajectory classes in order to aid in model convergence. Moreover, this analysis was carried out using the full subsample of European Americans in order to increase our power to detect relatively small, yet meaningful patterns of behavior.
Second, for those on whom genetic data were collected, a series of ten univariate conditional growth mixture models were fit independently to determine the main effects of the number of CHRM2 risk alleles (via separate models testing each of 9 distinct SNPs) and peer group antisocial behavior on probabilities of membership in the emergent trajectory classes. Thus, independent associations with peer group antisocial behavior and each of the nine SNPs were tested in separate models.
In a third step, analyses were further extended to include a set of three predictors (i.e., SNP, peer group antisocial behavior, and the SNP by peer group antisocial behavior product term) in a series of ten multivariate conditional growth mixture models, which were used to assess the interactive influence of gene by environment on probabilities of membership within discrete trajectory classes. Again, the interaction analysis was conducted only among those for whom genetic data were collected.
With respect to missing data, participants included in the unconditional analysis (n = 443) did not differ significantly from those excluded on the basis of having no relevant externalizing data (n = 34) in terms of maternal-reported externalizing behavior at the study’s inception (i.e., age 5), t(461) = −.49, p = .63, or in the year immediately preceding the present study’s initial assessment (i.e., age 11), t(373) = .79, p = .43. Similarly, no differences were observed on age 11 ratings of peer antisocial behavior, t(2.002) = .90, p = .47.
Among those included in the initial GMM, 90 of a possible 512 (i.e., 29) missing data patterns were observed. To summarize, 47.9% had data for all nine externalizing assessments, 44.2% had between four and eight data points (i.e., surpassing the threshold recommended for non-linear analyses), and 7.9% had between one and three assessments. However, the number of available externalizing assessments was not associated with trajectory class membership, χ2(16) = 22.88, p = .12, nor with age 12 reports of peer group antisocial behavior, F(8, 353) = 1.67, p = .10. Likewise, post-hoc comparisons between those who consented to DNA collection and those who refused revealed only negligible differences in trajectory class membership, χ2(2) = 1.22, p = .54, and peer group antisocial behavior, t(383) = 1.24, p = .22.
Since no detectable systematic bias was observed, the patterns of missingness in this data were assumed to have occurred randomly (MAR; Schafer & Graham, 2002). As such, all analyses were conducted in Mplus version 5.0 (Muthén & Muthén, 2007), where missing data were accommodated in via robust maximum likelihood estimation, taking advantage of all available data rather than deleting cases with partially missing data. A standard set of indices was used to assess relative model fit, quality of classification, and direct comparisons between models: Bayesian information criterion (BIC; Kass & Raftery, 1995; Keribin, 1997), Akaike information criterion (AIC; Akaike, 1974), entropy coefficients (Muthén, 2004), and the Lo-Mendel-Rubin likelihood ratio test (LMR-LRT; Lo et al., 2001). Finally, given the strategies described above for examining conditional associations among Caucasian adolescents after further partitioning the sample into developmentally heterogeneous subgroups, all primary analyses were conducted irrespective of sex.
Results
Descriptive statistics for all non-genetic study variables are presented in Table 2. Sample means, standard deviations, and response ranges are reflected on the diagonal for the nine time-specific raw externalizing scores used in the derivation of externalizing trajectories, and for adolescents’ reports of their peer group’s antisocial behavior. Bivariate associations between these variables are depicted off-diagonal, via Pearson’s correlation coefficients. Not surprisingly, externalizing scores increased into mid-adolescence and decreased thereafter, with relatively stable levels of variability across time. Moreover, associations between these variables were strong, particularly among those closest in temporal proximity, but diminished in magnitude as the time between measurements increased. Notably, no significant associations were found between the any of the nine SNPs in CHRM2 and peer group antisocial behavior.
Table 2.
Descriptive Statistics and Bivariate Associations for all Non-Genetic Study Variables
| 1 | 2 | 3 | 4 | 5 | 6 | 7 | 8 | 9 | 10 | |
|---|---|---|---|---|---|---|---|---|---|---|
| 1. Age 12 YSR externalizing |
M=10.89 SD=5.95 (0–33) |
|||||||||
| 2. Age 14 YSR externalizing | .484 |
M=10.53 SD=6.82 (0–48) |
||||||||
| 3. Age 15 YSR externalizing | .341 | .708 |
M=11.01 SD=6.97 (0–38) |
|||||||
| 4. Age 16 YSR externalizing | .419 | .653 | .713 |
M=11.53 SD=7.26 (0–42) |
||||||
| 5. Age 17 YSR externalizing | .336 | .576 | .665 | .717 |
M=9.75 SD=6.98 (0–39) |
|||||
| 6. Age 19 YSR externalizing | .346 | .469 | .580 | .576 | .668 |
M=9.51 SD=5.83 (0–42) |
||||
| 7. Age 20 YASR externalizing | .331 | .452 | .562 | .549 | .653 | .690 |
M=7.56 SD=5.93 (0–33) |
|||
| 8. Age 21 YASR externalizing | .377 | .454 | .530 | .528 | .616 | .621 | .731 |
M=7.65 SD=6.11 (0–34) |
||
| 9. Age 22 YASR externalizing | .277 | .425 | .495 | .495 | .595 | .611 | .688 | .703 |
M=7.87 SD=6.04 (0–32) |
|
| 10. Age 12 self-reported peer group antisocial behavior | .541 | .320 | .253 | .263 | .205 | .298 | .180 | .224 | .217 |
M=1.80 SD=.65 (0–4.4) |
Notes: Sample means, standard deviations, and ranges for each variable are presented on the diagonal; Pearson’s correlation coefficients are presented off-diagonal, all of which were significant at p≤.001.
Although not central to the study hypotheses, post-hoc analyses were conducted to determine the extent to which study variables differed by sex. Findings revealed virtually no association with genotype, as Pearson’s correlation coefficients across SNPs ranged in absolute value from .003 to .12, with only one SNP achieving significance at an α = .05 (i.e., rs1824024), though not surviving correction for multiple testing. With respect to the effect of sex on peer group antisocial behavior, there was a trend toward significance (χ2, 420.57 = 1.853, p = .065), with males reporting higher levels than females.
Identification of Trajectories of Externalizing Behavior
In modeling repeated measurements of externalizing problems across nine assessments, an initial comparison was made between traditional linear and quadratic growth curve models to determine whether we should allow for non-linear change in subsequent growth mixture models. Indices of model fit suggested that a model incorporating non-linear growth (χ2, 36 = 229.20; CFI = .90; BIC = 20146.90; AIC = 20073.22) was more representative of the data than a model restricted to linear change (χ2, 40 = 310.49; CFI = .87; BIC = 20203.81; AIC = 20146.51), and a formal likelihood ratio test of the difference in the nested models supported this (χ2Δ, 4 = 81.29, p < .001).
Growth mixture modeling was then implemented to determine whether a single quadratic trajectory was sufficient to represent change in externalizing behavior across the entire sample. Consideration of several selection criteria suggested that a 3-class solution fit the externalizing data best. Table 3 shows decreases in both BIC (21955.83 to 20751.22) and AIC (21906.71 to 20685.72) between a single class and the 2-class solution. Likewise, the likelihood ratio test comparing the fit of one versus two trajectories favored the 2-class solution (p < .001). The addition of a third trajectory class was also marked by improved fit as indicated by BIC (20751.22 to 20439.87) and AIC (20685.72 to 20358.00), though there was some decrement in classification entropy (from .90 to .86). However, a formal comparison of differences in the likelihood ratios of the two- and three-class solutions implied that an additional longitudinal pattern of externalizing behavior could be differentiated (p < .01). Regarding the addition of a fourth distinct pattern of externalizing problems, BIC and AIC once again decreased (20275.21 and 20176.97, respectively), while the overall quality of classification was further reduced (entropy went from .86 to .82). The LMR-LRT indicated that the addition of a fourth class would not result in significant improvement in model fit (p = .06). Figure 2 depicts these three GMM estimated externalizing trajectories.
Table 3.
Fit Indices for Initial Model Comparisons and Conditional Main Effect and Interaction Models
| BIC a | AIC a | Entropy b | LMR-LRT c | |
|---|---|---|---|---|
| Comparisons: Quadratic GMMs | ||||
| 1-class solution | 21955.83 | 21906.71 | -- | -- |
| 2-class solution | 20751.22 | 20685.72 | .90 | < .001 |
| 3-class solution | 20439.87 | 20358.00 | .86 | < .01 |
| 4-class solution | 20275.21 | 20176.97 | .82 | .06 |
Notes: AIC, Akaike information criteria; BIC, Bayesian information criteria; LMR-LRT, Lo-Mendel-Rubin likelihood ratio test; --, cannot be calculated.
These indices balance model complexity and goodness of fit to the sample data, with smaller values denoting better fit.
An indicator of how well a model predicts profile membership, with values closer to 1 denoting greater precision.
A direct test comparing models with k and k-1 classes, wherein p ≤ .05 denotes significant improvement in fit, indicating that the model with k-1 classes should be rejected in favor of the model with k classes.
Figure 2.
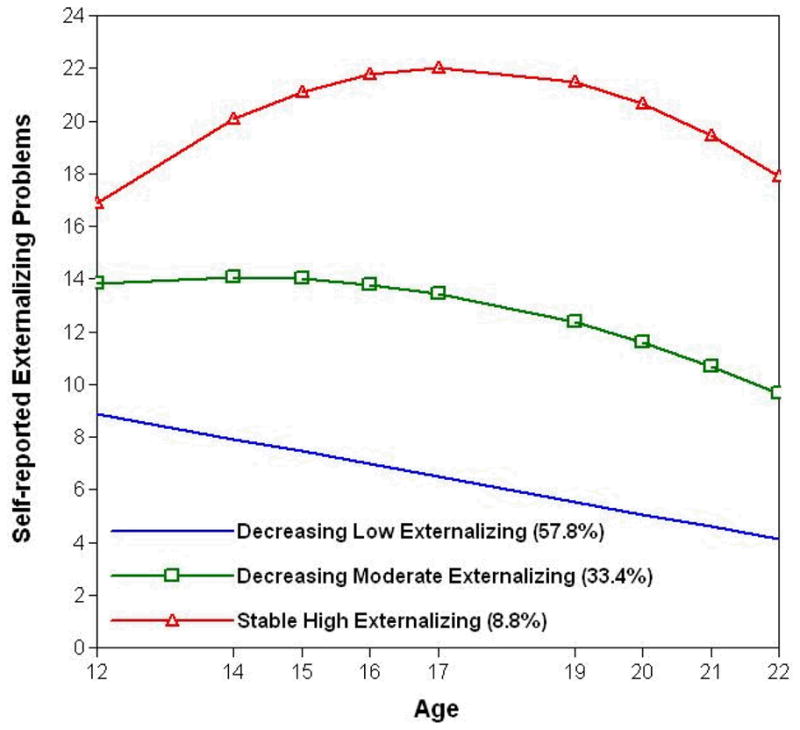
Three-class quadratic solution for trajectories of self-reported externalizing problems from 12 to 22 years of age.
The majority of the sample exhibited a developmentally limited pattern of externalizing behavior (57.8%), peaking at or before the initial wave of assessment (at age 12), and displaying a steady linear decline thereafter, with no evidence of non-linear change (βintercept = 8.89, p < .001; βlinear = −.48, p < .001; βquadratic = .00, p = .96); we refer to this group as decreasing low externalizing. About one third of the sample (33.4%) showed a longitudinal pattern of change marked by somewhat higher initial levels of externalizing behavior that remained relatively stable before de-escalating in mid-adolescence (βintercept = 13.80, p < .001; βlinear = .27, p = .32; βquadratic = −.07, p = .005); decreasing moderate externalizing. A smaller subset of the sample (8.8%) had even higher initial levels of externalizing behavior that further increased until peaking in mid-adolescence (i.e., at ~17 years of age), then decreased again into young adulthood, though never dipping below early adolescent levels. (βintercept = 16.86, p < .001; βlinear = 1.97, p < .001; βquadratic = −.19, p < .001); that is, a stable high externalizing pattern. Post-hoc analyses suggested a difference in the distribution of trajectory class membership across the sexes (χ2, 2 = 8.49, p = .014) which corresponded to higher posterior probabilities of membership in the decreasing low externalizing class among females (t, 440.79 = −2.795, p = .005).
Conditional Models with CHRM2 Predicting Trajectories
Multinomial logistic regression (via conditional GMM; see Wang & Bodner, 2007) was used to determine whether CHRM2 genotypes were differentially predictive of discrete patterns of externalizing behavior. Table 4 displays results from a series of nine genetically informative models in which the probability of trajectory class membership was independently regressed on the genotypes for each of the nine SNPs. Cross-tabulations of probable trajectory class membership by genotype suggested that the likelihood of displaying the normative form of development, the decreasing low externalizing trajectory, decreases with each additional copy of the minor allele; a pattern that was evidenced across all nine SNPs. Thus, carriers of the minor allele appeared to be at greater risk of developing along one of the two higher-risk externalizing trajectories. However, given the qualitative nature of these developmental classifications, multinomial logistic regression models were used to assess whether the number of minor alleles at each of the SNPs was differentially associated with the probabilities of membership for any two trajectories. As such, we found evidence that CHRM2 genotypes were significantly associated with such differences when contrasting the decreasing low externalizing trajectory with both the decreasing moderate (across four of the nine SNPs; odds ratios ranging from 1.8 to 2.5) and stable high (across five of the nine SNPs; odds ratios ranging from 2.1 to 3.2) patterns of development in externalizing behavior. Even after an overly conservative Bonferroni correction for nine separate tests of the main effect, significance was maintained for three SNPs in relation to the first contrast and two SNPs in relation to the second contrast. Moreover, post-hoc analyses incorporating sex as a covariate revealed the same pattern of associations.
Table 4.
Odds Ratios for Trajectory Class Membership as a function of Genotype
| SNP | Copies of the minor Allele | Main Effects | ||||||||||
|---|---|---|---|---|---|---|---|---|---|---|---|---|
| 0
|
1
|
2
|
DL vs DM
|
DL vs SH
|
DM vs SH
|
|||||||
| DL | DM | SH | DL | DM | SH | DL | DM | SH | OR (95% CI) | OR (95% CI) | OR (95% CI) | |
|
|
|
|||||||||||
| rs978437 | .79 | .18 | .03 | .62 | .29 | .09 | .52 | .39 | .09 | -- | -- | -- |
| rs36210735 | .64 | .30 | .06 | .60 | .29 | .11 | .54 | .40 | .06 | -- | -- | -- |
| rs7782965 | .82 | .15 | .03 | .62 | .30 | .08 | .52 | .38 | .10 | -- | -- | -- |
| rs7800170 | .63 | .30 | .07 | .60 | .29 | .11 | .54 | .41 | .05 | -- | 2.1 (1.1, 4.2)* | -- |
| rs1455858 | .79 | .16 | .05 | .61 | .31 | .08 | .53 | .37 | .10 | 2.5 (1.4, 4.3)** | 2.7 (1.2, 5.9)* | -- |
| rs1378646 | .75 | .20 | .05 | .62 | .31 | .07 | .52 | .38 | .10 | -- | -- | -- |
| rs1824024 | .76 | .19 | .05 | .61 | .32 | .07 | .53 | .37 | .10 | 2.5 (1.6, 4.0)*** | 3.2 (1.5, 7.0)** | -- |
| rs324650 | .63 | .31 | .06 | .59 | .30 | .11 | .55 | .39 | .06 | 2.3 (1.4, 3.7)*** | 3.0 (1.6, 5.6)*** | -- |
| rs8191992 | .62 | .32 | .06 | .61 | .30 | .09 | .54 | .37 | .09 | 1.8 (1.1, 3.1)* | 2.3 (1.2, 4.3)** | -- |
p ≤ .001;
p ≤ .01;
p ≤ .05. Bold face type denotes those effects withstanding a Bonferroni correction of α/9 (p ≤ .0056).
Notes: SNP, single nucleotide polymorphism; DL, decreasing low; DM, decreasing moderate; SH, stable high; --, non-significant; OR, odds ratio.
For illustrative purposes, data from the fifth SNP in Table 4 (rs1455858) indicate that among adolescents with a “AA” genotype (i.e., with two copies of adenine and zero copies of the “G” variant, guanine), 79% are likely to display relatively low initial levels of externalizing problems that decline throughout adolescence, 16% are likely to display somewhat more moderate initial levels that also decrease over time, and only 5% are likely to display persistently high levels of externalizing problems. In comparison, adolescents with the “GG” genotype still have the highest likelihood of belonging to the decreasing low externalizing trajectory, though much less so than their homozygous “AA” counterparts (53% versus 79%). In addition, “GG” adolescents are more than twice as likely as “AA” adolescents to be probabilistically assigned to the decreasing moderate trajectory (37% versus 16%), and two times as likely to display a persistently high pattern of externalizing problems (10% versus 5%). Genotype (modeled additively) was not predictive of relative differences in the odds of membership in the moderate decreasing versus stable high externalizing trajectories. Of note, a parallel analysis with probability of trajectory class membership regressed on peer group antisocial behavior yielded no evidence of association.
Conditional Models with Peer Group Antisocial Behavior Interacting with CHRM2
The next series of conditional GMM was run incorporating both genetic and environmental covariates, wherein probability of class membership was regressed on (1) genotype, (2) peer group antisocial behavior, and (3) a product term representing the genotype by environment interaction. Again, multinomial logistic regression analyses were used to determine whether genotype and peer group antisocial behavior functioned interdependently in relation to probabilistic patterns of development in externalizing behavior. Table 5 provides evidence of significant moderation. Findings indicated that the overall level of antisocial behavior within the extended peer group moderated the extent to which genotype was predictive of trajectory class membership. Specifically, peer group antisocial behavior was differentially associated with CHRM2 genotype in adolescents with stable high externalizing trajectories when compared to those with more normatively decreasing low levels of problem behavior. This effect was demonstrated in relation to six of the nine candidate SNPs (Table 5; odds ratios ranging from 2.6 to 3.6), with a trend toward significance in a seventh SNP (OR = 2.2). In addition, peer group antisocial behavior was useful in distinguishing between genotypic variability in discrete forms of developmentally limited externalizing behavior; that is, adolescents with low versus moderate decreasing trajectories. As shown in Table 5, this finding was confirmed in three SNPs (odds ratios ranging from 1.9 to 4.1), with two additional SNPs yielding marginal associations (OR = 2.0 and 2.5). Again, following a standard Bonferroni correction, the interaction effect remained significant with respect to both contrasts, but only for a single SNP. Again, post-hoc analyses with sex as a covariate revealed a pattern of associations consistent with those described above.
Table 5.
Odds Ratios for Trajectory Class Membership as a function of Genotype by Environment Interactions
| SNP | Interaction Effects | ||
|---|---|---|---|
| DL vs DM
|
DL vs SH
|
DM vs SH
|
|
| OR (95% CI) | OR (95% CI) | OR (95% CI) | |
|
|
|
||
| rs978437 | 1.9 (1.04, 3.7)* | 2.6 (1.03, 3.6)* | -- |
| rs36210735 | 4.1 (2.0, 8.4)*** | 3.6 (1.5, 8.5)** | -- |
| rs7782965 | -- | 2.9 (1.1, 8.1)* | -- |
| rs7800170 | ‡ | -- | -- |
| rs1455858 | ‡ | 3.4 (1.2, 9.6)* | -- |
| rs1378646 | 2.2 (1.1, 4.3)* | 3.0 (1.1, 8.3)* | -- |
| rs1824024 | -- | 3.3 (1.1, 9.5)* | -- |
| rs324650 | -- | -- | -- |
| rs8191992 | -- | ‡ | -- |
p ≤ .001;
p ≤ .01;
p ≤ .05;
p ≤ .10. Bold face type denotes those effects withstanding a Bonferroni correction of α/9 (p ≤ .0056).
Notes: SNP, single nucleotide polymorphism; DL, decreasing low; DM, decreasing moderate; SH, stable high; --, non-significant; OR, odds ratio.
Figure 3 depicts expected trajectory class membership as a function of CHRM2 genotype (for a single, representative SNP, rs978437) and peer group antisocial behavior (which was modeled as a continuous variable, but illustrated using a median split). Among adolescents perceiving relatively little antisocial behavior within the peer group, CHRM2 genotype appeared to play a smaller role in differentiating between those with decreasing low (GG = 82%, AG = 74%, and AA = 72%) and high stable externalizing trajectories (GG = 6%, AG = 4%, and AA = 4%) as compared with those reporting high levels of peer group antisocial behavior, where there were much stronger differences in trajectory membership as a function of genotype (GG = 73%, AG = 57%, AA = 32% versus GG = 0%, AG = 11%, AA = 17% in the decreasing low and stable high trajectory classes, respectively). Likewise, genotype was better able to discriminate between probabilities of membership in the low (GG = 73%, AG = 57%, AA = 32%) versus moderate (GG = 27%, AG = 32%, AA = 51%) decreasing trajectories among adolescents reporting high exposure to peer group antisocial behavior when compared with those reporting relatively little antisocial behavior within their peer group (GG = 82%, AG = 74%, AA = 72% versus GG = 12%, AG = 22%, AA = 24% in the decreasing low and moderate decreasing trajectory classes, respectively). Thus, an expected pattern of interaction effects emerges whereby the influence of CHRM2 genotype on longitudinal patterns of externalizing behavior appears to be stronger among adolescents whose peer networks display higher levels of antisocial behavior.
Figure 3.

Expected trajectory class membership as a function of CHRM2 genotype (rs978437) and peer group antisocial behavior, wherein “A” represents the minor allelic variant.
Discussion
With an abundance of evidence suggesting the significant role of genes in behavior, it has become increasingly important to clarify how identified genes exert their influence. As such, it is critical that we address questions regarding mechanisms of genetic risk through a developmental lens, using longitudinal designs, and that we further examine how genetic susceptibility may vary as a function of environmental factors. This is the approach we have taken in the present study. Initially associated with alcohol dependence (Wang et al., 2004), CHRM2 has subsequently been identified as a gene that most strongly predisposes to a broad spectrum of externalizing problems in adults (Dick, 2007; Dick et al., 2008). We extended these findings by examining candidate SNPs in CHRM2 within an independent, community-based sample of children, who were followed longitudinally from childhood through young adulthood. With self-reported data from nine time points between the ages of 12 and 22, growth mixture modeling was used to identify three discrete trajectories of general externalizing behavior: 57.8% of the sample showed modest initial levels of externalizing problems that declined over time, roughly one-third (33.4%) of the sample displayed more moderate levels of externalizing problems that also declined with age, and 8.8% of the sample was characterized by higher initial levels of externalizing behavior that peaked during the late teenage years, but persisted into adulthood. Generally speaking, individuals displaying the most modest initial levels of externalizing problems were significantly less likely to carry additional copies of CHRM2 risk variants than were those with either stable high or decreasing moderate levels of externalizing behavior throughout adolescence and into early adulthood. As such, our findings build on earlier work by confirming links between CHRM2 and general externalizing behavior in a non-clinical population, and by broadening the nature of this association to incorporate differentiation between more developmentally relevant measures (trajectories) of externalizing behavior. Moreover, the GMM presented here extends that which was previously reported by our group in relation to GABRA2 and parental monitoring (Dick et al., 2009). Findings from the initial study indicated that a two-class solution best described the developmental heterogeneity in externalizing behavior between the ages of 12 and 22. In that study, however, trajectories were defined only in terms of linear growth. Given accumulating evidence that differential rates of change in externalizing behavior are likely to be observed over such an extended period of time (Bongers et al., 2004; Nagin & Tremblay, 1999), we opted for a less restrictive, and potentially more realistic model in the present analyses, allowing for the possibility of non-linear change via the inclusion of a quadratic growth parameter.
To our knowledge, there is little evidence of developmental heterogeneity in general externalizing problems across adolescence. That is, early discussions of discrete developmental trajectories pertained solely to behavior at the extremes of the externalizing continuum, such as criminal offenses (Moffitt, 1993). More recently, however, developmental heterogeneity has been identified within the literature on specific, but less extreme forms of externalizing problems. For example, in most externalizing domains the majority of individuals (belonging to one or more distinct groups) will display some measure of increase in their mean levels of externalizing behavior during the early stages of development, peak sometime during adolescence, and then gradually desist from the problem behavior as they move into later adolescence or early adulthood. At the same time, there is typically a much smaller subpopulation of individuals showing heterotypic continuity; that is, they persist in displaying externalizing problems, though the specific behaviors may morph to more appropriately reflect the present developmental period (Kagan, 1969; Kagan & Moss, 1983). Two studies examining adolescents within non-selected samples of European Americans have found distinct subgroups exhibiting persistently elevated levels of risk in relation to a variety of disinhibitory behaviors including physical aggression (4%; Nagin & Tremblay, 1999), opposition (~6%; Bongers et al., 2004; Nagin & Tremblay, 1999), property violations (5%; Bongers et al., 2004), and even hyperactivity (6%; Nagin & Tremblay, 1999). Thus, the trajectories found in this sample appear to be representative of those described in the extant literature on discrete patterns of development across a broad range of conduct problems.
The associations that we observed between peer group antisocial behavior and developmental heterogeneity in externalizing behavior were in the expected direction, though they were not as significant as we might have expected. While the existing literature generally suggests a detrimental influence of deviant peers, these findings mostly derive from studies examining more temporally proximal indices of externalizing behavior. In the present study, we tested only prospective associations between indices of peer group antisocial behavior at age 12 and trajectories of externalizing behavior spanning adolescence and into young adulthood (ages 12–22). As such, it is not altogether surprising that exposure to antisocial peers as assessed in preadolescence would not have strong main effects on long-term externalizing behavior patterns. We believe this makes the fact that we find evidence for interactions between peer group antisocial behavior and genetic predispositions, as measured by SNPs within CHRM2, all the more striking. In addition, it is important to note that the rather modest association that we observe is not at odds with extant evidence supporting a more robust association between antisocial peers and externalizing behavior, as those findings generally derive from simple linear regressions with continuous measures of both the dependent and independent variables, whereas our results derive from a multinomial logistic regression assessing the predictive ability of peer group antisocial behavior with respect to probability of membership within discrete externalizing trajectories.
With respect to the biological underpinnings of behavior, we found that genetic variability in CHRM2 accounted for differences in individuals’ probabilities of developing distinct patterns of more general externalizing problems. What, however, are the intermediary mechanisms accounting for this association? Given prior evidence linking CHRM2 to disorders such as alcohol and illicit drug dependence, which are characterized by poor self-regulatory behavior, and to an electrophysiological marker of central nervous system (CNS) hyperexcitability, this gene may be involved in inhibitory control via disturbances in cognition -- information processing in particular. It has been suggested that reduced amplitude of the P300 event-related brain potential, an abnormality which has often been observed in individuals at risk for various forms of externalizing psychopathology, represents either an excess of CNS excitation or a deficit of CNS inhibition. In this way, CHRM2 may play an important role in regulating homeostasis in this neurocognitive system.
Anatomically, CHRM2 receptors are localized in cardiac muscle and serve to modulate potassium channels, which contribute to decreases in heart rate. A recent meta-analysis conducted on 45 independent effect sizes across 40 separate studies suggests that low resting heart rate is among the best-replicated biological correlates of antisocial behavior in children and adolescents (overall d = −0.44, p < .0001; see Ortiz & Raine, 2004). Moreover, researchers have posited a number of potential explanations for this link, including attempts to maintain normative levels of physiological arousal through acting out (Eysenck, 1997; Quay, 1965; Raine, 1997), and inadequate development of social consciousness given the inability to be conditioned to fear and punishment (Raine, 1993; Raine, 1997).
Importantly, it is still not clear how CHRM2 is involved in externalizing behavior at the functional level. Multiple SNPs were selected for genotyping in this sample, based on prior evidence of association with externalizing psychopathologies in the COGA sample (Dick et al., 2008; Wang et al., 2004). However, none of these SNPs has known functional properties; none are directly involved in altering the protein product of the gene. Rather, it is assumed that these SNPs are correlated with the (unknown) functional variant(s), which would also contribute to different degrees of significance detected with different SNPs (as found in this study and previous ones). Because there are multiple locations across genes where variation could contribute to differences in gene function or regulation, testing multiple SNPs across a gene is considered the optimal strategy for candidate gene studies (“Biological Psychiatry,” 2009). The fact that the associated SNPs (across this study and previous ones) span different regions of the gene also suggests that there may be multiple variants in the gene that have functional effects that contribute to differential susceptibility to externalizing behavior.
With respect to the moderating influence of peers on associations between CHRM2 and development in externalizing behavior, our findings appear to fall in line with a diathesis-stress model, whereby affiliating with antisocial peers exacerbates one’s own biological predisposition to act out. It is possible, however, that this interpretation is an artifact of our use of median splits to plot the environmental effects, or of truncation at the positive end of the peer groups’ behavioral continuum. That is, CHRM2 could function more differentially, also protecting against the development of risky externalizing behavior in particularly prosocial peer environments (see Belsky et al., 2009). Future research is necessary to better characterize these effects. In addition, modeling gene-environment interactions within a regression framework does not allow us to differentiate between moderating and moderated variables. So, although our findings are presented in terms of moderating influence of peers’ behaviors on genetic susceptibility, it could also be conceived of as genetic moderation of the peer groups’ influences.
Adolescents with a genetic liability for the development of externalizing problems may also be more prone to choose or elicit affiliations with peers who show patterns of behavior similar to their own. Such selection falls in line with the early theoretical work of Scarr and McCartney (1983), who posited active or evocative gene-environment correlations (Plomin et al., 1977) as a corollary to the increased autonomy that accompanies the transition into adolescence. In relation to the effects found here, we can be confident that the extent to which social influence exacerbates one’s genetic liability for the development of externalizing problems (i.e., gene-environment interaction) was unadulterated by social selection, at least with respect to CHRM2, given the absence of an association between genotype and peer group antisocial behavior. It is not clear, however, whether the social influence observed in the present study reflects deviancy training (i.e., behavioral modification in response to peers’ responses; Capaldi et al., 2001; Dishion et al., 1995), peer modeling (i.e., behavioral initiation in response to peers’ behaviors; Fromme, 1983), or both. Thus, future examination of the moderating role of peer group antisocial behavior should test whether discrete mechanisms of reinforcement function similarly or differentially with respect to identified genetic risks.
There are also several limitations to acknowledge in the present study. First, the size of the sample precluded testing several potentially important hypotheses. With respect to sex, for example, it has been suggested that the drinking behaviors of adolescent girls are more susceptible to the influences of peers than are those of boys (Dick et al., 2007b). Moreover, males and females have been shown to differ markedly in their prevalences of individual externalizing disorders (Kessler et al., 1994; Newman et al., 1996; Moffitt et al., 2001) and general externalizing problems (Hicks et al., 2007). Although genotype was not differentially associated with sex in this study, girls were clearly overrepresented in the decreasing low externalizing trajectory. Replication within a larger sample would allow us to incorporate sex as a moderator or to examine relevant influences in relation to sex-specific patterns of development. In addition, a larger sample may provide the power necessary to model development separately within the distinct domains of aggression and delinquency.
Other potential moderators of consequence include parental socialization and the quality of peer relationships. There is evidence within the literature, for example, denoting an interplay between parental and peer influences on externalizing behavior that has not been addressed here (Lansford et al., 2003). Moreover, work specific to the influences of antisocial peers suggests that although the quality of adolescents’ peer relationships is not directly associated with their own delinquent behavior, having higher quality relationships with antisocial friends may exacerbate the influence of peer group deviance on one’s own behavior (Laird et al., 1999).
We also note three measurement related issues. First, method invariance could account for some portion of the associations described in our findings, as both externalizing behavior and peer group antisocial behavior were derived from self-report. Thus, adolescents’ perceptions of the antisocial behaviors of their peers could bias their assessments of their own behaviors, and vice versa, whereas an objective measure of one or the other would remove any such dependencies in the data. However, these findings are consistent with prior examinations of the same sample which evidenced similar patterns of association between child-reported peer group antisocial behavior and teachers’ ratings of externalizing behavior (Laird et al., 1999; Lansford et al., 2003), as well as those from two other studies examining latent gene-environment interaction in relation to externalizing problems, both of which used peer-reported measures of peer deviance (Brendgen et al., 2008; van Lier et al., 2007). A second issue of measurement is related to the fact that externalizing behavior was measured via 30 items in each of the first six assessment periods, but only 28 items thereafter. Although the variance remained relatively stable across waves, it is possible that the mean decreases starting around 17 years of age are falsely inflated by the truncated range of raw scores at the tail end of the trajectories. However, post-hoc examination of the proportion of items endorsed at each wave revealed a similar downward trend, again beginning in late adolescence. Lastly, while we did make an effort to restrict our analyses to a more genetically homogeneous subsample, it is important to acknowledge the potential for population stratification within self-defined European American populations, where individuals may still derive from diverse ancestries (Heutink & Oostra, 2002).
A final limitation is related to multiple testing. A central issue in the field of genetic association studies is a lack of consensus on how to deal with multiple, non-independent analyses. Several strategies have been considered, including the standard Bonferroni correction for the total number of SNPs being analyzed, modifications of the Bonferroni correction based on the estimated number of independent SNPs being analyzed (Gao et al., 2010; Nyholt, 2004), evaluation based on rank-ordering of p-values (Helgadottir et al., 2007), false discovery rates (Benjamini & Hochberg, 1995), and Bayesian methods (Wakefield, 2007). See Ziegler and colleagues (2008) for a recent review of these issues. In the present study, this issue is compounded by the use of multinomial logistic regression, where the prediction of differential probabilities of membership across three discrete trajectory classes yields test statistics for two non-redundant pairwise comparisons (DL vs. DM & DL vs. SH) per analysis. Moreover, in addition to the question of the number of independent analyses on which to base a correction, it is not even clear whether corrections should be made with respect to specific comparisons between trajectory classes, or at the omnibus level of overall SNP effects across trajectory classes. So, although nine separate models were run to address each of the genetically informative hypotheses (i.e., main and interactive effects), we chose both to present significance values corresponding to the uncorrected alpha (.05), and to highlight those effects which held up to the highly conservative Bonferroni correction of α = .0056. We note, however, that the best threshold is likely somewhere in between (Ziegler et al., 2008).
In conclusion, we find evidence that CHRM2 is associated with different developmental patterns of externalizing behavior from early adolescence through young adulthood, and further demonstrate that the effect of this gene on externalizing trajectories can vary as a function of exposure to antisocial behavior within one’s peer group. These analyses underscore the importance of studying genetic influences across development, and of identifying environmental factors that moderate risk. In terms of future directions, we suggest that the ultimate goal of this work should be to inform the design and implementation of effective prevention/intervention programming for individuals predisposed to the development of problematic externalizing profiles. Realistically, however, these findings are most likely to represent incremental progress in a much longer process of characterizing the complex mechanisms by which specific environmental factors moderate the risk associated with identified genes, and vice versa. Regarding CHRM2, much work remains to be done in terms of articulating the mechanisms of cause and effect, and it would be irresponsible to suggest otherwise. Thus, empirical efforts should remain our focus until such a time as the clinical utility of these basic research findings can be more fully realized.
Acknowledgments
The Child Development Project has been funded by grants MH42498, MH56961, MH57024, MH057024-07S1 (supplemental funds to collect DNA), and MH57095 from the National Institute of Mental Health; HD30572 from the Eunice Kennedy Shriver National Institute of Child Health and Human Development; and DA016903 from the National Institute on Drug Abuse. This manuscript was prepared with support by AA17013 (to SJL), AA15416 and Independent Scientist Award AA018755 (to DMD) from the National Institute of Alcohol Abuse and Alcoholism. KAD acknowledges the support of Senior Scientist Award DA015226 and Center grant DA017589 from the National Institute on Drug Abuse.
Footnotes
Dr Goate reports being listed as an inventor on patent US 20070258898, covering the use of certain single nucleotide polymorphisms in diagnosing, prognosing, and treating addiction. No other authors report any financial disclosures.
Contributor Information
Shawn J. Latendresse, Virginia Institute for Psychiatric and Behavioral Genetics, Virginia Commonwealth University
John E. Bates, Department of Psychological and Brain Sciences, Indiana University
Jackson A. Goodnight, Department of Psychological and Brain Sciences, Indiana University
Jennifer E. Lansford, Center for Child and Family Policy, Duke University
John P. Budde, Department of Psychiatry, Washington University School of Medicine
Alison Goate, Department of Psychiatry, Washington University School of Medicine.
Kenneth A. Dodge, Center for Child and Family Policy, Duke University
Gregory S. Pettit, Department of Human Development and Family Studies, Auburn University
Danielle M. Dick, Virginia Institute for Psychiatric and Behavioral Genetics, Virginia Commonwealth University
References
- Achenbach TM. Manual for the Youth Self-Report and 1991 Profile. Burlington, VT: Department of Psychiatry, University of Vermont; 1991. [Google Scholar]
- Achenbach TM. Manual for the Young Adult Self Report and Young Adult Behavior Checklist. Burlington, VT: Department of Psychiatry, University of Vermont; 1997. [Google Scholar]
- Achenbach TM, Rescorla LA. Manual for ASEBA School-Age Forms & Profiles. Burlington, VT: University of Vermont, Research Center for Children, Youth, & Families; 2001. [Google Scholar]
- Achenbach TM, Rescorla LA. Manual for ASEBA Adult Forms & Profiles. Burlington, VT: University of Vermont, Research Center for Children, Youth, & Families; 2003. [Google Scholar]
- Akaike H. A new look at the statistical model identification. IEEE Transaction on Automatic Control. 1974;19:716–723. [Google Scholar]
- Baer JS, Kivlahan DR, Marlatt GA. High-Risk Drinking Across the Transition from High-School to College. Alcoholism: Clinical and Experimental Research. 1995;19:54–61. doi: 10.1111/j.1530-0277.1995.tb01472.x. [DOI] [PubMed] [Google Scholar]
- Barnes GM, Hoffman JH, Welte JW, Farrell MP, Dintcheff BA. Effects of parental monitoring and peer deviance on substance use and delinquency. Journal of Marriage and the Family. 2006;68:1084–1104. [Google Scholar]
- Barnow S, Lucht M, Freyberger HJ. Correlates of aggressive and delinquent conduct problems in adolescence. Aggressive Behavior. 2005;31:24–39. [Google Scholar]
- Barrett JC, Fry B, Maller J, Daly MJ. Haploview: analysis and visualization of LD and haplotype maps. Bioinformatics. 2005;21:263–265. doi: 10.1093/bioinformatics/bth457. [DOI] [PubMed] [Google Scholar]
- Belsky J, Jonassaint C, Pluess M, Stanton M, Brummett B, Williams R. Vulnerability genes or plasticity genes? Molecular Psychiatry. 2009;14:746–754. doi: 10.1038/mp.2009.44. [DOI] [PMC free article] [PubMed] [Google Scholar]
- Benjamini Y, Hochberg Y. Controlling the False Discovery Rate - A Practical and Powerful Approach to Multiple Testing. Journal of the Royal Statistical Society Series B-Methodological. 1995;57:289–300. [Google Scholar]
- Biological Psychiatry. Genetic Association Studies. Guide for Authors. 2009 April 8; Retrieved October 8, 2009, from http://www.elsevier.com/framework_products/promis_misc/biopsy_gfa.pdf.
- Bongers IL, Koot HM, van der Ende J, Verhulst FC. Developmental trajectories of externalizing behaviors in childhood and adolescence. Child Development. 2004;75:1523–1537. doi: 10.1111/j.1467-8624.2004.00755.x. [DOI] [PubMed] [Google Scholar]
- Brendgen M, Vitaro F, Dionne G, Boivin M, Bukowski WM, Tremblay RE, et al. Linkages between children’s and their friends’ social and physical aggression: Evidence for a gene-environment interaction? Child Development. 2008;79:13–29. doi: 10.1111/j.1467-8624.2007.01108.x. [DOI] [PubMed] [Google Scholar]
- Button TM, Corley RP, Rhee SH, Hewitt JK, Young SE, Stallings MC. Delinquent peer affiliation and conduct problems: A twin study. Journal of Abnormal Psychology. 2007;116:554–564. doi: 10.1037/0021-843X.116.3.554. [DOI] [PubMed] [Google Scholar]
- Cairns RB, McGuire AM, Gariepy J-L. Developmental behavior genetics: Fusion, correlated constraints, and timing. In: Hay DF, Angold A, editors. Precursors and causes in development and psychopathology. Oxford, England: John Wiley & Sons; 1993. pp. 87–122. [Google Scholar]
- Capaldi DM, Dishion TJ, Stoolmiller M, Yoerger K. Aggression toward female partners by at-risk young men: The contribution of male adolescent friendships. Developmental Psychology. 2001;37:61–73. [PubMed] [Google Scholar]
- Casey KF, Beninger RJ, Busto U, Tartar RE, Leyton M. The 30th Annual Meeting of the Canadian College of Neuropsychopharmacology. Symposium # 7: Addiction endophenotypes: The transition from vulnerability to disease. Neurophysiological endophenotypes related to CNS disinhibition (A. Chen) Journal of Psychiatry & Neuroscience. 2007;32:online pages 1–12. http://www.cma.ca/multimedia/staticContent/HTML/N0/I2/jpn/vol-32/issue-6/pdf/pg439a.pdf. [Google Scholar]
- Dick DM. Identification of genes influencing a spectrum of externalizing psychopathology. Current Directions in Psychological Science. 2007;16:331–335. [Google Scholar]
- Dick DM, Agrawal A, Wang JC, Hinrichs AL, Bertelsen S, Bucholz K, et al. Alcohol dependence with comorbid drug dependence: Genetic and phenotypic associations suggest a more severe form of the disorder with stronger genetic contribution to risk. Addiction. 2007a;102:1131–1139. doi: 10.1111/j.1360-0443.2007.01871.x. [DOI] [PubMed] [Google Scholar]
- Dick DM, Aliev F, Wang JC, Grucza RA, Schuckit M, Kuperman S, et al. Using dimensional models of externalizing psychopathology to aid in gene identification. Archives of General Psychiatry. 2008;65:310–318. doi: 10.1001/archpsyc.65.3.310. [DOI] [PubMed] [Google Scholar]
- Dick DM, Jones K, Saccone N, Hinrichs AL, Wang JC, Goate A, et al. Endophenotypes successfully lead to gene identification: Results from the Collaborative Study on the Genetics of Alcoholism. Behavior Genetics. 2006;36:112–126. doi: 10.1007/s10519-005-9001-3. [DOI] [PubMed] [Google Scholar]
- Dick DM, Latendresse SJ, Lansford JE, Budde JP, Goate A, Dodge KA, et al. The role of GABRA2 in trajectories of externalizing behavior across development and evidence of moderation by parental monitoring. Archives of General Psychiatry. 2009;66:649–657. doi: 10.1001/archgenpsychiatry.2009.48. [DOI] [PMC free article] [PubMed] [Google Scholar]
- Dick DM, Pagan JL, Holliday C, Viken R, Pulkkinen L, Kaprio J, et al. Gender differences in friends’ influences on adolescent drinking: A genetic epidemiological study. Alcoholism: Clinical and Experimental Research. 2007b;31:2012–2019. doi: 10.1111/j.1530-0277.2007.00523.x. [DOI] [PubMed] [Google Scholar]
- Dick DM, Pagan JL, Viken R, Purcell S, Kaprio J, Pulkkinen L, et al. Changing Environmental Influences on Substance Use Across Development. Twin Research and Human Genetics. 2007c;10:315–326. doi: 10.1375/twin.10.2.315. [DOI] [PMC free article] [PubMed] [Google Scholar]
- Dishion TJ, Capaldi D, Spracklen KM, Li FZ. Peer Ecology of Male-Adolescent Drug-Use. Development and Psychopathology. 1995;7:803–824. [Google Scholar]
- Englund MM, Egeland B, Olivia EM, Collins AC. Childhood and adolescent predictors of heavy drinking and alcohol use disorders in early adulthood: A longitudinal developmental analysis. Addiction. 2008;103:23–35. doi: 10.1111/j.1360-0443.2008.02174.x. [DOI] [PMC free article] [PubMed] [Google Scholar]
- Eysenck HJ. Personality and the biosocial model of antisocial and criminal behavior. In: Raine A, Brennan P, Farrington DP, Mednick SA, editors. Biosocial Bases of Violence. New York: Plenum; 1997. pp. 21–38. [Google Scholar]
- Farrington DP. Early predictors of adolescent aggression and adult violence. Violence and Victims. 1989;4:79–100. [PubMed] [Google Scholar]
- Fergusson DM, Horwood LJ, Ridder EM. Conduct and attentional problems in childhood and adolescence and later substance use, abuse and dependence: Results of a 25-year longitudinal study. Drug and Alcohol Dependence. 2007;88:S14–S26. doi: 10.1016/j.drugalcdep.2006.12.011. [DOI] [PubMed] [Google Scholar]
- Fromme K. Peer influence on social drinking. Bulletin of the Society of Psychologists in Addictive Behaviors. 1983;2:50–53. [Google Scholar]
- Gao XY, Becker LC, Becker DM, Starmer JD, Province MA. Avoiding the High Bonferroni Penalty in Genome-Wide Association Studies. Genetic Epidemiology. 2010;34:100–105. doi: 10.1002/gepi.20430. [DOI] [PMC free article] [PubMed] [Google Scholar]
- Gottlieb G. A developmental psychobiological systems view: Early formulation and current status. In: Oyama S, Griffiths PE, Gray RD, editors. Cycles of contingency: Developmental systems and evolution. Cambridge, MA: The MIT Press; 2001. pp. 41–54. [Google Scholar]
- Hedrick P, Kumar S. Mutation and linkage disequilibrium in human mtDNA. European Journal of Human Genetics. 2001;9:969–972. doi: 10.1038/sj.ejhg.5200735. [DOI] [PubMed] [Google Scholar]
- Helgadottir A, Thorleifsson G, Manolescu A, Gretarsdottir S, Blondal T, Jonasdottir A, et al. A common variant on chromosome 9p21 affects the risk of myocardial infarction. Science. 2007;316:1491–1493. doi: 10.1126/science.1142842. [DOI] [PubMed] [Google Scholar]
- Heutink P, Oostra BA. Gene finding in genetically isolated populations. Human Molecular Genetics. 2002;11:2507–2515. doi: 10.1093/hmg/11.20.2507. [DOI] [PubMed] [Google Scholar]
- Hicks BM, Blonigen DM, Kramer MD, Krueger RF, Patrick CJ, Iacono WG, et al. Gender differences and developmental change in externalizing disorders from late adolescence to early adulthood: A longitudinal twin study. Journal of Abnormal Psychology. 2007;116:433–447. doi: 10.1037/0021-843X.116.3.433. [DOI] [PMC free article] [PubMed] [Google Scholar]
- Hicks BM, Krueger RF, Iacono WG, McGue M, Patrick CJ. Family transmission and heritability of externalizing disorders: A twin-family study. Archives of General Psychiatry. 2004;61:922–928. doi: 10.1001/archpsyc.61.9.922. [DOI] [PubMed] [Google Scholar]
- Jones KA, Porjesz B, Almasy L, Bierut L, Dick D, Goate A, et al. A cholinergic receptor gene (CHRM2) affects event-related oscillations. Behavior Genetics. 2006;36:627–639. doi: 10.1007/s10519-006-9075-6. [DOI] [PubMed] [Google Scholar]
- Jones KA, Porjesz B, Almasy L, Bierut L, Goate A, Wang JC, et al. Linkage and linkage disequilibrium of evoked EEG oscillations with CHRM2 receptor gene polymorphisms: Implications for human brain dynamics and cognition. International Journal of Psychophysiology. 2004;53:75–90. doi: 10.1016/j.ijpsycho.2004.02.004. [DOI] [PubMed] [Google Scholar]
- Jung T, Wickrama KAS. An introduction to latent class growth analysis and growth mixture modeling. Social and Personality Psychology Compass. 2007;1:1–9. [Google Scholar]
- Kagan J. The three faces of continuity in human development. In: Goslin DA, editor. Handbook of socialization theory and research. Chicago: Rand McNally; 1969. pp. 983–1002. [Google Scholar]
- Kagan J, Moss HB. Birth to maturity: A study in psychological development. 2. New Haven: Yale University Press; 1983. [Google Scholar]
- Kass RE, Raftery AE. Bayes Factor. Journal of the American Statistical Association. 1995;90:773–795. [Google Scholar]
- Keribin C. Consistent estimation of the order of mixture models. The Indian Journal of Statistics. 1997;62:49–66. [Google Scholar]
- Kessler RC, McGonagle KA, Zhao S, Nelson CB, Hughes M, Eshleman S, et al. Lifetime and 12-month prevalence of DSM-III-R psychiatric disorders in the United States. Results from the National Comorbidity Survey. Archives of General Psychiatry. 1994;51:8–19. doi: 10.1001/archpsyc.1994.03950010008002. [DOI] [PubMed] [Google Scholar]
- Krueger RF, Hicks BM, Patrick CJ, Carlson SR, Iacono WG, McGue M. Etiologic connections among substance dependence, antisocial behavior, and personality: modeling the externalizing spectrum. Journal of Abnormal Psychology. 2002;111:411–424. [PubMed] [Google Scholar]
- Laird RD, Pettit GS, Dodge KA, Bates JE. Best friendships, group relationships, and antisocial behavior in early adolescence. Journal of Early Adolescence. 1999;19:413–437. doi: 10.1177/0272431699019004001. [DOI] [PMC free article] [PubMed] [Google Scholar]
- Lansford JE, Criss MM, Pettit GS, Dodge KA, Bates JE. Friendship quality, peer group affiliation, and peer antisocial behavior as moderators of the link between negative parenting and adolescent externalizing behavior. Journal of Research on Adolescence. 2003;13:161–184. doi: 10.1111/1532-7795.1302002. [DOI] [PMC free article] [PubMed] [Google Scholar]
- Lo Y, Mendell N, Rubin D. Testing the number of components in a normal mixture. Biometrika. 2001;88:767–778. [Google Scholar]
- Lynam DR. Early identification of chronic offenders: Who is the fledgling psychopath? Psychological Bulletin. 1996;120:209–234. doi: 10.1037/0033-2909.120.2.209. [DOI] [PubMed] [Google Scholar]
- McArdle JJ, Epstein D. Latent growth curves within developmental structural equation models. Child Development. 1987;58:110–133. [PubMed] [Google Scholar]
- Moffitt TE. Adolescence-limited and life-course-persistent antisocial behavior: a developmental taxonomy. Psychological Review. 1993;100:674–701. [PubMed] [Google Scholar]
- Moffitt TE, Caspi A, Rutter M, Silva PA. Sex differences in antisocial behavior: Conduct disorder, delinquency, and violence in the Dunedin Longitudinal Study. Cambridge, England: Cambridge University Press; 2001. [Google Scholar]
- Muthén B, Muthén LK. Integrating person-centered and variable-centered analyses: growth mixture modeling with latent trajectory classes. Alcoholism: Clinical and Experimental Research. 2000;24:882–891. [PubMed] [Google Scholar]
- Muthén B, Shedden K. Finite mixture modeling with mixture outcomes using the EM algorithm. Biometrics. 1999;55:463–469. doi: 10.1111/j.0006-341x.1999.00463.x. [DOI] [PubMed] [Google Scholar]
- Muthén BO. Latent variable analysis: growth mixture modeling and related techniques for longitudinal data. In: Kaplan D, editor. Handbook of Quantitative Methodology for the Social Sciences. Thousand Oaks, CA: Sage Publications; 2004. pp. 345–368. [Google Scholar]
- Muthén LK, Muthén BO. Mplus (Version 5) [Computer software] Los Angeles, CA: Muthén & Muthén; 2007. [Google Scholar]
- Nagin D, Tremblay RE. Trajectories of boys’ physical aggression, opposition, and hyperactivity on the path to physically violent and nonviolent juvenile delinquency. Child Development. 1999;70:1181–1196. doi: 10.1111/1467-8624.00086. [DOI] [PubMed] [Google Scholar]
- Newman DL, Moffitt TE, Caspi A, Magdol L, Silva PA, Stanton WR. Psychiatric disorder in a birth cohort of young adults: Prevalence, comorbidity, clinical significance, and new case incidence from ages 11 to 21. Journal of Consulting and Clinical Psychology. 1996;64:552–562. [PubMed] [Google Scholar]
- Nyholt DR. A simple correction for multiple testing for single-nucleotide polymorphisms in linkage disequilibrium with each other. American Journal of Human Genetics. 2004;74:765–769. doi: 10.1086/383251. [DOI] [PMC free article] [PubMed] [Google Scholar]
- Ortiz J, Raine A. Heart rate level and antisocial behavior in children and adolescents: A meta-analysis. Journal of the American Academy of Child and Adolescent Psychiatry. 2004;43:154–162. doi: 10.1097/00004583-200402000-00010. [DOI] [PubMed] [Google Scholar]
- Pettit GS, Bates J, Dodge KA. Supportive parenting, ecological context, and children’s adjustment: A seven-year longitudinal study. Child Development. 1997;68:908–923. doi: 10.1111/j.1467-8624.1997.tb01970.x. [DOI] [PubMed] [Google Scholar]
- Plomin R, DeFries JC, Loehlin JC. Genotype-environment interaction and correlation in the analysis of human behavior. Psychological Bulletin. 1977;84:309–322. [PubMed] [Google Scholar]
- Pratt TC, Cullen FT. The empirical status of Gottfredson and Hirschi’s general theory of crime: A meta-analysis. Criminology. 2000;38:931–964. [Google Scholar]
- Pulkkinen L, Pitkänen T. A prospective study of the precursors to problem drinking in young adulthood. Journal of Studies on Alcohol. 1994;55:578–587. doi: 10.15288/jsa.1994.55.578. [DOI] [PubMed] [Google Scholar]
- Quay HC. Psychopathic Personality As Pathological Stimulation-Seeking. American Journal of Psychiatry. 1965;122:180–183. doi: 10.1176/ajp.122.2.180. [DOI] [PubMed] [Google Scholar]
- Raine A. The psychopathology of crime: Criminal behavior as a clinical disorder. San Diego, CA: Academic Press; 1993. [Google Scholar]
- Raine A. Classical conditioning, arousal, and crime: a biosocial perspective. In: Nybord H, editor. The scientific study of human nature: Tribute to Hans J Eysenck at 80. Amsterdam: Pergamon/Elsevier Science; 1997. pp. 122–141. [Google Scholar]
- Rangaswamy M, Porjesz B. Uncovering genes for cognitive (dys)function and predisposition for alcoholism spectrum disorders: A review of human brain oscillations as effective endophenotypes. Brain Research. 2008;1235:153–171. doi: 10.1016/j.brainres.2008.06.053. [DOI] [PMC free article] [PubMed] [Google Scholar]
- Scarr S, McCartney K. How people make their own environments: A theory of genotype-environment effects. Child Development. 1983;54:424–435. doi: 10.1111/j.1467-8624.1983.tb03884.x. [DOI] [PubMed] [Google Scholar]
- Schafer JL, Graham JW. Missing data: Our view of the state of the art. Psychological Methods. 2002;7:147–177. [PubMed] [Google Scholar]
- van Lier P, Boivin M, Dionne G, Vitaro F, Brendgen M, Koot H, et al. Kindergarten children’s genetic vulnerabilities interact with friends’ aggression to promote children’s own aggression. Journal of the American Academy of Child and Adolescent Psychiatry. 2007;46:1080–1087. doi: 10.1097/CHI.0b013e318067733e. [DOI] [PubMed] [Google Scholar]
- Vitaro F, Brendgen M, Tremblay RE. Influence of deviant friends on delinquency: Searching for moderator variables. Journal of Abnormal Child Psychology. 2000;28:313–325. doi: 10.1023/a:1005188108461. [DOI] [PubMed] [Google Scholar]
- Vitaro F, Brendgen M, Wanner B. Patterns of affiliation with delinquent friends during late childhood and early adolescence: Correlates and consequences. Social Development. 2005;14:82–108. [Google Scholar]
- Wachs TD. Necessary but not sufficient: The respective roles of single and multiple influences on individual development. Washington, DC: American Psychological Association; 2000. [Google Scholar]
- Wakefield J. A Bayesian measure of the probability of false discovery in genetic epidemiology studies. American Journal of Human Genetics. 2007;81:208–227. doi: 10.1086/519024. [DOI] [PMC free article] [PubMed] [Google Scholar]
- Wang JC, Hinrichs AL, Stock H, Budde J, Allen R, Bertelsen S, et al. Evidence of common and specific genetic effects: Association of the muscarinic acetylcholine receptor M2 (CHRM2) gene with alcohol dependence and major depressive syndrome. Human Molecular Genetics. 2004;13:1903–1911. doi: 10.1093/hmg/ddh194. [DOI] [PubMed] [Google Scholar]
- Wang M, Bodner TE. Growth mixture modeling: Identifying and predicting unobserved subpopulations with longitudinal data. Organizational Research Methods. 2007;10:635–656. [Google Scholar]
- Ziegler A, König IR, Thompson JR. Biostatistical aspects of genome-wide association studies. Biometrical Journal. 2008;50:8–28. doi: 10.1002/bimj.200710398. [DOI] [PubMed] [Google Scholar]