

Abstract
Transthyretin (TTR) is a largely β-sheet serum protein responsible for transporting thyroxine and vitamin A. TTR is found in amyloid deposits of patients with senile systemic amyloidosis. TTR mutants lead to familial amyloidotic polyneuropathy and familial amyloid cardiomyopathy, with an earlier age of onset. Studies of amyloid fibrils of familial amyloidotic polyneuropathy mutant TTR suggest a structure similar to the native state with only a simple opening of a β-strand-loop-strand region exposing the two main β-sheets of the protein for fibril elongation. However, we find that the wild-type TTR sequence forms amyloid fibrils that are considerably different from the previously suggested amyloid structure. Using protease digestion with mass spectrometry, we observe the amyloid core to be primarily composed of the C-terminal region, starting around residue 50. Solid-state NMR measurements prove that TTR differs from other pathological amyloids in not having an in-register parallel β-sheet architecture. We also find that the TTR amyloid is incapable of binding thyroxine as monitored by either isothermal calorimetry or 1,8-anilinonaphthalene sulfonate competition. Taken together, our experiments are consistent with a significantly different configuration of the β-sheets compared to the previously suggested structure.
Introduction
Senile systemic amyloidosis (SSA) results from large amyloid deposits primarily within the heart, but also in the kidneys, liver, and muscles (1, 2). These amyloid deposits are composed mainly of transthyretin (TTR) (3, 4), a serum protein that transports thyroid hormone (thyroxine, T4) and vitamin A (5). Mutations within TTR lead to earlier onset of amyloid diseases: familial amyloidotic polyneuropathy (FAP) is a consequence of a V30M substitution and familial amyloid cardiomyopathy mainly results from either V122I or L55P mutations (2). TTR is a 55 kDa tetramer folded as a dimer of dimers (Fig. 1 A). Each monomer contains eight β-strands located within the 127 amino acid protein as follows; A (11–19), B (23–36), C (40–49), D (53–55), E (67–74), F (91–97), G (104–112), and H (114–123) (6, 7). Only a very short α-helix is present from residues 76 to 82 (Fig. 1 B). Within a monomer the strands are arranged into two sheets consisting of CBEF and DAGH. The C and D strands fold over the main core region of the protein, with the D strand followed by a large loop composed of 11 residues (56–66) (6, 7). The dimer is connected though antiparallel arrangements of the F and F′ strands and of the H and H′ strands (note that strands on successive monomers are denoted with ′, ″, etc.) (Fig. 1 B).
Figure 1.
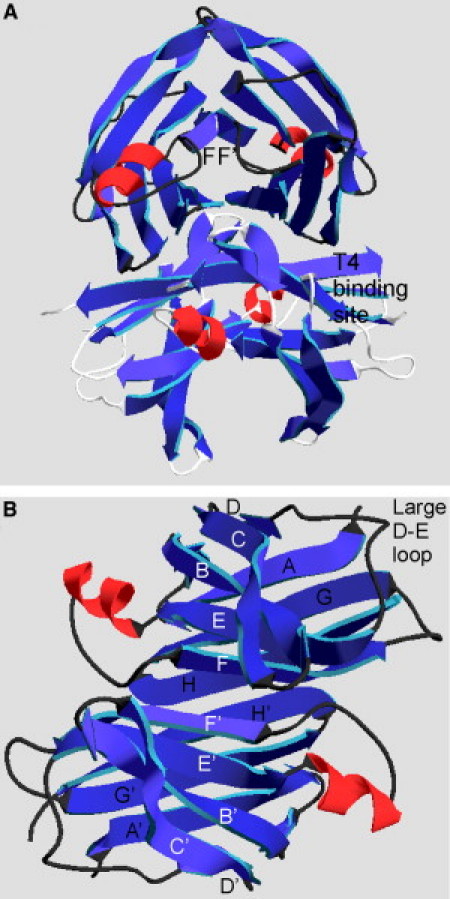
Native TTR three-dimensional structure. (A) TTR exists as tetramer of identical subunits forming a dimer of dimers. Each monomer has two different interfaces with two other monomers. The thyroxine (T4) binding site is indicated on the side of the tetramer along the A, G, H strands. (B) View of a normal dimer revealing that the monomers dimerize through antiparallel interactions of F and F′ strands and the H and H′ strands. This view led to the notion of the C strand to D strand loop opening allowing for elongation to form the amyloid. This figure was generated using PDB entry 1F41 (7) and the program Swiss PdbViewer version 4.
The structure of TTR within the amyloid fibril (the disease form) has not yet been solved. An early report, examining cross sections of amyloid material extracted from patients with FAP by electron microscopy, found the diameter of the fibrils to be 13 nm with a fourfold symmetry (8). Each protofilament measured 4 to 5 nm across, arranged around a central hollow core (8). Further x-ray fiber diffraction analysis of the FAP extracted material pointed to a twisted β-sheet model of amyloid structure (9). The diffraction pattern revealed an 11.5 nm repeat, which was interpreted as a repeating unit of 24 β-strands. This led to a proposed model with six of the native TTR β-strands, AGH and BEF forming an AGHH′G′A′ and BEFF′E′B′ structure, repeating with a fourfold screw axis (9). The AGH and BEF strands were assumed to be in the essentially native arrangement, but with the strand orientation altered to make them perpendicular to the filament long axis. This implied that the C and D strands fold away from the two main β-sheets, opening this interface to allow for elongation and fibril formation with the B and F strands as the interacting edge strands for one sheet and A and H for the other (Fig. 1 B). Because FF′ and HH′ are interfaces in the native dimer, this model suggests that the fibrils can be built from dimeric building blocks (9). More recent electron paramagnetic resonance studies, using specific cysteine mutations and electron spin labels, supported this proposed structure without the V30M mutation (10, 11).
Here, we have studied the amyloid fibrils generated from wild-type (WT) TTR, and present evidence that it may form a substantially different structure than what has been reported with mutated TTR sequences.
Materials and Methods
Protein expression
Transthyretin-His6 was expressed, labeled, and purified from BL21-CodonPlus (CD3) RIPL cells as previously described (12). Absorbance measurements at 280 nm of the eluted fractions from the Ni-NTA column were used to determine which fractions to pool for dialysis. Pooled fractions (6 ml) were dialyzed twice against 4 l of 10 mM phosphate pH 8.0, 1 mM EDTA, 1 mM DTT at 4°C. TTR concentration was determined using absorbance at 280 nm and an extinction coefficient of 7.76 × 10⁴ M−1 cm−1 (13). For solid-state NMR measurements, TTR samples were prepared with 13C labeling of backbone carbonyl sites of Ile, Phe, or Tyr residues (1-13C-Ile-TTR, 1-13C-Phe-TTR, and 1-13C-Tyr-TTR).
TTR amyloid fibril generation
TTR at 1 mg/ml in 50 mM sodium acetate pH 4 was incubated without shaking at 37°C for at least six months, conditions identical to those used by Serag et al. (10, 11). Before use, amyloid samples were centrifuged at 12,000 × g for 5 min. The supernatant was removed and the fibril pellet was washed and centrifuged twice with 20 mM phosphate, 150 mM NaCl, and 0.1% Tween 20 pH 7.2, and then resuspended to desired concentrations with 50 mM sodium acetate pH 4.
Protease digestion
In duplicate, 1 μM native TTR or TTR amyloid fibrils were digested in a total volume of 20 μl in 50 mM ammonium bicarbonate pH 7.8, 100 mM CaCl2 for 24 h. Digestions with 200–20 ng Proteinase K (Invitrogen, Carlsbad, CA), 2–200 ng trypsin (Sigma, St. Louis, MO), and 2–200 ng Chymotrypsin (Sigma) were carried out at 37°C, whereas 20°C digestion was used with 2–200 ng Glu-C (Princeton Separations, Adelphia, NJ). To stop digestions, samples were treated with 5 μl 99% Trifluoro acetic acid. Samples were lyophilized and either resuspended with loading dye for electrophoresis on NuPAGE Bis-Tris 4–12% gradient gels using NuPAGE MES running buffer (Invitrogen), or with 5% acetic acid for mass spectrometry with an HP series 1100 MSD LC/MS. Data analysis was performed using HP ChemStation Rev. A.05.01 (Hewlett Packard, Palo Alto,CA). Calculated masses for the peptide fragments were obtained using the FindPept tool available on the Expasy website (http://web.expasy.org/findpept/), with the settings [M+H]+, average and 2 dalton mass tolerance.
Electron microscopy
The TTR amyloid fibril suspension was adsorbed to a carbon-coated copper grid for 3 min, washed briefly with H2O, stained for 3 min with 1% phosphotungstic acid (Sigma) pH 4.3, blotted, and air dried. The stained samples were examined with an FEI Morgagni transmission electron microscope (FEI, Hillsboro, OR) operating at 80 kV.
Thioflavin T fluorescence
A fivefold molar excess of Thioflavin T was added to 1 μM TTR samples or 1 μM bovine serum albumin for 30 min at room temperature before analysis with a PTI spectrophotometer (PTI, Birmingham, NJ) using a 1 ml cuvette. Emission spectra were collected from 460 to 560 nm using 450 nm excitation. The area under the peak from 475 to 495 nm was integrated and the mean with standard deviation was plotted for five independent experiments.
Solid-state NMR
One-dimensional (1D) NMR spectra and 13C-13C dipolar recoupling data, using the PITHIRDS-CT method (14), were acquired on an InfinityPlus spectrometer (Varian, Lexington, MA) operating at 9.39 T (100.4 MHz 13C NMR frequency), using a Varian 3.2 mm magic-angle spinning (MAS) NMR probe. Native TTR samples (1 mg/ml) were dialyzed in 4 l of water at room temperature for 2 h and lyophilized. Amyloid TTR samples (1 mg/ml) were washed with water and centrifuged at 5000 × g twice, lyophilized, and packed in thick-wall 3.2 mm diameter MAS rotors. Samples were rehydrated with 5 μl water. Conditions for PITHIRDS-CT measurements were as previously described (14), with pulsed spin locking during detection for improved signal-to-noise (15). MAS frequencies were 20.00 kHz. 1H decoupling fields were 110 kHz. 13C T2 relaxation values for each carbonyl-labeled sample were measured under PITHIRDS-CT conditions by varying the constant-time recoupling period of the PITHIRDS-CT sequence while keeping the effective recoupling time equal to zero (14); the constant-time period was adjusted so that carbonyl signals at zero effective recoupling time were at least 25% of the signals in a simple 1D spectrum. Raw PITHIRDS-CT data were corrected as described (12) for the 1.1% natural abundance 13C at unlabeled carbonyl sites.
Isothermal calorimetry
L-Thyroxine sodium salt (T4) (Sigma) was dissolved in 10 mM sodium phosphate, 100 mM KCl, 1 mM EDTA pH 8.0 to 50 μM, determined using absorbance at 325 nm and an extinction coefficient of 6.18 × 10³ M−1 cm−1(16). One μM TTR samples were prepared in the same buffer and all samples were dialyzed overnight together at room temperature in the same buffer. Measurements were obtained using MicroCal iTC200 (Piscataway, NJ) and data were analyzed using Origin version 7. Raw data were corrected by subtraction of controls without protein.
Fluorescent ANS competition
L-Thyroxine sodium salt (Sigma) was dissolved in ethanol to make a 590 μM stock solution. 1,8-anilinonaphthalene sulfonate (ANS) (Sigma) was dissolved in dimethyl sulfoxide and the 100 mM stock concentration was determined using absorbance at 350 nm and an extinction coefficient of 4.95 × 10³ M−1 cm−1(16). A fivefold molar excess of ANS was added to 1 μM TTR samples or bovine serum albumin for 20 min before T4 addition. T4 was then mixed and samples were incubated for 45 min at room temperature before analysis in a PTI spectrophotometer using a 1 ml cuvette. Emission spectra were collected from 390 to 590 nm using 375 nm excitation. The area under the peak from 456 to 476 nm was integrated and the mean with standard deviation was plotted for five independent experiments.
Results
TTR amyloid core does not include the native B strand
Using the common acid-induced TTR amyloid fibril formation procedure (17, 18, 19), we generated long amyloid fibrils up to 1.5 μm in length (see Fig. 2 C and Fig. S1 in the Supporting Material) with significant Thioflavin T binding (Fig. S2). To determine the amino acid composition of the amyloid core, we used several different proteases including; Proteinase K, trypsin, chymotrypsin, and Glu-C. These were selected as they each cleave after different amino acids and offer an unbiased array of peptide fragments that should represent the amyloid core. Native TTR is known to be very sodium dodecyl sulfate and Proteinase K resistant (20). However, we found the amyloid to be more sensitive to protease digestion than the native state (Fig. 2). The increased sensitivity to protease may imply that part of the TTR molecule is less ordered in the amyloid state than in the native state. Following digestion of TTR amyloid with the highest amount of Proteinase K used (20 ng) fibrils were still visible using electron microscopy, but were very clumpy compared to untreated TTR amyloid fibrils (Fig. 2 D). These fibrils should contain the amyloid core peptides (lane 4, Fig. 2 B; Table 1). Using mass spectrometry to analyze the protease-treated TTR amyloid samples, we observed that the first 35 amino acids found within the A and B strands of the native TTR structure were not observed in protease-resistant fragments (Table 1), indicating that these amino acids are outside the amyloid core, and thus easily digested by the proteases. In contrast, residues in the other strands were found in protease-resistant fragments, including the short D strand. The most common core fragments among all the proteases extended from residue 50 to the C-terminal end of the protein or from around residue 50 to residue 128 with loss of the His6 tag (Table 1). Representative mass spectra of digested and undigested TTR amyloid are shown in Fig. S3. These results suggest an alternative configuration of the amyloid core that may exclude the B strands and result from the stacking of the D and E strands linked by the F strand to the stacked G and H strands. This alternative protease-resistant configuration is different from the previously proposed amyloid structure of mutant TTR, which retains the stacking of BEF and AGH strands as described previously.
Figure 2.

TTR amyloid is more protease sensitive than native TTR. (A) Electrophoresis of 24-h protease digested 1 μM native TTR at 37°C (except Glu-C at 20°C) with lane 1-200 pg Proteinase K, lane 2-20 ng Proteinase K, lane 3-2 ng trypsin, lane 4-2 ng chymotrypsin, lane 5-20 ng Glu-C, lane 6 undigested TTR, and M-SeeBlue Plus 2 prestained marker. (B) 1 μM TTR amyloid digested with lane 1 undigested TTR amyloid, lane 2-20 ng Proteinase K, lane 3-2 ng Proteinase K, lane 4-200 pg Proteinase K, lane 5-200 ng trypsin, lane 6-20 ng trypsin, lane 7-2 ng trypsin, lane 8-200 ng chymotrypsin, lane 9-20 ng chymotrypsin, lane 10-2 ng chymotrypsin, lane 11-200 pg Glu-C, lane 12-20 ng Glu-C, lane 13-2 ng Glu-C, and M-SeeBlue Plus 2 marker. (C) Electron microscopy of TTR amyloid stained with 1% phosphotungstic acid pH 4.3. (D) Electron microscopy of 200 ng Proteinase K digested TTR amyloid stained with 1% phosphotungstic acid pH 4.3.
Table 1.
Mass spectrometry results for 1 μM TTR digestions
| LC-MS major species | TTR peptide | Calculated mass | Range | Number of protected sites | |
|---|---|---|---|---|---|
| Proteinase-K | 9590 | 50–134 | 9591.528 | D strand to end | 48 |
| 200 pg | 47–132 | 9589.550 | D strand to end | 49 | |
| 35–120 | 9590.528 | C strand to H strand | 49 | ||
| 9357 | 44–128 | 9356.357 | Mid C strand to H strand | 48 | |
| 9353.7 | 51–133 | 9353.281 | D strand to end | 47 | |
| 8579.5 | 60–134 | 8580.470 | E strand to G strand | 43 | |
| 6917.2 | 73–133 | 6917.655 | End E strand to end | 32 | |
| 4155.5 | 86–128 | 4156.600 | F strand to end | 28 | |
| Trypsin | 9590.7 | 50–134 | 9591.528 | D strand to end | 6 |
| 20 ng | 6139.5 | 50–104 | 6140.709 | D strand to start G strand | 3 |
| 2516.5 | 105–127 | 2517.884 | G strand to H strand | None | |
| 3141 | 50–77 | 3142.397 | D strand to helix start | 1 | |
| Chymotrypsin | 9933.9 | 46–134 | 9934.911 | Mid C strand to end | 9 |
| 20 ng | 6802 | 46–106 | 6803.450 | Mid C strand to start G strand | 6 |
| 4799 | 1–45 | 4800.566 | Start to mid C strand | 1 | |
| Glu-C | 9273.4 | 53–134 | 9274.229 | D strand to end | 9 |
| 200 ng | 8999.7 | 56–134 | 9000.983 | E strand to end | 8 |
| 8450.3 | 53–128 | 8451.382 | D strand to H strand | 8 | |
| 8177.3 | 56–128 | 8178.137 | E strand to H strand | 7 | |
| 3789.9 | 20–55 | 3789.156 | B strand to D strand | 2 | |
| 3514.6 | 20–52 | 3515.910 | B strand to C strand | 1 | |
| Native TTR | 14054 | 5–132 | 14055.705 | A sheet to end | |
| Proteinase-K | 13896 | 7–132 | 13897.548 | A sheet to end | |
| 20 ng | 8305 | 60–132 | 8306.189 | E strand to end | |
| 37–111 | 8306.094 | C strand to G strand |
Number of protected sites is number of residues predicted to be the sites of cleavage by the indicated protease that were not cleaved.
NMR analysis rules out an in-register parallel architecture
PITHIRDS-CT measurements of 13C-13C dipole-dipole couplings (14) among labeled carbonyl sites in 1-13C-Ile-TTR, 1-13C-Phe-TTR, and 1-13C-Tyr-TTR samples were performed as a measure of distances among labeled sites in native TTR and in TTR fibrils. Each preparation was allowed to form amyloid fibrils for at least six months. 1D solid-state 13C NMR spectra (Fig. S4) showed carbonyl chemical shifts (compared to average random coil values (21)) consistent with the labeled residues being in β-sheet structure (Table 2).
Table 2.
Chemical shifts of selectively labeled TTR samples
| TTR-labeled amyloid | Carbonyl peak (ppm) | Fraction of total | Ave. random coil (ppm) |
|---|---|---|---|
| Ile-1-13C native dry | 174.6 ± 0.2 | 0.27 | 174.7 |
| 172.3 ± 0.2 | 0.73 | ||
| Ile-1-13C amyloid dry | 172.5 ± 0.2 | ||
| Ile-1-13C amyloid wet | 172.4 ± 0.2 | ||
| Phe-1-13C native | 172.3 ± 0.2 | 174.1 | |
| Phe-1-13C amyloid dry | 172.3 ± 0.2 | ||
| Phe-1-13C amyloid wet | 172.3 ± 0.2 | ||
| Tyr-1-13C native dry | 173.4 ± 0.2 | 0.73 | 174.2 |
| 171.9 ± 0.2 | 0.27 | ||
| Tyr-1-13C amyloid | 172.8 ± 0.2 |
Ratio of integrated carbonyl peak intensities for wet amyloid samples divided by dry samples was 0.72 for Phe-1-13C and 0.78 for Ile-1-13C labeled samples. Deconvolution of the carbonyl peaks for native Tyr-1-13C and Ile-1-13C samples showed two peaks as listed.
PITHIRDS-CT data for native TTR and TTR fibrils are shown in Fig. 3. None of the PITHIRDS-CT measurements on TTR fibrils show the relatively rapid signal decay (on the 30 ms timescale) observed in previous measurements on amyloid fibrils that have parallel in-register β-sheet structures (12, 22, 23). Therefore, TTR fibrils do not have a parallel in-register β-sheet structure. This is consistent with the model proposed in earlier work (10), but would also be consistent with other models, including the new model proposed in this work.
Figure 3.
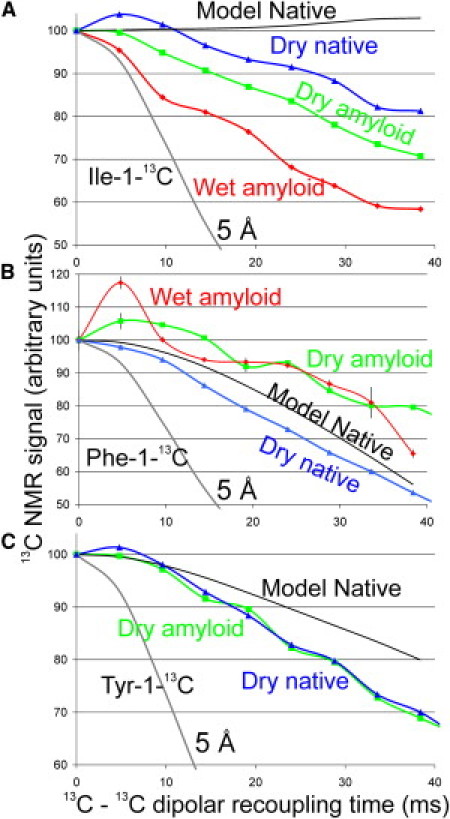
Solid-state NMR measurements of 13C-13C dipole-dipole couplings on native TTR and TTR amyloid samples, using the PITHIRDS-CT technique. Blue triangle curves are for labeled native TTR dry samples, green squares represent labeled TTR amyloid dry samples, and red diamonds represent labeled TTR amyloid wet samples. Indicated in solid black line is the total modeled decay for native TTR using PDB entry 1F41 (7). (A) Data for 1-13C-Ile-TTR show the expected slow decay for the native TTR but a more rapid decay in the amyloid state. (B and C) Data for 1-13C-Phe-TTR and 1-13C-Tyr-TTR are similar in the native and amyloid states. Simulated PITHIRDS-CT curve for a linear chain of 13C nuclei with 5 Å spacings shows the relatively rapid decay expected with an in-register parallel β-sheet structure.
Simulations of PITHIRDS-CT experiments on native TTR, using distances among 1-13C-labeled sites in one dimer from the crystal structure of a WT TTR dimer (PDB entry 1F41), predict no signal decay for native 1-13C-Ile-TTR, a decay of the total carbonyl NMR signal to ∼80% by 40 ms for native 1-13C-Tyr-TTR, and a decay to ∼56% for native 1-13C-Phe-TTR (Fig. 3 and Fig. S5). The experimental PITHIRDS-CT curves for native TTR samples are in good agreement with these simulations, except that a weak decay is observed for 1-13C-Ile-TTR, possibly due to dipole-dipole couplings between dimers that are not included in the simulations.
Experimental PITHIRDS-CT curves for TTR fibrils are similar to, but not identical to the curves for native TTR (Fig. 3). In particular, data for 1-13C-Phe-TTR decay more slowly in the amyloid form, whereas data for 1-13C-Ile-TTR decay more rapidly in the hydrated amyloid form. The difference between PITHIRDS-CT decays for dry and hydrated 1-13C-Ile-TTR fibrils may be due to the disappearance of signal contributions from certain Ile sites that become mobile upon hydration. These observations suggest rearrangements of the β-sheet structure upon conversion of native TTR to the amyloid form, but the precise nature of the rearrangements cannot be determined from these data. The BEF model proposed in earlier work, see Fig. 5 A, does not predict a reduction in Ile-Ile distances, and therefore may not be fully consistent with the PITHIRDS-CT data for 1-13C-Ile TTR fibrils. However, couplings between 13C labels in different fibrils within a fibril bundle (not depicted in Fig. 5 A) could conceivably produce the experimentally observed PITHIRDS-CT curve. The alternative model proposed in this work is consistent with the PITHIRDS-CT data, but not uniquely so.
Figure 5.
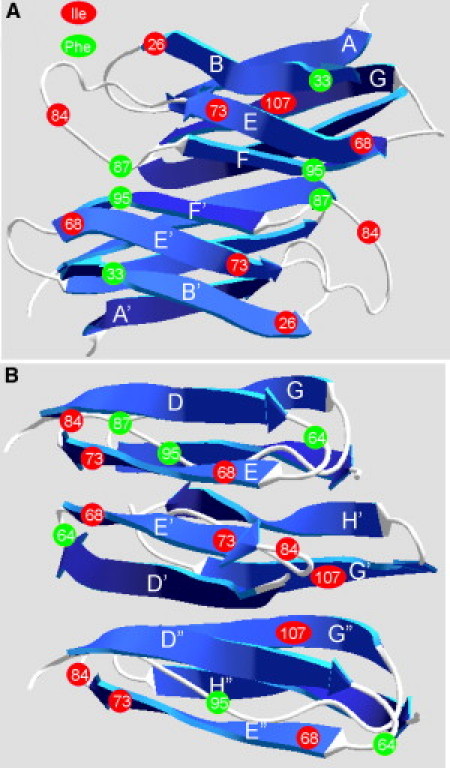
Plausible model for the TTR amyloid. (A) A representation of the previously suggested TTR amyloid model with strands B, E, and F (front) comprising one sheet and strands A, G, and H (back) comprising the other sheet of the amyloid core (10). The C and D strands have been excluded for clarity. (B) Our proposed TTR amyloid model based on protease digestion and solid-state NMR spectroscopy results. We have excluded the N-terminal region up to residue 50 for clarity. We suggest that the D strand and part of the D loop interact with the E strand, while the former F strand and helix becomes the linker to the sheet composed of the interacting G and H strands. Isoleucine residues (red) and phenylalanine residues (green) are labeled. This figure was generated using PDB entry 1F41 (7) and the program Swiss PdbViewer version 4.
No T4 binding by the TTR amyloid fibrils
To further address the loss of native conformation within the TTR amyloid we tested T4 binding directly with isothermal calorimetry, and indirectly using the common ANS competition (16). With isothermal calorimetry we observed the expected association of T4 with native TTR (Fig. 4 A). We calculated an association constant of 1.2 × 10⁸ M−1, which is in close agreement with the previously published value of 1.0 × 10⁸ M−1 (16, 24). However, we did not observe association of T4 with TTR amyloid fibrils (Fig. 4 B). Interestingly, using the indirect competition method to monitor T4 binding to TTR, we not only observed the lack of T4 competition but also an order of magnitude less ANS binding (Fig. 4 C). This may indicate that ANS is only interacting nonspecifically with exposed hydrophobic regions on the TTR amyloid. The native TTR displayed the expected ANS binding and T4 competition (Fig. 4 C).
Figure 4.
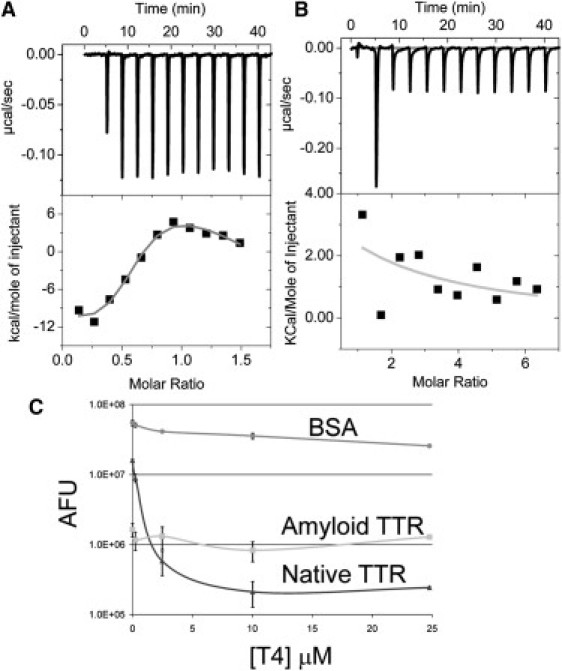
Absence of thyroxine binding to TTR amyloid. Isothermal calorimetry was used to find direct association of T4 with (A) native TTR, but not with (B) TTR amyloid. (C) The mean of five independent ANS T4 competition experiments are plotted using the standard deviation for the error bars with circle bovine serum albumin, triangle native TTR, and square for TTR amyloid. TTR amyloid binds an order of magnitude less ANS than native TTR, and this ANS is not competed off with T4.
Discussion
The full structure of TTR amyloid has yet to be determined. Our protease digestion results offer interesting insight into the core of the TTR amyloid fibrils. We find that the residues from the D strand to the H strand are included in the amyloid core. This result correlates directly with previous reports using antigenic mapping of transthyretin amyloid formed in vivo (25, 26), assuming that antibodies react with exposed antigens, and not with buried sites. Antiserum to TTR residues 24–35 (within B strand) reacted with both amyloid and native TTR (25). Antiserum against residues 110–119 (part of the H strand) was found to react less with amyloid than with native TTR, but antiserum generated to residues 115–124 (H strand) was found to react more with amyloid indicating possible exposure of the C-terminus in the amyloid (25). Interestingly, antiserum against residues 50–60 (D strand) and 90–100 (F strand) reacted less with purified TTR amyloid than with native, suggesting these regions are in the core (25). In a similar study antiserum generated to residues 41–50 (C strand) immunohistochemically labeled TTR amyloid but not native TTR within sections of tissue samples (although antibody to TTR75-84 reacted with both) (26). The 41–50 antiserum was also found to react with WT TTR amyloid and Y114C amyloid tissue sections (26). These results taken together suggest that the TTR amyloid core contains from the D strand to near the C-terminal end of the protein and not the B strand.
Most pathologic amyloids have a parallel in-register β-sheet structure, including human Aβ, α-synuclein, tau, amylin, β2 microglobulin, and the yeast prion amyloids of Ure2p, Sup35p, and Rnq1p (12, 22, 23, 27, 28, 29, 30, 31). Amyloids shown not to have the parallel in-register architecture include the functional amyloids Pmel 17, involved in vertebrate melanin biogenesis, curli (CsgA) of Escherichia coli involved in adhesion and biofilm formation, and the [Het-s] functional prion of Podospora anserina (32, 33, 34). An in-register parallel structure would result in a distance of 4.8 Å between 13C labels in our TTR amyloid samples, which would produce relatively rapid signal decay in PITHIRDS-CT measurements. The results in Fig. 3 rule out an in-register β-sheet structure for TTR fibrils, as signal decays are much slower than expected for 4.8 Å 13C-13C spacings, and no detectable components showed rapid decay. Taken together, our data indicate that residues 26, 33, 44, 64, 68, 69, 73, 78, 84, 87, 95, 105, 107, 114, and 116 are not in-register.
PITHIRDS-CT data for 1-13C-Ile TTR fibrils in Fig. 3 A indicate 13C-13C distances of ∼7 Å (which would produce a signal decay to ∼75% in 30 ms, according to simulations). Such distances among Ile carbonyls can be achieved with the schematic structural model in Fig. 5 B. Although this model is by no means uniquely determined by the PITHIRDS-CT data, it is consistent with both the PITHIRDS-CT data and the protease digestion data. The model in Fig. 5 B pairs two E strands and two G strands as the edge strands of the sheets, bringing Ile-68 (start E strand) and Ile-73 (end of E strand) close together in paired E strands, and Ile-107 (center of G strand) close in paired G strands.
The previously proposed TTR amyloid model (Fig. 5 A), assumes a greater conservation of native TTR structure, with the amyloid core composed of the B, E, and F strands (10). Using cysteine mutations and electron spin labels, Serag et al. were only able to obtain seven mutants that could form amyloid fibrils. Serag et al. present electron paramagnetic resonance data for spin labels located at sites 29, 31, 33, 40, and 46, which are primarily centered on the B strand (29, 31, and 33) and C strand (40 and 46) (10). It is possible that only these modified TTRs formed amyloid fibrils because these regions are outside the amyloid core, in accord with our protease digestion results and previously shown exposed TTR amyloid epitopes (25, 26). Furthermore, multiple mass spectrometric analyses of the TTR isolated from tissue deposits have found C-terminal fragments that start on and around residue 46 (4, 35, 36). In our model (Fig. 5 B) the N-terminal region is outside the core of the amyloid fibril and more susceptible to degradation, thus accounting for these observed fragments. Alternatively, the previous model may simply represent a distinct amyloid form from that in our experiments.
Interestingly, recent antibody and mass spectroscopic studies of amyloid from patients suffering from SSA and FAP have found distinct structural patterns (37, 38, 39). Most of those with the mutant V30M (FAP) have fibrils composed of full-length TTR, denoted fibril type B (38), whereas individuals with SSA with the WT TTR sequence, and a minority of FAP patients, have fibrils composed mainly of residues 50–127, the C-terminal fragment, denoted fibril type A (37, 38, 39). Many earlier structural studies of TTR amyloid used mutant forms, mainly the V30M mutation (8, 9), and may represent fibril type B, whereas we examined amyloid of WT TTR, representing fibril type A, thus explaining why we arrive at different models (Fig. 5). An early analysis of clinical material from a V122I TTR patient also showed cleavage after residue 48 (40).
Cardoso et al. (41) determined the mass-per-length (MPL) for amyloid fibrils formed from both WT TTR and L55P mutant protein. Interestingly, they report two populations for WT TTR, with MPL values of 9.5 and 14 kDa/nm, whereas the L55P mutation had a major population of 13.7 kDa/nm (41). Our model (Fig. 5 B) uses this information, and is constructed to give an MPL value of ∼14 kDa/nm (138 kDa molecular mass divided by twice the 0.48 nm β-strand spacing in a cross-β-fibril structure), which correlates with the results of Cardoso et al. The model of Serag et al. (10) predicts an MPL value consistent with the observed 9.5 kDa/nm population. Although Cordoso et al. (41) interpret the multiple MPL values as due to different numbers of protofilaments comprising each fibril, we suggest that the two main values for WT TTR fibrils may be due to the differing numbers of β-strands per monomer along the fibril long axis in two distinct fibril structures: two β-strands per monomer for our TTR fibrils and three for those studied by Serag et al.
T4 binds TTR within the inner channel parallel to the crystallographic twofold axis along contacts in the A, G, and H strands (42, 43, 44). Although two T4 molecules can bind the TTR tetramer, there is negative cooperativity between the sites leading to one major hormone binding site (16, 24, 42). Furthermore, it has been shown recently that Glu-54 (D strand) is not crucial for T4 binding, as a Glu-54-Gly mutant was found to have similar dissociation constant as WT and displayed higher association rate (45). For native TTR we obtained an association constant similar to that previously published (16, 24), however we did not observe T4 binding to TTR amyloid. If the amyloid state maintained a near native conformation, then one might expect some T4 binding. It is not uncommon for the amyloid state of a protein to retain a native state activity. For example, the amyloid URE3 has been shown to maintain the same peroxidase activity as the native Ure2 protein (46). Similarly, the SOD1 aggregate has been shown to have higher activity than the native protein (47). TTR amyloid does not maintain its T4 binding, and displays a dramatic reduction in ANS association, thus the amyloid conformation must be significantly different from the native state.
Taken together, our results suggest that the TTR amyloid conformation is significantly different than the native state and offers a different model for the arrangement of the β-strands within the amyloid structure.
Acknowledgments
We thank Dr. Frank Brown (National Institute of Biomedical Imaging and Bioengineering, National Institutes of Health) for allowing us to use the iTC instrument and Dr. Eric Anderson (National Institute of Diabetes and Digestive and Kidney Diseases, National Institutes of Health) for allowing us to use the mass spectrometer.
This work was supported by the Intramural Program of the National Institute of Diabetes and Digestive and Kidney Diseases.
Editor: Elizabeth Rhoades.
Footnotes
Five figures are available at http://www.biophysj.org/biophysj/supplemental/S0006-3495(11)01198-2.
Supporting Material
References
- 1.Pitkänen P., Westermark P., Cornwell G.G., 3rd Senile systemic amyloidosis. Am. J. Pathol. 1984;117:391–399. [PMC free article] [PubMed] [Google Scholar]
- 2.Hou X., Aguilar M.I., Small D.H. Transthyretin and familial amyloidotic polyneuropathy. Recent progress in understanding the molecular mechanism of neurodegeneration. FEBS J. 2007;274:1637–1650. doi: 10.1111/j.1742-4658.2007.05712.x. [DOI] [PubMed] [Google Scholar]
- 3.Costa P.P., Figueira A.S., Bravo F.R. Amyloid fibril protein related to prealbumin in familial amyloidotic polyneuropathy. Proc. Natl. Acad. Sci. USA. 1978;75:4499–4503. doi: 10.1073/pnas.75.9.4499. [DOI] [PMC free article] [PubMed] [Google Scholar]
- 4.Westermark P., Sletten K., Johansson B., Cornwell G.G., 3rd Fibril in senile systemic amyloidosis is derived from normal transthyretin. Proc. Natl. Acad. Sci. USA. 1990;87:2843–2845. doi: 10.1073/pnas.87.7.2843. [DOI] [PMC free article] [PubMed] [Google Scholar]
- 5.Monaco H.L., Mancia F., et al. Coda A. Crystallization of the macromolecular complex transthyretin-retinol-binding protein. J. Mol. Biol. 1994;244:110–113. doi: 10.1006/jmbi.1994.1708. [DOI] [PubMed] [Google Scholar]
- 6.Blake C.C., Geisow M.J., et al. Rérat C. Structure of prealbumin: secondary, tertiary and quaternary interactions determined by Fourier refinement at 1.8 A. J. Mol. Biol. 1978;121:339–356. doi: 10.1016/0022-2836(78)90368-6. [DOI] [PubMed] [Google Scholar]
- 7.Hörnberg A., Eneqvist T., et al. Sauer-Eriksson A.E. A comparative analysis of 23 structures of the amyloidogenic protein transthyretin. J. Mol. Biol. 2000;302:649–669. doi: 10.1006/jmbi.2000.4078. [DOI] [PubMed] [Google Scholar]
- 8.Serpell L.C., Sunde M., et al. Blake C.C. Examination of the structure of the transthyretin amyloid fibril by image reconstruction from electron micrographs. J. Mol. Biol. 1995;254:113–118. doi: 10.1006/jmbi.1995.0604. [DOI] [PubMed] [Google Scholar]
- 9.Blake C., Serpell L. Synchrotron x-ray studies suggest that the core of the transthyretin amyloid fibril is a continuous beta-sheet helix. Structure. 1996;4:989–998. doi: 10.1016/s0969-2126(96)00104-9. [DOI] [PubMed] [Google Scholar]
- 10.Serag A.A., Altenbach C., et al. Yeates T.O. Arrangement of subunits and ordering of beta-strands in an amyloid sheet. Nat. Struct. Biol. 2002;9:734–739. doi: 10.1038/nsb838. [DOI] [PubMed] [Google Scholar]
- 11.Serag A.A., Altenbach C., et al. Yeates T.O. Identification of a subunit interface in transthyretin amyloid fibrils: evidence for self-assembly from oligomeric building blocks. Biochemistry. 2001;40:9089–9096. doi: 10.1021/bi010655s. [DOI] [PubMed] [Google Scholar]
- 12.Wickner R.B., Dyda F., Tycko R. Amyloid of Rnq1p, the basis of the [PIN+] prion, has a parallel in-register beta-sheet structure. Proc. Natl. Acad. Sci. USA. 2008;105:2403–2408. doi: 10.1073/pnas.0712032105. [DOI] [PMC free article] [PubMed] [Google Scholar]
- 13.van Jaarsveld P.P., Edelhoch H., et al. Robbins J. The interaction of human plasma retinol-binding protein and prealbumin. J. Biol. Chem. 1973;248:4698–4705. [PubMed] [Google Scholar]
- 14.Tycko R. Symmetry-based constant-time homonuclear dipolar recoupling in solid state NMR. J. Chem. Phys. 2007;126:064506. doi: 10.1063/1.2437194. [DOI] [PubMed] [Google Scholar]
- 15.Petkova A.T., Tycko R. Sensitivity enhancement in structural measurements by solid state NMR through pulsed spin locking. J. Magn. Reson. 2002;155:293–299. doi: 10.1006/jmre.2002.2519. [DOI] [PubMed] [Google Scholar]
- 16.Nilsson S.F., Rask L., Peterson P.A. Studies on thyroid hormone-binding proteins. II. Binding of thyroid hormones, retinol-binding protein, and fluorescent probes to prealbumin and effects of thyroxine on prealbumin subunit self association. J. Biol. Chem. 1975;250:8554–8563. [PubMed] [Google Scholar]
- 17.Colon W., Kelly J.W. Partial denaturation of transthyretin is sufficient for amyloid fibril formation in vitro. Biochemistry. 1992;31:8654–8660. doi: 10.1021/bi00151a036. [DOI] [PubMed] [Google Scholar]
- 18.Lai Z., Colón W., Kelly J.W. The acid-mediated denaturation pathway of transthyretin yields a conformational intermediate that can self-assemble into amyloid. Biochemistry. 1996;35:6470–6482. doi: 10.1021/bi952501g. [DOI] [PubMed] [Google Scholar]
- 19.Zhang Q., Kelly J.W. Cys10 mixed disulfides make transthyretin more amyloidogenic under mildly acidic conditions. Biochemistry. 2003;42:8756–8761. doi: 10.1021/bi030077a. [DOI] [PubMed] [Google Scholar]
- 20.Manning M., Colón W. Structural basis of protein kinetic stability: resistance to sodium dodecyl sulfate suggests a central role for rigidity and a bias toward beta-sheet structure. Biochemistry. 2004;43:11248–11254. doi: 10.1021/bi0491898. [DOI] [PubMed] [Google Scholar]
- 21.Wishart D.S., Bigam C.G., et al. Sykes B.D. 1H, 13C and 15N random coil NMR chemical shifts of the common amino acids. I. Investigations of nearest-neighbor effects. J. Biomol. NMR. 1995;5:67–81. doi: 10.1007/BF00227471. [DOI] [PubMed] [Google Scholar]
- 22.Paravastu A.K., Leapman R.D., et al. Tycko R. Molecular structural basis for polymorphism in Alzheimer's beta-amyloid fibrils. Proc. Natl. Acad. Sci. USA. 2008;105:18349–18354. doi: 10.1073/pnas.0806270105. [DOI] [PMC free article] [PubMed] [Google Scholar]
- 23.Shewmaker F., Kryndushkin D., et al. Wickner R.B. Two prion variants of Sup35p have in-register parallel beta-sheet structures, independent of hydration. Biochemistry. 2009;48:5074–5082. doi: 10.1021/bi900345q. [DOI] [PMC free article] [PubMed] [Google Scholar]
- 24.Ferguson R.N., Edelhoch H., et al. Cahnmann H.J. Negative cooperativity in the binding of thyroxine to human serum prealbumin. Preparation of tritium-labeled 8-anilino-1-naphthalenesulfonic acid. Biochemistry. 1975;14:282–289. doi: 10.1021/bi00673a014. [DOI] [PubMed] [Google Scholar]
- 25.Gustavsson A., Engström U., Westermark P. Mechanisms of transthyretin amyloidogenesis. Antigenic mapping of transthyretin purified from plasma and amyloid fibrils and within in situ tissue localizations. Am. J. Pathol. 1994;144:1301–1311. [PMC free article] [PubMed] [Google Scholar]
- 26.Bergström J., Engström U., et al. Westermark P. Surface exposed epitopes and structural heterogeneity of in vivo formed transthyretin amyloid fibrils. Biochem. Biophys. Res. Commun. 2006;348:532–539. doi: 10.1016/j.bbrc.2006.07.140. [DOI] [PubMed] [Google Scholar]
- 27.Der-Sarkissian A., Jao C.C., et al. Langen R. Structural organization of alpha-synuclein fibrils studied by site-directed spin labeling. J. Biol. Chem. 2003;278:37530–37535. doi: 10.1074/jbc.M305266200. [DOI] [PubMed] [Google Scholar]
- 28.Margittai M., Langen R. Template-assisted filament growth by parallel stacking of tau. Proc. Natl. Acad. Sci. USA. 2004;101:10278–10283. doi: 10.1073/pnas.0401911101. [DOI] [PMC free article] [PubMed] [Google Scholar]
- 29.Jayasinghe S.A., Langen R. Identifying structural features of fibrillar islet amyloid polypeptide using site-directed spin labeling. J. Biol. Chem. 2004;279:48420–48425. doi: 10.1074/jbc.M406853200. [DOI] [PubMed] [Google Scholar]
- 30.Iwata K., Fujiwara T., et al. Goto Y. 3D structure of amyloid protofilaments of beta2-microglobulin fragment probed by solid-state NMR. Proc. Natl. Acad. Sci. USA. 2006;103:18119–18124. doi: 10.1073/pnas.0607180103. [DOI] [PMC free article] [PubMed] [Google Scholar]
- 31.Engel A., Shewmaker F., et al. Wickner R.B. Amyloid of the Candida albicans Ure2p prion domain is infectious and has an in-register parallel β-sheet structure. Biochemistry. 2011;50:5971–5978. doi: 10.1021/bi200142x. [DOI] [PMC free article] [PubMed] [Google Scholar]
- 32.McGlinchey R.P., Shewmaker F., et al. Wickner R.B. The repeat domain of the melanosome fibril protein Pmel17 forms the amyloid core promoting melanin synthesis. Proc. Natl. Acad. Sci. USA. 2009;106:13731–13736. doi: 10.1073/pnas.0906509106. [DOI] [PMC free article] [PubMed] [Google Scholar]
- 33.Shewmaker F., McGlinchey R.P., et al. Wickner R.B. The functional curli amyloid is not based on in-register parallel beta-sheet structure. J. Biol. Chem. 2009;284:25065–25076. doi: 10.1074/jbc.M109.007054. [DOI] [PMC free article] [PubMed] [Google Scholar]
- 34.Wasmer C., Lange A., et al. Meier B.H. Amyloid fibrils of the HET-s(218–289) prion form a beta solenoid with a triangular hydrophobic core. Science. 2008;319:1523–1526. doi: 10.1126/science.1151839. [DOI] [PubMed] [Google Scholar]
- 35.Westermark P., Sletten K., Olofsson B.O. Prealbumin variants in the amyloid fibrils of Swedish familial amyloidotic polyneuropathy. Clin. Exp. Immunol. 1987;69:695–701. [PMC free article] [PubMed] [Google Scholar]
- 36.Kingsbury J.S., Théberge R., et al. Connors L.H. Detailed structural analysis of amyloidogenic wild-type transthyretin using a novel purification strategy and mass spectrometry. Anal. Chem. 2007;79:1990–1998. doi: 10.1021/ac061546s. [DOI] [PubMed] [Google Scholar]
- 37.Bergström J., Gustavsson A., et al. Westermark P. Amyloid deposits in transthyretin-derived amyloidosis: cleaved transthyretin is associated with distinct amyloid morphology. J. Pathol. 2005;206:224–232. doi: 10.1002/path.1759. [DOI] [PubMed] [Google Scholar]
- 38.Ihse E., Ybo A., et al. Westermark P. Amyloid fibril composition is related to the phenotype of hereditary transthyretin V30M amyloidosis. J. Pathol. 2008;216:253–261. doi: 10.1002/path.2411. [DOI] [PubMed] [Google Scholar]
- 39.Ihse E., Suhr O.B., et al. Westermark P. Variation in amount of wild-type transthyretin in different fibril and tissue types in ATTR amyloidosis. J. Mol. Med. 2011;89:171–180. doi: 10.1007/s00109-010-0695-1. [DOI] [PMC free article] [PubMed] [Google Scholar]
- 40.Gorevic P.D., Prelli F.C., et al. Frangione B. Systemic senile amyloidosis. Identification of a new prealbumin (transthyretin) variant in cardiac tissue: immunologic and biochemical similarity to one form of familial amyloidotic polyneuropathy. J. Clin. Invest. 1989;83:836–843. doi: 10.1172/JCI113966. [DOI] [PMC free article] [PubMed] [Google Scholar]
- 41.Cardoso I., Goldsbury C.S., et al. Saraiva M.J. Transthyretin fibrillogenesis entails the assembly of monomers: a molecular model for in vitro assembled transthyretin amyloid-like fibrils. J. Mol. Biol. 2002;317:683–695. doi: 10.1006/jmbi.2002.5441. [DOI] [PubMed] [Google Scholar]
- 42.Blake C.C., Oatley S.J. Protein-DNA and protein-hormone interactions in prealbumin: a model of the thyroid hormone nuclear receptor? Nature. 1977;268:115–120. doi: 10.1038/268115a0. [DOI] [PubMed] [Google Scholar]
- 43.Wojtczak A., Luft J., Cody V. Mechanism of molecular recognition. Structural aspects of 3,3′-diiodo-L-thyronine binding to human serum transthyretin. J. Biol. Chem. 1992;267:353–357. [PubMed] [Google Scholar]
- 44.Wojtczak A., Cody V., et al. Pangborn W. Structures of human transthyretin complexed with thyroxine at 2.0 A resolution and 3′,5′-dinitro-N-acetyl-L-thyronine at 2.2 A resolution. Acta Crystallogr. D Biol. Crystallogr. 1996;52:758–765. doi: 10.1107/S0907444996003046. [DOI] [PubMed] [Google Scholar]
- 45.Miyata M., Sato T., et al. Kai H. Role of the glutamic acid 54 residue in transthyretin stability and thyroxine binding. Biochemistry. 2010;49:114–123. doi: 10.1021/bi901677z. [DOI] [PubMed] [Google Scholar]
- 46.Bai M., Zhou J.M., Perrett S. The yeast prion protein Ure2 shows glutathione peroxidase activity in both native and fibrillar forms. J. Biol. Chem. 2004;279:50025–50030. doi: 10.1074/jbc.M406612200. [DOI] [PubMed] [Google Scholar]
- 47.Gurney M.E., Pu H., et al. Siddique T. Motor neuron degeneration in mice that express a human Cu,Zn superoxide dismutase mutation. Science. 1994;264:1772–1775. doi: 10.1126/science.8209258. [DOI] [PubMed] [Google Scholar]
Associated Data
This section collects any data citations, data availability statements, or supplementary materials included in this article.