


Abstract
Photoactivation localization microscopy (PALM) is used to study the spatial distribution and diffusion of single copies of the protein Kaede in the cytoplasm of live Escherichia coli under moderate growth conditions (67 min doubling time). The spatial distribution of Kaede is uniform within the cytoplasm. The cytoplasmic radius of 380 ± 30 nm varies little from cell to cell. Single-particle tracking using 4 ms exposure times reveals negatively curved plots of mean-square displacement versus time. A detailed comparison with Monte Carlo simulations in a spherocylindrical volume shows that the curvature can be quantitatively understood in terms of free diffusion within a confining volume. The mean diffusion coefficient across cells is <DKaede> = 7.3 ± 1.1 μm2·s−1, consistent with a homotetrameric form of Kaede. The distribution of squared displacements along the long axis for individual Kaede molecules is consistent with homogeneous diffusion. However, for longer cells, a spatial map of one-step estimates of the diffusion coefficient along x suggests that diffusion is ∼20–40% faster within nucleoids than in the ribosome-rich region lying between nucleoid lobes at the cell mid-plane. Fluorescence recovery after photobleaching yielded <DFRAP> = 8.3 ± 1.6 μm2·s−1, in agreement with the single-particle tracking results.
Introduction
Subdiffraction-limit fluorescence microscopy (1, 2, 3, 4) in two dimensions enables one to locate and track single copies of specifically labeled proteins in live cells with spatial resolution on the order of 20–50 nm. Such high resolution is particularly advantageous in small bacterial cells (5, 6, 7, 8, 9) such as the rod-shaped Escherichia coli, which has a cylindrical radius of only 400 nm and length of 2–4 μm. One recent study revealed clustering of the architectural protein HU in fixed Caulobacter crescentus cells, with the clustering particularly strong in predivisional cells (8), and another study unraveled details about the stringent response mechanism in live E. coli (9). Photoactivation localization microscopy (PALM) promises a new level of quantitative insight into the spatial distribution of many types of specific components of live bacterial cells.
In this prototypical study of diffusion in live E. coli cells, we used PALM to determine the spatial distribution and diffusive properties of the photoactivatable fluorescent protein Kaede, expressed from a plasmid in the E. coli cytoplasm. Kaede is a 28 kDa β-barrel that probably exists as a homotetramer (10, 11). The spatial distribution of Kaede is uniform and fills the entire cytoplasm to high accuracy, in contrast to the results of theoretical models of globular protein segregation between nucleoids and ribosome-rich regions (12, 13). PALM also enables one to measure the radius of the cytoplasm of live E. coli to an accuracy of ∼30 nm. For hundreds of Kaede copies in each single, live cell, we measure the mean-square displacement (MSD) versus lag time (MSDi(τ)) in the axial coordinate x, the transverse coordinate y, and the two-dimensional (2D) distance coordinate . All three MSD plots are curved under our typical measurement conditions of 4 ms/frame. By comparison with Monte Carlo simulations of free diffusion in a spherocylindrical confining volume, we show that the curved MSD plots can be explained by confinement alone, without recourse to subdiffusion. Here, subdiffusion refers to any mechanism other than the finite boundaries of the cell that causes MSD plots to increase sublinearly in time (14), such as local caging effects and strong transient binding. The mean diffusion coefficient across cells is DKaede = 7.3 ± 1.1 μm2·s−1, which is a factor of 1.3 smaller than that of green fluorescent protein (GFP) under similar growth conditions.
Additional statistical tests based on higher moments of the displacements (15) are also consistent with free diffusion in a confining spherocylindrical volume. However, for long cells (∼4 μm), the spatial distribution of one-step squared x-displacements, when averaged over the transverse coordinate y and plotted versus the axial coordinate x, shows a 20–40% dip at the cell mid-plane. The longest cells also show the strongest spatial segregation of the chromosomal DNA into two lobes. The results thus suggest that Kaede diffusion is more facile within the nucleoids than in the ribosome-rich region between nucleoids. The distributions across cells of DKaede from single-particle tracking (SPT) and fluorescence recovery after photobleaching (FRAP) are similar. Finally, we describe relatively straightforward methods for extracting diffusion coefficients accurate to ±6% from curved MSDx(τ) plots for spherocylindrical geometries, without the need for Monte Carlo simulation of confinement effects.
Materials and Methods
Bacterial strains and plasmids
All experiments were performed on the E. coli strain DH5α. Kaede was expressed from a tetracycline inducible plasmid. The Kaede ORF (a gift from D. Weibel, Department of Biochemistry, University of Wisconsin-Madison) was amplified by PCR (primers, 5′-TGACTCTGCAGAGACTTGACGTTGTCC-3′ and 5′-GTGACGTCTAGAATGAGTCTGATTAAACCAG-3′) and digested by XbaI and PstI. This fragment was ligated to a similarly digested fragment of pASK-IBA3plus (Invitrogen, Carlsbad, CA). DH5α cells were transformed with the resulting plasmid (pJW2), and transformants were selected on ampicillin-containing plates.
Cell growth and preparation
E. coli cells were grown overnight with shaking at 30°C in EZ rich defined medium (EZRDM) with 100 μg/mL ampicillin (16, 17). We subsequently made subcultures of these cells by diluting the stationary phase culture at least 1:250 into 3 mL of fresh EZRDM. When the cells had grown to midlog phase (OD600 = 0.4–0.6), anhydrotetracycline was added to a final concentration of 45 nM. After 6 min of induction, the cells were centrifuged and resuspended twice in fresh EZRDM to remove the inducer. The cells were then incubated in growth medium for at least 30 min at 30°C to enable maturation of the fluorescent proteins. After induction of Kaede and resuspension of the cells in fresh growth media, the doubling time was 67 min, which is longer than the 57 min doubling time before induction. From the single-cell fluorescence intensities and volumes, we estimate the Kaede concentration in the cytoplasm to be 5 μM, which is comparable to GFP concentrations in earlier diffusion studies (16, 18). For the diffusion studies, 7 μL of cells were immobilized on poly-L-lysine-coated coverslips and sealed with nail polish. FRAP measurements and single-molecule tracking with photoactivation were carried out for no longer than 30 min after plating (16). During that time, the cells continued to grow. For studies of elongated cells treated by cephalexin, 30 μL of an overnight culture were diluted 100-fold into EZRDM and shaken at 30°C for 1 h. Cephalexin (60 μg/mL) was then added, and the culture was grown with shaking to an OD of 0.3–0.8. Kaede was expressed as described above.
Fluorescence microscopy
We acquired fluorescence images of Kaede using wide-field epifluorescence microscopy. Kaede photoswitches from a green-fluorescent state to a yellow-fluorescent state upon excitation at 405 nm. Photoactivation was carried out with a 405-nm diode laser (1–50 W/cm2 at the sample). The yellow, photoactivated state was probed by excitation by a 561 nm diode laser (3–15 kW/cm2 at the sample. In the PALM studies of single-particle localization and tracking, on average less than one copy of Kaede per cell was photoactivated from the normal green-fluorescent state to the switched yellow-fluorescent state in each laser cycle. Most of the work was carried out with a 1.49 numerical aperture (NA) objective, whose depth of focus limits SPT to a horizontal slab of ∼500 nm thickness. Some work was carried out with an NA = 1.30 objective, which evidently detects molecules over the entire ∼800 nm diameter of the cytoplasm. Movies for SPT were typically acquired at a frame rate of 234 Hz with 4.0 ms exposure time in each camera cycle. We also performed some work using a faster EMCCD camera with a 750.0 μs exposure time (1.30 kHz frame rate). Further details are provided in the Supporting Material.
Before particle tracking was performed, the images were filtered with a centroid algorithm taken from Crocker and Grier (19). Centroid fitting was preferred to point-spread-function fitting because the single-molecule images are not circularly symmetric for 4 ms frames. In addition, the centroid data are easily compared with Monte Carlo simulations of diffusion. The tracking algorithm minimizes the total squared displacement from each frame to the next. Because the mean number of activated molecules is far less than one per frame, there is essentially no ambiguity in forming trajectories from successive localizations.
Following the work of Michalet (20), we estimate the dynamical localization accuracy to be σ ∼40 nm in one dimension when using the 1.49 NA objective (Supporting Material). This includes a static contribution σ0 ∼17 nm. We collected trajectories from each cell over a period of 3–5 min (40,000–70,000 frames). In that time, we typically observed 1500–2000 single molecules whose trajectories comprised some 10,000–12,000 localizations.
Approximately 28–40% of all trajectories are longer than four localizations (three successive steps). For these trajectories, the mean length varied from 10 to 14 steps (11–15 localizations), and the longest trajectory in a cell ranged from 30 to 45 steps. For the MSD analyses, we chose to analyze only longer trajectories to improve accuracy over longer lag times. In practice, we varied the cutoff length for each cell. The lower limit on trajectory length was chosen in the range of 12–16 steps so that at least 80–100 trajectories were included for each cell. This produced high-quality MSD plots for the first several points, which was crucial for the analysis.
FRAP was carried out on the unswitched, green-fluorescent form of Kaede. Details are provided in the Supporting Material.
Monte Carlo simulation
To distinguish the effects of confinement from possible effects of subdiffusion, we carried out an extensive battery of Monte Carlo (random walk) simulations of free diffusion in spherocylindrical volumes that closely mimic the shape of the E. coli cytoplasm (21). The cell volume is characterized by two parameters: the length L of the cylindrical portion, and the common radius R of the cylindrical portion and the hemispherical endcaps. In the simulations, ∼5000 particles were started at random locations within the cell volume. Each random walk is independent of other particle positions; there are no particle-particle interactions. For each time step i, each particle chooses a displacement in each of three Cartesian directions. These displacements are chosen from a normal distribution whose standard deviation (SD) is defined by the free, three-dimensional (3D) diffusion coefficient D; that is, the MSD after time lag τ is 6Dτ and the SD of the corresponding Gaussian propagator is . Because of the fractal nature of diffusion, the product of Dτ can be in any units, which allows easy scaling of units between the experimental and simulation results. The product Dτ was always chosen so that would be <0.02 R. Test runs using = 0.002 R gave the same results. Any move that would cause a particle to go outside the cell volume was rejected and that particle waited in its original position for the next move (22, 23). Trajectories were typically calculated for 103 cycles of 100 steps each. Analysis of the trajectories from simulation was similar to the analysis of the experimental trajectories. All simulations were performed in MATLAB (The MathWorks, Natick, MA).
Results
For 22 E. coli cells in our standard growth conditions, we tracked single, photoactivated Kaede molecules in two dimensions with 4.0 ms exposure time and 234.0 Hz frame rate. An unsmoothed single-molecule image and a Kaede trajectory are shown in Fig. S1. For one representative cell, plots of MSD versus time for the coordinates x (axial dimension of the cell), y (transverse dimension), and are shown in Fig. 1. The <r2> plot is scaled by a factor of 1/2 so that the limiting slope as τ → 0 should have the value 2DKaede for all three coordinates if free diffusion holds. The plots include data from the 140 Kaede trajectories that were ≥15 steps. Steps beyond the first 15 were discarded. We calculated the MSD using internal averaging over the entire 15-step trajectory, i.e., all pairs of points separated by time lag τ were used to calculate MSDi(τ) (24). All three MSD plots typically curve downward, with MSDy showing nonlinearity at the earliest time lag, followed by MSDr and then by MSDx. The MSD plots for different cells differ significantly from each other. We carried out quantitative tests to determine how to best extract the mean diffusion coefficient for each cell, and whether subdiffusion could contribute to the curvature.
Figure 1.

MSD versus time lag τ for the coordinates x (axial dimension), y (transverse dimension), and as shown. Data include 160 trajectories of 15 steps from a single cell. Error bars are ±1 SD of the mean values. Solid lines are the least-squares fits to the equation The dotted line is a linear fit to the first three points of MSDx. Inset: Spatial distribution of all the single molecules from this cell.
Determination of the diffusion coefficient from MSD plots
The simplest way to estimate DKaede is to measure the limiting slope of MSD plots as τ → 0. For the example cell of Fig. 1, the slope of the first three points yields the estimates 4.4 μm2·s−1 from MSDr and 6.3 μm2·s−1 from MSDx. This is a serious discrepancy. The limiting slope of MSDy is not well defined for data taken at 4.3 ms per frame.
A more rigorous method for determining DKaede uses Monte Carlo simulations in a spherocylinder whose dimensions R and L are determined by the experimental spatial distribution of the Kaede locations measured by PALM. As shown in the Supporting Material, the leading and trailing edges of the spatial distributions of localized molecules along x and y enable us to obtain accurate values of R (from the y-distribution) and L + 2R (from the x-distribution). For the particular cell in Fig. 1, the best-fit values gave a total length L + 2R = 4350 ± 100 nm and a radius R = 400 ± 25 nm, which yields the cylinder length L = 3950 ± 125 nm by subtraction.
Although the length of cells varies substantially over the growth cycle, the cytoplasmic radius measured in this way is quite uniform across our unsynchronized cell population. For these growth conditions, 12 cells yielded a mean radius <R> = 380 ± 30 nm. Returning to the cell of Fig. 1, with the geometry parameters R and L now fixed, the value of DKaede in the Monte Carlo simulations is adjusted until the initial rise of the MSDx and MSDy curves is well fit over the first four points (inset of Fig. 2), as judged by eye. Fitting of MSDx and MSDy ensures a good fit to MSDr. Repeated averaging of Monte Carlo runs of 160 trajectories of 15 steps each gives a sense of the accuracy of the fitting procedure. The statistical noise is modest over these first four points, but becomes substantial at longer lag times (Fig. 2). To illustrate the statistical variability of the calculations and the sensitivity to the input value of DKaede, we show bands of outcomes (swaths in Fig. 2) for the MSDx(τ) and MSDy(τ) for assumed diffusion coefficients of 6.8 and 8.4 μm2·s−1. Based on the Monte Carlo results, our best estimate for the cell in Fig. 1 is DKaede = 7.6 ± 0.8 μm2·s−1. The uncertainty estimate takes approximate account of the sensitivity of the simulation results to all three inputs (DKaede, L, and R) plus the variability of MSD plots for short samples of confined random walks.
Figure 2.

Comparison of experimental MSD plots from Fig. 1 (circles) with those from Monte Carlo simulations of free diffusion in a spherocylinder of cylinder length L = 3.950 μm and radius R = 400 nm. Dimensions were chosen to match the spatial distribution of Kaede molecules in the cell of Fig. 1. Solid points are MSD along x and y from Fig. 1; error bars show 1 SD of the mean value. Swaths show the spread of MSD values (±1 SD of the mean) for 200 Monte Carlo runs using D = 6.8 μm2·s−1 (below data) and 8.4 μm2·s−1 (above data). Inset: Comparison of the first four experimental data for MSDx and MSDy with the spread of MSD values from the Monte Carlo simulations using D = 7.6 μm2·s−1 (gray swath).
It is impractical to measure R and L and to run a series of Monte Carlo simulations for each cell, and in many cases experimental conditions may not permit fast-enough frames with a high-enough signal/noise ratio to enable accurate extraction of D from the initial slope of MSDx. Following Anderson et al. (25), we developed a third, phenomenological method grounded in the Monte Carlo simulations. Analytical results are available for MSD(τ) for confined diffusion in the simple model problems of diffusion on a line segment (1D), within a circle (2D), and within a sphere (3D) (26). Based on these model problems, we approximate each MSDi(τ) curve as a rising single exponential function:
| (1) |
with i = x, r, and y. The solid lines in Fig. 1 show the quality of the fits to these equations. Each dimension has its own asymptotic amplitude Ai and time constant Ti. As shown in the Supporting Material, for spherocylinders with an L/R ratio similar to that of E. coli, the diffusion coefficient D, the time constant Ti, and the asymptotic amplitude Ai are related approximately as follows:
| (2) |
where di is the dimensionality (one for x or y, two for r). For the frame rate, cell radius, and diffusion coefficients of interest here, Fig. S4 shows the dependence of the best values of βx and βy on cell length L + 2R over the range of 2.0–5.0 μm. In Monte Carlo simulations of diffusion in the entire cytoplasm, the best value of βx increases roughly linearly from 1.70 to 1.85. The best value of βy is 1.70, independently of cell length. In Monte Carlo simulations retaining only trajectories that remain within a central 500-nm thick slab (mimicking the depth of focus of the NA = 1.49 objective), the best values of βx are essentially unchanged, whereas the best βy-value becomes 1.32 (Supporting Material).
In a simple procedure with good accuracy, we fit the entire MSDx curve to Eq. 1 to obtain Ax and Tx, and then use the best value of βx to extract D. For the cell in Fig. 1, the best-fit values are Ax = 2.53 μm2 and Tx = 0.198 s. For the length of this cell, the prescribed value βx = 1.75 then yields the diffusion constant DKaede = 7.3 μm2·s−1, in excellent agreement with the value 7.6 μm2·s−1 from the more rigorous treatment using L and R from the PALM spatial distributions and varying DKaede in Monte Carlo simulations to match all three MSD curves. The use of MSDy is much less accurate.
This Ax, Tx method is more accurate than the straight-line fit to the first three points of MSDx (which yields 6.3 μm2·s−1 in this example), but shares the advantage of not requiring accurate values of L and R for each cell. For eight cells examined in detail, the Ax, Tx method gives the same diffusion constant as the Monte Carlo-based fitting method with a root mean-square deviation of only 6%. This simplified method was used to generate the diffusion coefficients for the 22 cells studied in detail. The mean is <DKaede> = 7.3 ± 1.1 μm2·s−1, where the ± value is 1 SD of the distribution of values across cells. A histogram of measured values across cells is shown in Fig. 3.
Figure 3.

(A) Sequence of FRAP images of Kaede for DH5α-strain cells grown in EZRDM. (B) Histograms of DSPT (DKaede from SPT) from 22 cells and DFRAP (DKaede from FRAP) from 23 cells.
To summarize, for Kaede diffusion in the E. coli cytoplasm with our quality of data and frame rate, fitting the first three points of MSDx(τ) to a straight line systematically underestimates DKaede by ∼15%. Fitting the initial slope of MSDr(τ) or MSDy(τ) is highly inaccurate. The Ax, Tx method, which fits MSDx(τ) to Eq. 1 and extracts D from the ratio of Ay/Ty using βx = 1.70–1.85 (depending on cell length), is accurate to ∼6%. Here, the benchmark for the most accurate value of DKaede is the fit based on Monte Carlo simulations in a spherocylindrical geometry determined from the PALM spatial distribution. We have not addressed possible systematic error arising from the modest tapering of the cell body.
Tests for heterogeneity and subdiffusion
A model of free, homogeneous diffusion within the confining volume of the cytoplasm can quantitatively reproduce the nonlinear MSD plots from experiment. However, MSD(τ) plots do not incisively distinguish confined, free diffusion from heterogeneous diffusion (with different particles having different diffusion coefficients, perhaps subject to time-dependent exchange) or from subdiffusion (sublinear time evolution of MSD).
For the set of trajectories from a single cell, the distribution of <x2(τ)>j and <r2(τ)>j among different molecules provides a test for heterogeneity (27). Here, the brackets denote an average over all displacements of lag time τ within the trajectory of a single molecule j. There is no averaging over molecules, as was the case for the MSD plots. We examine the distribution of <x2(τ)>j rather than that of <r2(τ)>j to minimize confinement effects.
For homogeneous diffusion in two dimensions, the distribution of <r2(τ)>j has been given analytically (27). There is no analytical form for the case of free diffusion in one dimension. Therefore, we compared the distribution of Dx,j = <x2(τ)>j/2τ from experiment with that from the Monte Carlo simulations using the mean value <DKaede> = 7.3 ± 1.1 μm2·s−1. The comparison is shown in Fig. 4 for the particular time lag τ = 12.9 ms (three steps), which is only slightly perturbed by confinement. The close agreement provides further support for homogeneous, free diffusion on the timescale and length scale studied. However, for the longest cells, below we will show clear evidence of mild spatial heterogeneity in DKaede that goes undetected in this three-step Dx,j test.
Figure 4.

Experimental distribution of Dx,j = <x2(τ)>j/2τ (three-step estimate of Dx for molecule j, taken from (solid bars) 13-step trajectories of 180 molecules in a single cell and (striped bars) 180 13-step trajectories from Monte Carlo simulations, with D = 7 μm2·s−1 chosen to match the experimental value for that cell. The solid curves show the smooth distribution of Dx,j obtained from 2000 Monte Carlo trajectories.
Similarly, a comparison of both Dx,j and Dy,j distributions for short lag times with analogous Monte Carlo simulations can be used to test whether Kaede diffusion within the cytoplasm is isotropic. We found no evidence that diffusion along x and y differ (data not shown).
To distinguish subdiffusion from confined, free diffusion, Ferrari et al. (15) devised statistical tests based on higher moments of the displacement vector. Accordingly, we analyzed moments of the x-coordinate of the displacement vector up to the 10th moment. The analysis assumes that each moment depends on time as a power law, as in <xn(τ) > = knτ λn, with kn a constant. The scaling coefficients λn are determined by a linear least-square fit of log(<xn >) versus log τ (Fig. S6). A plot of λn versus n is called a moment scaling spectrum (15, 28, 29). For strongly self-similar processes, such as free diffusion, the plot is a straight line through the origin; λ0 is always equal to zero.
For Kaede diffusion data from a particular cell, Fig. 5 shows that the moment scaling spectrum is linear with a slope of 0.46. The average slope over eight cells analyzed in this way was 0.44 ± 0.06 (±1σ). This is smaller than the theoretical value of 0.50 for free diffusion in an infinite space. The difference is probably due to confinement. For comparison, our Monte Carlo simulations in spherocylinders of realistic aspect ratio with trajectory lengths mimicking the experiments yielded linear moment scaling spectra with a slope of 0.46 ± 0.05. Thus, the experimental deviation from a slope of 0.5 is well reproduced by the Monte Carlo results. In free space, the Monte Carlo result was 0.49 ± 0.05. The Ferrari test yields no evidence of Kaede subdiffusion on the timescale and length scale studied here (4 ms and 100 nm, respectively).
Figure 5.

Moments of the scaling spectrum for moments 2–10 obtained from 160 15-step Kaede trajectories from a single cell. The linear least-squares fit (solid line) gives a slope of 0.46. See Fig. S6 for input data.
For five additional cells, we tracked single molecules with a 750.0 μs exposure time and 1.30 kHz frame rate, which is 5.5 times faster than the rate used for most of our studies. Here, the laser intensity must be increased and the enhanced photobleaching shortens the trajectories to a typical duration of four to six steps. For these cells, MSDx is linear over the timescale of 0.75–5.00 ms (Fig. S7). From the slope of the MSDx plots, we obtained <DKaede> = 7.2 ± 3.3 μm2/s (mean of five cells ± 1 SD), consistent with the more elaborate analysis of the data taken at the slower frame rate. There is no evidence of subdiffusion on the timescale of 1 ms and length scale of 100 nm.
Relief of confinement in the x-coordinate by treatment of cells with cephalexin
As a final experimental test, we used the drug cephalexin to inhibit normal cell division and create cells of 8–12 μm length (30). For imaging of cephalexin-treated cells at 234 Hz, MSDx(τ) remains linear for at least nine steps, whereas MSDy reaches an asymptote similar to the unperturbed case (Fig. S8). For 11 cells treated with cephalexin, the initial slope of MSDx(τ) up to the eighth data point was used to obtain the mean diffusion coefficient <DKaede> = 7.2 ± 1.5 μm2/s, which is quite similar to the value of 7.3 ± 1.1 μm2·s−1 for untreated cells. This result further indicates that the nonlinearity in the MSD plots for untreated cells arises from confinement effects.
Comparison of SPT data with FRAP data
One can also obtain the average diffusion constant for the entire population of Kaede molecules in a cell from FRAP (16) using green fluorescence from unphotoswitched Kaede excited at 488 nm. For 23 cells under the same growth conditions, the mean diffusion constant is <DFRAP> = 8.3 ± 1.6 μm2·s−1, in reasonably agreement with the value <DKaede> = 7.3 ± 1.1 μm2·s−1 from the 22 SPT measurements. The two distributions of measurements are compared in Fig. 3. A two-sided Kolmogorov-Smirnov test indicates that the distributions are not significantly different (p = 0.03). On the 50 ms timescale and 2 μm length scale of the FRAP experiment, all of the Kaede molecules are mobile. The mobile fraction is fmobile = 0.98 ± 0.05.
Spatial heterogeneity in Kaede diffusion
In E. coli cells that are growing moderately rapidly, the chromosomal DNA is partially segregated to form two nucleoid lobes near the central axis of the cell while the ribosomes segregate to the endcaps and the region between nucleoid lobes. This axial segregation is shown clearly in images of the same cell with ribosomes labeled by the protein S2-eYFP and with DNA stained by the dye DRAQ5 (Fig. 6, A–C; see also Fig. S10). The DNA density typically peaks at the 1/4 and 3/4 axial positions. Such spatial heterogeneity within the cytoplasm raises the possibility that proteins may diffuse differently in different regions of space.
Figure 6.

(A) Wide-field image of ribosomes in three cells labeled by S2-eYFP construct. (B) Wide-field image of chromosomal DNA in the same cells labeled by DRAQ5. (C) Overlay of the ribosome and DRAQ5 images, showing strong ribosome-nucleoid segregation. (D) 2D Kaede diffusion map in a different cell, with <Dx(x,y)> plotted as a false color map with scale as shown (see text). (E) 1D Kaede diffusion map <Dx(x,y)>y obtained as the weighted average of the 2D map over all y-values at each x.
For the longer E. coli cells, the localization accuracy of PALM indeed reveals mild spatial heterogeneity in the diffusion of Kaede. In Fig. 6 D we show a false-color, 2D diffusion map of <Dx(x,y)> = <Δx2(x,y) /2Δt>. This is the locally averaged, one-step estimate of the mean diffusion coefficient in the x direction at position (x,y). Here Δx2 is the squared one-step displacement vector along x, (x,y) is the initial location, and Δt = 4.3 ms is the camera frame duration. Each step of each trajectory generates a value of Dx at a position (x,y). To form a smoothed 2D diffusion map, we place a 50 nm × 50 nm grid of points over the cell image. Each grid point is assigned the mean of all values of Dx for initial positions lying inside a 200 nm × 200 nm square centered at that grid point. Approximately 10,000 single-step values contribute to the map. The false-color image reports the mean values at each grid point.
To form the 1D axial diffusion map <Dx(x)>y shown in Fig. 6 E, we calculate the weighted mean of Dx over all y-values at each value of x. This highly averaged local diffusion constant dips in the center of the cell. The error bars show 1 SD of the mean of all values averaged at each axial position. Under the same growth conditions, images of DRAQ5-stained DNA (Fig. 6 B) show two nucleoid lobes, peaking at the 1/4 and 3/4 axial positions, for essentially all cells. Images of ribosomes (Fig. 6 A) show three intensity peaks: two in the endcaps and one between the nucleoid lobes. For the particular cell in Fig. 6 D, apparently on average Kaede diffuses ∼20–30% more rapidly in the DNA-rich nucleoid regions than in the ribosome-rich space between nucleoid lobes. The endcaps of the cells are also ribosome-rich, and the mean local diffusion constant is also lower at the endcaps. However, confinement also has a strong effect on <Dx(x)>y in the endcaps, and we did not attempt to separate the two effects.
We applied such an analysis to eight cells that varied in length from 2.9 to 4.4 μm. The three longest cells and two of the five moderate-length cells show a clearly discernible dip in <Dx(x)>y at the mid-cell plane. Among these cells, the peak/valley ratio varied in the approximate range of 1.3–1.8. Three of the five moderate-length cells did not show a clear dip. We suspect this variability arises from the variable degree of segregation of the chromosomal DNA among unphased cells. As illustrated in Fig. S10, in the longer cells, which tend to be at a later stage of the cell cycle, DRAQ5 staining of the DNA shows a deeper minimum in DNA density at the mid-cell plane.
This mild spatial heterogeneity is not inconsistent with the apparent homogeneity inferred from analysis of the MSDi(τ) plots and from the distribution of three-step MSDs along x (Figure 1, Figure 4). Both were derived from averages over all molecules within a cell. As is well known, short trajectories of diffusive motion are very noisy. In the Supporting Material we present Monte Carlo simulation results showing that at short times, two equal populations with time-independent diffusion coefficients that differ by as much as a factor of 2 will yield MSD plots, as well as three-step Dx(τ) distributions that are effectively indistinguishable from those of a homogeneous population of intermediate diffusion coefficient (Fig. S5). Evidently the spatial diffusion maps provide a particularly sensitive way to detect heterogeneity in diffusion behavior.
Meanwhile, the spatial distribution of Kaede molecules is quite uniform throughout the cytoplasmic volume. A lower numerical aperture objective (NA = 1.3) was used to obtain an essentially complete xy spatial distribution of Kaede in the cytoplasm. In Fig. 7 we compare the measured spatial distribution of Kaede y- and x-locations with distributions calculated for a uniformly filled spherocylinder with L = 3.48 μm and R = 360 nm. There is no readily discernible concentration variation along x. The good agreement between experiment and calculated distributions indicates an essentially homogeneous distribution of Kaede within the cytoplasm.
Figure 7.
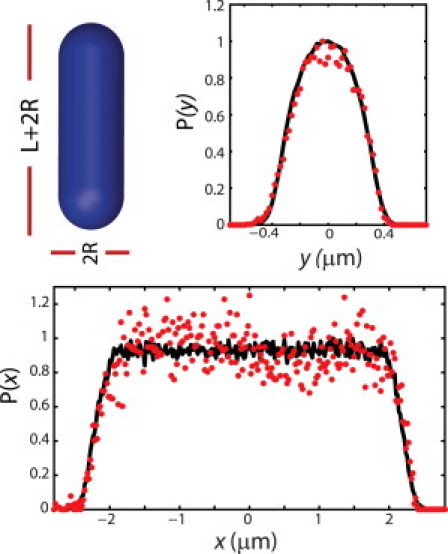
Experimental distribution of Kaede positions (circles) along x and y, as obtained in a single cell by PALM using a 1.3 NA objective. Black lines are simulated projections along x and y for a homogeneously filled spherocylinder whose dimensions L and R were chosen to match experiment. See Fig. S2 for a comparison with results obtained with a 1.49 NA objective.
Discussion
Similarly to GFP, Kaede is a β-barrel of mass 28 kDa. In a typical cell under our expression conditions, the PALM method can activate and detect ∼8000 single Kaede copies. For a cell volume of ∼3 μm3, this corresponds to a detected Kaede concentration of ∼4 μM. This should be considered a lower bound on the Kaede concentration, because not all Kaede molecules will activate properly.
A crystal structure of Kaede revealed compact homotetramers in which one pair of parallel, side-by-side barrels is bound to another pair of parallel, side-by-side barrels whose long axes are rotated by 90° relative to the first pair (10, 11). Multi-angle light-scattering measurements in buffer solution showed the mass of Kaede particles to be 116.0 kDa, 4.3 times the monomer mass. This indicates that Kaede forms stable, compact homotetramers in solution, much like the closely related DsRed protein (11). In the crowded conditions of the E. coli cytoplasm, the propensity to form tetramers will be stronger than in buffer.
In contrast, an FCS study of Kaede in buffer at low-nanometer concentrations (31) yielded diffusion coefficients of 17 μm2·s−1 for the green-fluorescent form and 10 μm2·s−1 for the yellow-fluorescent (photoswitched) form, compared with 67 μm2·s−1 for monomeric GFP. The Stokes-Einstein relation for diffusion of spheres of radius r in solution of viscosity η is D = kBT/6πηr, where T is the temperature and kB is the Boltzmann constant. If the hydrodynamic radius of a globular protein scales roughly as the cube root of its mass, then Kaede4 should diffuse more slowly than a GFP monomer by roughly a factor of the cube root of 4, which is 1.59. Measurements of the GFP diffusion coefficient in buffer vary from 67 to 87 μm2·s−1, so we would expect D(Kaede4) in buffer to be ∼50 μm2·s−1. The Stokes relationship then suggests that the FCS results involve very large aggregates containing hundreds of Kaede molecules, even though the concentration is in the low-nanometer range. The FCS and light-scattering results are not readily reconciled.
We proceed under the assumption that the species under study in the E. coli cytoplasm is Kaede4. Cytoplasmic protein diffusion coefficients are evidently controlled by a variety of factors (16, 18, 32, 33, 34, 35), including the microviscosity of the medium, crowding and hydrodynamic effects (36), transient binding to less-mobile elements, and possible sieving effects due to the tortuosity of space in the presence of complex, branched biopolymers (i.e., DNA–RNA polymerase–mRNA–ribosome–polypeptide chains).
In related work on the DH5α strain of E. coli in LB media at 37°C, Nenninger et al. (33) studied diffusion of a series of head-to-tail GFP oligomers of stoichiometry TorA-(GFP)n, with n = 2–5. The mean diffusion coefficient decreased monotonically with increasing oligomer size, from 9.1 μm2·s−1 for the monomer to 5.5 μm2·s−1 for the tetramer. This decrease by a factor of 1.65 is in good accord with Stokes-Einstein scaling. In the DH5α strain of E. coli cytoplasm studied here, the mean diffusion coefficient for Kaede is <DKaede> = 7.3 ± 1.1 μm2·s−1. This is a factor of 1.3 smaller than that of GFP monomers in an MG1655 strain under the same growth conditions (<DGFP> = 9.5 ± 2.3 μm2·s−1) (18, 30). The result is roughly consistent with Stokes-Einstein scaling assuming a tetrameric Kaede. There is no evidence that cytoplasmic Kaede exists as large oligomers like those suggested by the previous FCS diffusion study in buffer (31).
This result is also in reasonable agreement with the predicted size dependence of diffusion coefficients in cytoplasm from the hard-particle simulation of McGuffee and Elcock (37). The model treats the cytoplasm as a well-mixed collection of hard, realistic protein shapes, but does not include hydrodynamic effects. The strength of attractive forces between proteins is adjusted to fit the GFP diffusion coefficient. For crowding at the level of 300 mg/mL, the simulations would predict D(Kaede4) = 6.6 μm2·s−1. However, the degree of crowding in K12 E. coli in our growth conditions is not known.
Analysis of the MSD(τ) plots in terms of confinement and the distribution of single-molecule Dx values estimated from three-step trajectories (Fig. 4) shows that the data are consistent with free, homogeneous diffusion of Kaede4 on the 1–200 ms timescale and 100 nm–1 μm length scale probed here. Furthermore, the analysis of higher moments of the displacements compared with Monte Carlo results in model spherocylinders revealed no evidence of subdiffusion (Fig. 5).
However, the diffusion map of Fig. 6 reveals a moderate spatial heterogeneity in Kaede diffusion, especially for longer cells. A recent study of the monomeric GFP-like protein mEos2 did not show spatial heterogeneity (9). As shown in Fig. S10, in longer cells the segregation of the two nucleoid lobes is more complete, which correlates with greater enrichment of ribosomes in the region between nucleoid lobes (at the mid-cell plane). The correlation between the enrichment of ribosomes at mid-cell and the decrease of the Kaede diffusion constant at the mid-cell strongly suggests that Kaede diffuses slightly less rapidly in the ribosome-rich regions than in the dense parts of the nucleoid.
The cause of this difference is uncertain. Although Kaede is uniformly distributed in the cytoplasm (Fig. 7), other cytoplasmic components (e.g., DNA and ribosomes) need not be. Spatial partitioning of other cytoplasmic components may underlie the spatial inhomogeneity in Kaede diffusion. One possibility is that the ribosome-rich regions are significantly more crowded than the nucleoid because they contain essentially all of the ribosomes plus a substantial share of globular proteins as well. Larger globular proteins may preferentially partition to the ribosome-rich regions due to excluded volume effects of the DNA. Enhanced crowding within the ribosome-rich regions would be in accord with slower diffusion there. It is also possible that the oligomeric state of Kaede varies in space. Stronger crowding effects within the ribosome-rich region may enhance formation of Kaede tetramers or higher oligomers.
In contrast, possible sieving effects due to the structure of DNA in the nucleoid would work in the opposite direction from the observations, causing slower diffusion within the nucleoid. Evidence for sieving by the branched polymeric structure within the nucleoids is mixed. In a study of diffusion versus protein mass, the fall-off in globular protein diffusion coefficient with size was much faster than predicted by the Stokes-Einstein equation, suggesting sieving (35). Enhanced hydrodynamic effects for larger particles provide an alternative explanation for this fall-off (36). In contrast, the fall-off of diffusion coefficient with size for a sequence of end-to-end GFP oligomers (33) and the diffusion coefficient of Kaede4 reported here are in reasonable accord with Stokes-Einstein expectations. Comparisons of diffusion coefficients among different proteins may be complicated by differential transient binding to less-mobile species in the ribosome-rich region versus the nucleoids. However, the preponderance of evidence indicates that sieving effects are unimportant for globular proteins of mass ∼≤100 kDa.
The homogeneous spatial distribution (i.e., uniform concentration) of Kaede within the entire cytoplasm lies in sharp contrast to earlier results obtained by Valkenburg et al. (12), who used immersive refractometry to estimate the volume fraction of protein inside versus outside the nucleoids. They found substantially larger protein density in the ribosome-rich regions than in the nucleoids. Odijk (13) used this result to build a model of the cytoplasm in which the nucleoid and the surrounding cytoplasm are in osmotic equilibrium, with proteins 2.5 times more concentrated outside the nucleoid than inside. It remains possible that differential partitioning between the nucleoid and ribosome-rich regions indeed occurs for other proteins.
Interpretation of high-resolution SPT data in rod-shaped cells is always complicated by the possibility of confounding effects due to confinement and subdiffusion. We have shown that separating motion along the axial coordinate x from that along the transverse coordinate y is useful for minimizing confinement effects on MSD plots. Curve-fitting to the model exponential function of Eq. 1 with the parameter βi set to 1.70–1.85 (depending on cell length) can further enhance the accuracy without requiring extensive Monte Carlo modeling for each cell. A long-term goal is to measure spatial distributions and diffusion maps for a variety of proteins of varying size and charge to provide a much more complete picture of cytoplasmic organization.
Acknowledgments
We thank Prof. Doug Weibel (Department of Biochemistry, University of Wisconsin-Madison) for providing the Kaede plasmid. We also thank Dr. Colin J. Ingram and Ms. Renee Dalrymple for help in developing the tracking programs and the PALM apparatus.
This work was supported by the National Institute of General Medical Sciences (R01-GM086468, an American Recovery and Reinvestment Act grant, to S.B., B.P.B., and J.C.W.). B.P.B. was supported in part by a National Institutes of Health training grant (T32-GM08293).
Editor: Paulo Almeida.
Footnotes
Further details, including 10 figures, a table, and references (including (38) are available at http://www.biophysj.org/biophysj/supplemental/S0006-3495(11)01202-1.
Supporting Material
References
- 1.Betzig E., Patterson G.H., et al. Hess H.F. Imaging intracellular fluorescent proteins at nanometer resolution. Science. 2006;313:1642–1645. doi: 10.1126/science.1127344. [DOI] [PubMed] [Google Scholar]
- 2.Hess S.T., Girirajan T.P.K., Mason M.D. Ultra-high resolution imaging by fluorescence photoactivation localization microscopy. Biophys. J. 2006;91:4258–4272. doi: 10.1529/biophysj.106.091116. [DOI] [PMC free article] [PubMed] [Google Scholar]
- 3.Rust M.J., Bates M., Zhuang X.W. Sub-diffraction-limit imaging by stochastic optical reconstruction microscopy (STORM) Nat. Methods. 2006;3:793–795. doi: 10.1038/nmeth929. [DOI] [PMC free article] [PubMed] [Google Scholar]
- 4.Manley S., Gillette J.M., et al. Lippincott-Schwartz J. High-density mapping of single-molecule trajectories with photoactivated localization microscopy. Nat. Methods. 2008;5:155–157. doi: 10.1038/nmeth.1176. [DOI] [PubMed] [Google Scholar]
- 5.Niu L., Yu J. Investigating intracellular dynamics of FtsZ cytoskeleton with photoactivation single-molecule tracking. Biophys. J. 2008;95:2009–2016. doi: 10.1529/biophysj.108.128751. [DOI] [PMC free article] [PubMed] [Google Scholar]
- 6.Biteen J.S., Moerner W.E. Single-molecule and superresolution imaging in live bacteria cells. Cold Spring Harb. Perspect. Biol. 2010;2:a000448. doi: 10.1101/cshperspect.a000448. [DOI] [PMC free article] [PubMed] [Google Scholar]
- 7.Fu G., Huang T., et al. Xiao J. In vivo structure of the E. coli FtsZ-ring revealed by photoactivated localization microscopy (PALM) PLoS ONE. 2010;5:e12682. doi: 10.1371/journal.pone.0012680. [DOI] [PMC free article] [PubMed] [Google Scholar]
- 8.Lee S.F., Thompson M.A., et al. Moerner W.E. Super-resolution imaging of the nucleoid-associated protein HU in Caulobacter crescentus. Biophys. J. 2011;100:L31–L33. doi: 10.1016/j.bpj.2011.02.022. [DOI] [PMC free article] [PubMed] [Google Scholar]
- 9.English B.P., Hauryliuk V., et al. Elf J. Single-molecule investigations of the stringent response machinery in living bacterial cells. Proc. Natl. Acad. Sci. USA. 2011;108:E365–E373. doi: 10.1073/pnas.1102255108. [DOI] [PMC free article] [PubMed] [Google Scholar]
- 10.Hayashi I., Mizuno H., et al. Ikura M. Crystallographic evidence for water-assisted photo-induced peptide cleavage in the stony coral fluorescent protein Kaede. J. Mol. Biol. 2007;372:918–926. doi: 10.1016/j.jmb.2007.06.037. [DOI] [PubMed] [Google Scholar]
- 11.Ando R., Hama H., et al. Miyawaki A. An optical marker based on the UV-induced green-to-red photoconversion of a fluorescent protein. Proc. Natl. Acad. Sci. USA. 2002;99:12651–12656. doi: 10.1073/pnas.202320599. [DOI] [PMC free article] [PubMed] [Google Scholar]
- 12.Valkenburg J.A., Woldringh C.L. Phase separation between nucleoid and cytoplasm in Escherichia coli as defined by immersive refractometry. J. Bacteriol. 1984;160:1151–1157. doi: 10.1128/jb.160.3.1151-1157.1984. [DOI] [PMC free article] [PubMed] [Google Scholar]
- 13.Odijk T. Osmotic compaction of supercoiled DNA into a bacterial nucleoid. Biophys. Chem. 1998;73:23–29. doi: 10.1016/s0301-4622(98)00115-x. [DOI] [PubMed] [Google Scholar]
- 14.Saxton M.J. A biological interpretation of transient anomalous subdiffusion. I. Qualitative model. Biophys. J. 2007;92:1178–1191. doi: 10.1529/biophysj.106.092619. [DOI] [PMC free article] [PubMed] [Google Scholar]
- 15.Ferrari R., Manfroi A.J., Young W.R. Strongly and weakly self-similar diffusion. Physica D. 2001;154:111–137. [Google Scholar]
- 16.Konopka M.C., Shkel I.A., et al. Weisshaar J.C. Crowding and confinement effects on protein diffusion in vivo. J. Bacteriol. 2006;188:6115–6123. doi: 10.1128/JB.01982-05. [DOI] [PMC free article] [PubMed] [Google Scholar]
- 17.Neidhard F.C., Bloch P.L., Smith D.F. Culture medium for enterobacteria. J. Bacteriol. 1974;119:736–747. doi: 10.1128/jb.119.3.736-747.1974. [DOI] [PMC free article] [PubMed] [Google Scholar]
- 18.Sochacki K.A., Shkel I.A., et al. Weisshaar J.C. Protein diffusion in the periplasm of E. coli under osmotic stress. Biophys. J. 2011;100:22–31. doi: 10.1016/j.bpj.2010.11.044. [DOI] [PMC free article] [PubMed] [Google Scholar]
- 19.Crocker J.C., Grier D.G. Methods of digital video microscopy for colloidal studies. J. Colloid. Interfacial Sci. 1996;179:298–310. [Google Scholar]
- 20.Michalet X. Mean square displacement analysis of single-particle trajectories with localization error: Brownian motion in an isotropic medium. Phys. Rev. E. 2010;82:041914. doi: 10.1103/PhysRevE.82.041914. [DOI] [PMC free article] [PubMed] [Google Scholar]
- 21.Sbalzarini I.F., Mezzacasa A., et al. Koumoutsakos P. Effects of organelle shape on fluorescence recovery after photobleaching. Biophys. J. 2005;89:1482–1492. doi: 10.1529/biophysj.104.057885. [DOI] [PMC free article] [PubMed] [Google Scholar]
- 22.Olveczky B.P., Verkman A.S. Monte Carlo analysis of obstructed diffusion in three dimensions: application to molecular diffusion in organelles. Biophys. J. 1998;74:2722–2730. doi: 10.1016/S0006-3495(98)77978-0. [DOI] [PMC free article] [PubMed] [Google Scholar]
- 23.Jin S., Verkman A.S. Single particle tracking of complex diffusion in membranes: simulation and detection of barrier, raft, and interaction phenomena. J. Phys. Chem. B. 2007;111:3625–3632. doi: 10.1021/jp067187m. [DOI] [PubMed] [Google Scholar]
- 24.Saxton M.J. Single-particle tracking: the distribution of diffusion coefficients. Biophys. J. 1997;72:1744–1753. doi: 10.1016/S0006-3495(97)78820-9. [DOI] [PMC free article] [PubMed] [Google Scholar]
- 25.Anderson C.M., Georgiou G.N., et al. Cherry R.J. Tracking of cell surface receptors by fluorescence digital imaging microscopy using a charge-coupled device camera. Low-density lipoprotein and influenza virus receptor mobility at 4 degrees C. J. Cell Sci. 1992;101:415–425. doi: 10.1242/jcs.101.2.415. [DOI] [PubMed] [Google Scholar]
- 26.Bickel T. A note on confined diffusion. Physica A. 2007;377:24–32. [Google Scholar]
- 27.Vrljic M., Nishimura S.Y., et al. McConnell H.M. Translational diffusion of individual class II MHC membrane proteins in cells. Biophys. J. 2002;83:2681–2692. doi: 10.1016/S0006-3495(02)75277-6. [DOI] [PMC free article] [PubMed] [Google Scholar]
- 28.Ewers H., Smith A.E., et al. Helenius A. Single-particle tracking of murine polyoma virus-like particles on live cells and artificial membranes. Proc. Natl. Acad. Sci. USA. 2005;102:15110–15115. doi: 10.1073/pnas.0504407102. [DOI] [PMC free article] [PubMed] [Google Scholar]
- 29.Sbalzarini I.F., Koumoutsakos P. Feature point tracking and trajectory analysis for video imaging in cell biology. J. Struct. Biol. 2005;151:182–195. doi: 10.1016/j.jsb.2005.06.002. [DOI] [PubMed] [Google Scholar]
- 30.Elowitz M.B., Surette M.G., et al. Leibler S. Protein mobility in the cytoplasm of Escherichia coli. J. Bacteriol. 1999;181:197–203. doi: 10.1128/jb.181.1.197-203.1999. [DOI] [PMC free article] [PubMed] [Google Scholar]
- 31.Dittrich P.S., Schäfer S.P., Schwille P. Characterization of the photoconversion on reaction of the fluorescent protein Kaede on the single-molecule level. Biophys. J. 2005;89:3446–3455. doi: 10.1529/biophysj.105.061713. [DOI] [PMC free article] [PubMed] [Google Scholar]
- 32.Konopka M.C., Sochacki K.A., et al. Weisshaar J.C. Cytoplasmic protein mobility in osmotically stressed Escherichia coli. J. Bacteriol. 2009;191:231–237. doi: 10.1128/JB.00536-08. [DOI] [PMC free article] [PubMed] [Google Scholar]
- 33.Nenninger A., Mastroianni G., Mullineaux C.W. Size dependence of protein diffusion in the cytoplasm of Escherichia coli. J. Bacteriol. 2010;192:4535–4540. doi: 10.1128/JB.00284-10. [DOI] [PMC free article] [PubMed] [Google Scholar]
- 34.Mika J.T., van den Bogaart G., et al. Poolman B. Molecular sieving properties of the cytoplasm of Escherichia coli and consequences of osmotic stress. Mol. Microbiol. 2010;77:200–207. doi: 10.1111/j.1365-2958.2010.07201.x. [DOI] [PubMed] [Google Scholar]
- 35.Kumar M., Mommer M.S., Sourjik V. Mobility of cytoplasmic, membrane, and DNA-binding proteins in Escherichia coli. Biophys. J. 2010;98:552–559. doi: 10.1016/j.bpj.2009.11.002. [DOI] [PMC free article] [PubMed] [Google Scholar]
- 36.Ando T., Skolnick J. Crowding and hydrodynamic interactions likely dominate in vivo macromolecular motion. Proc. Natl. Acad. Sci. USA. 2010;107:18457–18462. doi: 10.1073/pnas.1011354107. [DOI] [PMC free article] [PubMed] [Google Scholar]
- 37.McGuffee S.R., Elcock A.H. Diffusion, crowding & protein stability in a dynamic molecular model of the bacterial cytoplasm. PLOS Comput. Biol. 2010;6:e1000694. doi: 10.1371/journal.pcbi.1000694. [DOI] [PMC free article] [PubMed] [Google Scholar]
- 38.Schäfer S.P., Dittrich P.S., et al. Schwille P. Single molecule fluorescence imaging of the photoinduced conversion and bleaching behavior of the fluorescent protein Kaede. Microsc. Res. Tech. 2006;69:210–219. doi: 10.1002/jemt.20283. [DOI] [PubMed] [Google Scholar]
Associated Data
This section collects any data citations, data availability statements, or supplementary materials included in this article.